Dr Rajiv Desai
An Educational Blog
Weather Forecasting
Weather Forecasting:
_
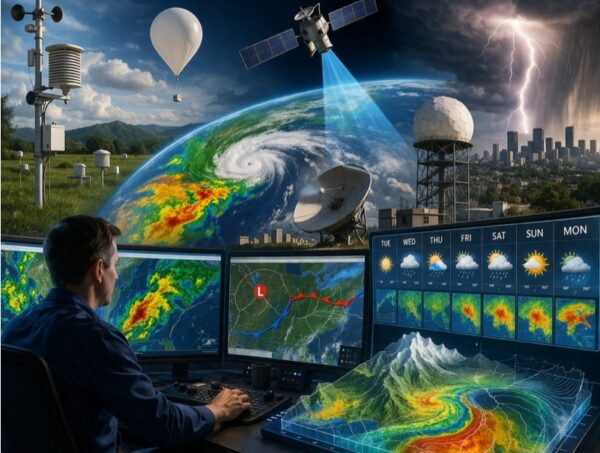
Figure above shows overview of modern weather forecasting tools including satellites, radar systems, and computer models.
______
“A change in the weather is sufficient to recreate the world and ourselves.”
― Marcel Proust
“It only takes one flap of a butterfly’s wings to set off a tornado on the other side of the world.”
— Edward Lorenz
______
Section-1
Prologue:
Since the dawn of human existence, the sky has been our grand stage. Long before there were cities, written languages, or even the idea of “science,” people tilted their faces toward the heavens and watched the eternal performance of sun, moon, wind, and clouds. The weather was the most immediate, intimate force shaping daily life. It determined whether our ancestors could hunt or gather food, whether they might face warmth or cold, safety or peril. To them, the sky was not an abstract concept; it was as present and powerful as fire or water. Weather forecasts have been around since the beginning of civilization, when humans used recurring meteorological and astronomical events to better monitor weather patterns and plan for seasonal changes. Initially based on (mostly inaccurate) observations of the sky, wind, and temperature, these forecasts have thankfully evolved into more advanced and reliable ones. The theory of forecasting is based on the premise that current and past knowledge can be used to make predictions about the future. Incorporating technology into weather forecasting began in the 1700s with the development of the barometer and thermometer. Even today, in an age of satellites and supercomputers, the weather holds the same primal pull on our emotions. The roll of distant thunder still quickens the heart. The sudden clearing after a storm feels like a gift. The quiet fall of snow transforms entire cities into strange, muffled landscapes. Weather is not merely a collection of sky conditions; it is the living, breathing expression of Earth’s atmosphere at a particular moment and place. It’s the reason mornings can be still and afternoons wild. It’s the interplay of heat and moisture, pressure and wind, sunlight and shadow. The desire to be able to forecast future weather has been a goal of humans since the earliest times, as captured in the story of Noah in the Bible.
_
Imagine a rotating sphere that is 12,800 kilometers (8000 miles) in diameter, has a bumpy surface, is surrounded by a 40-kilometer-deep mixture of different gases whose concentrations vary both spatially and over time, and is heated, along with its surrounding gases, by a nuclear reactor 150 million kilometers (93 million miles) away. Imagine also that this sphere is revolving around the nuclear reactor and that some locations are heated more during one part of the revolution and other locations are heated during another part of the revolution. And imagine that this mixture of gases continually receives inputs from the surface below, generally calmly but sometimes through violent and highly localized injections. Then, imagine that after watching the gaseous mixture, you are expected to predict its state at one location on the sphere one, two, or more days into the future. This is essentially the task encountered day by day by a weather forecaster. Imagine our weather if Earth were completely motionless, had a flat dry landscape and an un-tilted axis. This of course is not the case; if it were, the weather would be very different. The local weather that impacts our daily lives results from large global patterns in the atmosphere caused by the interactions of solar radiation, Earth’s large ocean, diverse landscapes, and motion in space. Out of a number of meteorological factors, temperature, pressure, wind, humidity, and precipitation have the greatest influence on a location’s weather.
_
It is a little-known fact that perhaps one of the most important weather forecasts ever made was the one for D-Day, the Allied invasion of France. For the Allied invasion to have any chance of success, General Eisenhower – Supreme Commander of the Allied Forces – needed a full moon, a low tide, little cloud cover, light winds, and low seas. The low tide was necessary to allow soldiers to see, avoid, and disarm the mined obstacles. In June 1944, a full moon and low tide coincided on June 5, 6 and 7. The invasion of France had been scheduled for June 5, 1944. But weather observations taken in western Ireland on 3 June alerted the Allies to an approaching storm. Allied commanders faced an agonizing choice: launch the invasion under uncertain and worsening weather conditions, or delay and risk losing the narrow tidal window – as well as the crucial element of surprise – essential for the mission’s success. At the center of that decision was a stark disagreement between two competing approaches to weather forecasting. Group Captain James Stagg, a meticulous Scottish meteorologist, relied on emerging scientific techniques combining real-time barometric data with observations from ships and weather stations across the Atlantic. In contrast, Col. Irving P. Krick, the lead American forecaster, placed greater confidence in historical weather patterns, charts, and the more traditional forecasting methods that had been used up until that time. Krick confidently predicted clear skies and ideal landing conditions for Monday, June 5, 1944. Stagg strongly disagreed, warning that a major storm system would make landing on the Normandy beaches impossible and could cost thousands of soldiers’ lives. Eisenhower ultimately trusted Stagg’s more cautious analysis, delaying the invasion by 24 hours. That decision proved decisive: the severe weather Stagg predicted arrived on June 5, while a brief lull on June 6 created the narrow window that made the invasion possible. When Eisenhower was asked by then-President-elect John F. Kennedy on inauguration day, 1961, what the decisive factor was in his D-Day victory, he was reported to have responded: “We had better meteorologists than the Germans.”
_
On July 23, 2026, massive cloudburst rainfall triggered significant waterlogging, localized flooding, and emergency rescue operations in Gujarat, Silvassa and Daman. Thousands of cars, shops and houses were submerged in rain floods. Heavy downpours exceeding 220 mm caused severe waterlogging and necessitated evacuations in Daman. Lack of advanced Doppler systems directly in urban clusters like Ahmedabad, Surat, and Gandhinagar resulted in poor real-time precipitation tracking. I lived in Daman and as I woke up in the morning of July 23, there was no electricity and mobile showed no network. Unprecedented heavy rainfall created havoc in Daman, Silvassa and Gujarat. My clinic was closed as all roads were waterlogged. It was unusual day for me as a doctor: no light, no network, and no patient. Due to absence of doppler radar in the region, rain forecasting was poor and everybody suffered in the region. Climate change is directly linked to the increase in intensity and frequency of extreme weather events such as heatwaves, heavy rainfall, droughts, floods and hurricanes. In this context, anticipating such extreme events with accurate weather forecasts is of the highest importance in order to provide early warnings to the population and adapt to climate change.
_
Imagine a farmer standing in his field in early June in India, watching dark monsoon clouds gather on the horizon and wondering whether the rains will arrive today—or a week later. If the rains arrive on time, the crops may flourish. But if rainfall is delayed or weaker than expected, the seeds and precious savings invested in farming may be lost. Across India, millions of such decisions are made every day—not only by farmers but also by fishermen, airline operators, disaster management agencies, and power companies. Increasingly, these decisions rely on weather forecasts. Weather forecasting today relies on a complex chain of observations, models, and communication systems. While scientific advances have improved forecast accuracy, a gap often remains between what forecasts predict and what people experience on the ground. Despite technological advances, weather forecasts are still often incorrect. Weather is extremely difficult to predict, because it is a very complex and chaotic system.
_
In October 2024, Hurricane Milton turned into one of the fastest-growing storms on record over the Atlantic Ocean. The hurricane’s rapid gain in intensity caught meteorologists off guard, which meant the affected communities were surprised too. The storm ultimately claimed 15 lives and caused US $34 billion in damages as it tore across Florida. Why was Milton’s explosive growth so hard to anticipate? This failure stemmed from a lack of good weather data. The kind of data you can get only by flying a suitably outfitted aircraft straight into a developing storm. This type of mission requires human pilots to put their lives at risk to release dropsondes—sensors dangling from parachutes—that will gather critical atmospheric measurements. If meteorologists can get that precious data in time, they can often use it to produce life-saving predictions. But hurricane hunters can fly only so many missions, and most storms develop in places that aircraft can’t safely reach, such as over vast ocean expanses. So, we are left with massive data gaps precisely where the most dangerous weather begins.
_
All modern forecasting uses the Numerical Weather Prediction system (NWP). This is a mathematical model which aims to predict the evolution of weather systems based on the current weather status. The inputs to the model are numerous – inputs based on surface observations (barometric readings, temperature, wind direction, wind speed, precipitation), coastal weather stations, weather ships, buoys, radiosondes (helium filled balloons with transmitters, released into the atmosphere), commercial ships and planes, meteorological satellites (taking pictures of cloud formation) and weather radars. The various weather agencies, national or otherwise, pool their information so that sufficient data is available for the area, and its surrounds, of which a forecast is being made. This can mean thousands of miles either side of the longitudes. This dazzling array of data is fed into the computer system, which then attempts to “roll forward” the current weather status into the future, using equations derived from studies of the physical processes at work in the atmosphere. Weather theory is so advanced that forecasts are, by and large, very accurate over short time periods. However, despite the sophistication of modern weather techniques, the accuracy of forecasts falls dramatically as the time period is extended from 1 to 5 days. Further out than 5 days and any forecast, must be taken with a large grain of salt. The reason for this is the inherent chaos in any complex system. This was described by Edward Lorenz memorably as the “Butterfly Effect” – that small changes in the initial conditions can have large, unintended effects. Modern weather forecasting addresses the Butterfly effect by using “ensemble forecasting”. The weight of science in weather forecasting, the multitude of disciplines that it combines (meteorology, climatology, hydrometeorology, physics, fluid dynamics, hydrology, astronomy, telecommunications, linear algebra, partial differential calculus, chaos theory, aerology, nephology to name but a few) and the sheer range of uses to which it is put (agriculture – when the harvests can proceed; maritime – whether that boat should sail; air – whether that flight should take off, when it will land; supermarkets and electricity companies – try to estimate future demand based on forecast weather; extreme weather warnings – tornadoes and floods) must rank the science of weather forecasting as one of the most significant achievements in the history of mankind.
_
Weather forecasting is vital for various sectors, from agriculture to transportation and disaster management. The accuracy and timeliness of weather predictions significantly impact decision-making processes, resource allocation, and risk mitigation strategies. However, traditional forecasting methods often face challenges in accurately capturing complex weather patterns and providing reliable long-term forecasts. These methods rely heavily on numerical models and historical data, which may not adequately account for dynamic environmental factors and nonlinear relationships within the atmosphere. Additionally, issues such as data scarcity, model complexity, and computational limitations hinder the scalability and effectiveness of traditional forecasting approaches. The problem, therefore, lies in the need to improve the accuracy, scalability, and interpretability of weather forecasting models. This involves developing innovative techniques that can effectively assimilate diverse sources of data, including satellite imagery, ground observations, and atmospheric measurements, while also leveraging advanced machine learning algorithms to extract meaningful insights from these data sources. Furthermore, addressing the challenges of model interpretability and uncertainty quantification is crucial for enhancing trust in weather forecasts and facilitating informed decision-making by end-users. Overall, the goal is to advance the state-of-the-art in weather forecasting, enabling more accurate and reliable predictions that can better support various applications and societal needs.
_
Weather forecasts are better than they ever have been. According to the World Meteorological Organization (WMO), a 5-day weather forecast today is as reliable as a 2-day forecast was 20 years ago! This is because forecasters now use advanced technologies to gather weather data, along with the world’s most powerful computers. Together, the data and computers produce complex models that more accurately represent the conditions of the atmosphere. These models can be programmed to predict how the weather will change. Despite these advances, weather forecasts are still often incorrect. Weather is extremely difficult to predict, because it is a very complex and chaotic system: tiny errors in today’s measurements grow rapidly, so two near-identical starting points soon diverge into completely different outcomes (the butterfly effect). Forecasts out to about 5 days are roughly 90% accurate, but beyond two weeks reliable prediction becomes essentially impossible. We cannot take into account all of the variables that determine the state of the weather. We also can’t determine them with perfect accuracy. If, theoretically, we could do both, then and only then could we obtain a system that could predict the weather with 100% accuracy. But alas, that is impossible. We can collect more data and improve the accuracy of our data. We can use better supercomputers and improve the resolutions of our atmospheric imaging, but it is impossible to map every molecule and their trajectory in the atmosphere. Therefore, our data will always be incomplete and our results will be inaccurate, at least by a small margin. There will always be some amount of assumptions and approximations involved, which would skew the final results. Because chaos keeps amplifying those tiny errors, even with a perfect model the useful limit for detailed day-to-day weather prediction is only about two weeks. It is against this background that I venture into studying weather forecasting that is harder than rocket science because the atmosphere is a chaotic system governed by non-linear fluid dynamics, whereas rockets follow precise, predictable laws of physics.
_______
_______
Abbreviations and synonyms:
ASOS = Automated Surface Observing System
DALR = Dry Adiabatic Lapse Rate
MALR = Moist Adiabatic Lapse Rate
CAPE = convective available potential energy
NWP = Numerical weather prediction
GCM = Global Climate Model
GFS = Global Forecast System
HRES = High-Resolution Forecast,
IFS = Integrated Forecasting System
AIFS = Artificial Intelligence Forecasting System
HRRR = High Resolution Rapid Refresh
NAM = North American Mesoscale Forecast System
ECMWF = European Centre for Medium-Range Weather Forecasts
hPa = Hectopascals = millibars
HPC = high-performance computing
PoP = Probability of Precipitation
MSE = Mean squared error
ENSO = El Niño-Southern Oscillation
NAO = North Atlantic Oscillation
MOS = Model Output Statistics
______
______
Glossary:
2 meter temperature
Standard air temperature measured at 2 meters (about 6.5 feet) above the ground, representing the level where humans experience ambient weather. It is the primary metric used in meteorological forecasts, weather reports, and climate monitoring because it avoids extreme ground-level heat or cold variations.
10 meter wind
Meteorology uses 10 meters as the global standard height for wind speed and anemometer placement to avoid surface friction distortions from grass, bushes, and low-level obstacles.
Aperiodic
describing any phenomenon that occurs at random rather than at regularly occurring intervals, such as found in most weather cycles, rendering them virtually unpredictable
analog weather forecasting
an approach that uses the weather behavior of the past to predict what a current weather pattern will do in the future
adiabat
A line drawn on a thermodynamic diagram along which an air parcel moves as it ascends or descends through the atmosphere, cooling or warming adiabatically; the path followed by this line depends on whether it is a dry adiabat or a saturated adiabat.
adiabatic cooling
An adiabatic process of expansional cooling, in which a rising air parcel decreases in temperature as it increases in volume.
adiabatic heating
An adiabatic process of compressional warming, in which a sinking air parcel increases in temperature as it decreases in volume.
adiabatic lapse rate
Air cools as it rises because air pressure decreases with altitude. As a pocket of air goes higher, less air weighs down from above, allowing the parcel to expand. This expansion uses up energy, which drops the temperature of the air through a process called adiabatic cooling. Adiabatic lapse rate is the rate at which a parcel of air changes temperature adiabatically as it moves vertically through the atmosphere. The parcel’s moisture content affects this rate: as it rises, a parcel saturated with moisture cools more slowly than a dry parcel because the release of latent heat at the phase change between gas and liquid acts to buffer the temperature decrease caused by the adiabatic expansion. When not otherwise qualified, the term most often refers to the dry adiabatic lapse rate. Dry Adiabatic Lapse Rate (DALR) is the rate at which unsaturated air cools as it rises, approximately 9.8°C per kilometer.
aerography
The production of weather charts.
air current
Any concentrated area of winds that develops because of differences in pressure and/or temperature between adjacent air parcels. They are generally divided into horizontal and vertical currents and exist at a variety of scales and in various layers of the atmosphere.
Air Column
A vertical section of the atmosphere extending upward from a particular location, often used in model predictions.
Air Mass
A large body of air with uniform temperature, humidity, and pressure characteristics. Classified by origin (continental/maritime) and temperature (polar/tropical/arctic).
Air Parcel
A small, hypothetical volume of air used in atmospheric studies, assumed to remain isolated as it rises or sinks.
Air Quality Index (AQI)
A measure used to describe the level of air pollution and its potential health effects.
aloft
Located in the atmosphere at some height (often significantly high) above the Earth’s surface. The term is typically used to distinguish an upper-air observation from a surface weather observation, as in “winds aloft”.
altimeter
A scientific instrument used to measure the altitude of an object (e.g. a weather balloon) with respect to a fixed level such as sea level.
anabatic wind
A wind that blows upslope from the low elevations of a valley to the higher elevations of surrounding hills or mountains as the result of daytime surface heating in the valley, usually at speeds of 12 knots (22 km/h; 14 mph) or less but occasionally at much higher speeds.
Anemometer
A scientific instrument used to measure wind speed.
anticyclone
Any large-scale air mass characterized by outward spiralling winds which circulate around a strong center of high atmospheric pressure. Surface-based anticyclones generally bring about cool, dry air and clear skies and are often implicated in weather phenomena such as fog and haze.
anticyclonic storm
Any storm system involving an anticyclone, in which winds circulate around a region of high pressure in the direction opposite to that expected around a region of low pressure. Anticyclonic storms rotate clockwise in the Northern Hemisphere and counterclockwise in the Southern Hemisphere.
Atlantic hurricane
A tropical cyclone (locally known as a hurricane) that forms in the Atlantic Ocean and achieves one-minute maximum sustained winds exceeding 74 mph (119 km/h; 64 kn). Most of these storms occur between June 1 and November 30 each year, a time period referred to as the Atlantic hurricane season.
atmosphere
The envelope of gases surrounding Earth, divided into layers: troposphere, stratosphere, mesosphere, thermosphere, and exosphere; and held in place by gravity. The Earth’s atmosphere is the origin of the weather phenomena studied in meteorology. Atmospheric composition, temperature, and pressure vary across a series of distinct sublayers including the troposphere and stratosphere.
atmospheric circulation
The global-scale movement of air masses within the Earth’s atmosphere. All meteorological phenomena are consequences of the atmospheric circulation, which manifests as a network of both latitudinal and longitudinal “cells” of convective activity; together with ocean circulation, these cells are the primary means by which thermal energy from the Sun is distributed across the Earth’s surface.
atmospheric density (ρ)
The density (mass per unit volume) of the Earth’s atmosphere. Atmospheric density generally decreases proportionally with elevation above sea level, and also tends to vary with changes in atmospheric pressure, temperature, and humidity. According to the International Standard Atmosphere, at a pressure of 1 atm and a temperature of 15° C, air has a density of approximately 1.225 kilograms per cubic metre (kg/m3), about 1⁄1000 the density of liquid water.
atmospheric pressure (p)
The pressure exerted by the Earth’s atmosphere. In most circumstances atmospheric pressure is closely approximated by the hydrostatic pressure caused by the weight of the air above the measurement point, and therefore decreases proportionally as altitude increases. The average atmospheric pressure at sea level on Earth is equal to approximately 1 standard atmosphere (atm), which is defined as exactly 101,325 pascals (760 mmHg) or 1013.25 hPa.
atmospheric sounding
A measurement of the vertical distribution of physical properties through an atmospheric column, usually including pressure, temperature, wind speed and direction, moisture content, ozone concentration, and pollution, among others.
atmospheric temperature
A measure of temperature at one or more locations within the Earth’s atmosphere. Temperatures recorded in the atmosphere can vary widely with altitude, humidity, and solar irradiance, among other factors.
backscatter
The diffuse reflection of waves, particles, or signals back to the same direction from which they originated. Backscattering is the principle underlying all weather radar systems, which can distinguish radar returns backscattered from target aerosols such as raindrops and snowflakes because the strength of the returns depends largely on the size and reflectivity of the targets.
barograph
A scientific instrument used to measure and continuously record changes in atmospheric pressure over time.
baroclinity
A measure of the misalignment between a pressure gradient and a density gradient in a stratified fluid such as the atmosphere. In the context of meteorology, a baroclinic atmosphere is one in which atmospheric density depends on both temperature and pressure, in contrast to a barotropic atmosphere, in which density depends only on pressure. Areas of high atmospheric baroclinity are generally found in the temperate and polar latitudes and are characterized by the frequent formation of cyclones.
barotropity
The close alignment between a pressure gradient and a density gradient in a stratified fluid such as the atmosphere. In the context of meteorology, a barotropic atmosphere is one in which atmospheric density depends only on pressure and is more or less independent of temperature, in contrast to a baroclinic atmosphere. Unlike liquids, gaseous fluids such as the air in the atmosphere are generally not barotropic, but the assumption of barotropity can nonetheless be useful in modeling fluid behavior. Tropical latitudes are more nearly barotropic than the mid-latitudes because air temperature is more nearly horizontally uniform in the tropics.
barometer
A scientific instrument used to measure atmospheric pressure. The two most common types are mercury barometers and aneroid barometers.
Bernoulli’s principle
Bernoulli’s principle states that when a fluid (liquid or gas) moves faster, the internal pressure in that fluid goes down. It comes from the rule that energy must stay the same in a steady, smooth flow. When speed goes up, kinetic energy goes up, so pressure must go down.
Beaufort Scale
A scale ranging from 0 (calm) to 12 (hurricane) that estimates wind speed based on observed conditions.
block
A nearly stationary pattern in the atmospheric pressure field overlying a large geographic area, which effectively “blocks” or diverts the movements of cyclones and other convective systems. These blocks can remain in place for days or weeks, causing the areas affected by them to experience the same kind of weather for extended periods of time.
bow echo
A characteristic radar return from a mesoscale convective system that is shaped like an archer’s bow and usually associated with squall lines or lines of convective thunderstorms. The distinct bow shape is a result of the focusing of a strong flow at the rear of the system. Especially strong bow echoes may develop into derechos.
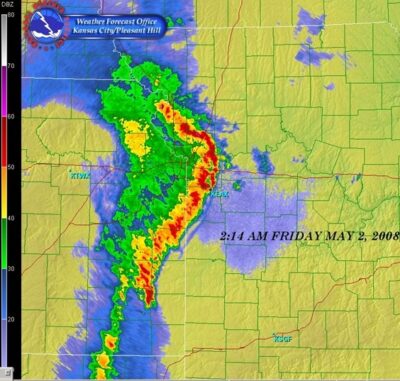
Figure above shows a radar image showing a distinct bow echo in a line of thunderstorms over Kansas City, Missouri.
Buys Ballot’s law
A meteorological heuristic derived from the general observation that, in the Northern Hemisphere, if an observer stands with their back to the wind (i.e. facing the direction toward which the wind is blowing), atmospheric pressure is lower on the observer’s left and higher on the observer’s right. This is because air moves counterclockwise around low-pressure centers in the Northern Hemisphere, a consequence of the Coriolis force; the phenomenon is reversed in the Southern Hemisphere. The rule holds approximately true at high latitudes, where the angle between the wind direction and the pressure gradient force is generally nearly perpendicular, but is less reliable or even absent at low latitudes.
calm
A state of the atmosphere in which there is virtually no horizontal motion of the air. It corresponds to force number 0 on the Beaufort scale, with a wind speed less than 1 kn (1.9 km/h). Calm conditions are common in the subtropical high-pressure belts and in the doldrums.
ceiling
A measure of the height above the Earth’s surface of the base of the lowest layer of clouds or obscuring phenomena that covers more than half of the sky (more than four oktas). An “unlimited” ceiling means either that the sky is mostly free of cloud cover or that the clouds are sufficiently high so as not to impede aircraft operation by visual flight rules.
ceiling balloon
A type of weather balloon used by meteorologists to determine the height of the cloud base above ground level during daylight hours by measuring the time it takes for the balloon, released from the ground and rising at a known rate of ascent, to begin to disappear into the clouds.
Ceilometer
An instrument that uses a laser transmitter or other light source and a collocated receiver to determine the height of a cloud ceiling or cloud base overhead, or to measure the concentration of aerosols within the atmosphere.
Cell
(1. Any atmospheric circulation feature that is more or less closed, occurring at any of number of scales, including massive latitudinally oriented circulations such as Hadley cells; mesoscale motions that characterize cellular convection and cause the formation of cellular clouds; and storm cells formed by updraft and/or downdraft loops within a thunderstorm.
(2. In weather radar, a local maximum in radar reflectivity that undergoes a life cycle of growth and decay, and which often displays an identifiable structure in radar returns. Cells in ordinary convective thunderstorms typically last 20 to 30 minutes, but may form longer-lasting multicell storms or supercells.
climate
The statistics of weather in a given region over long periods of time, measured by assessing long-term patterns of variation in temperature, atmospheric pressure, humidity, wind, precipitation, and other meteorological variables. The climate of a particular location is generated by the interactions of the atmosphere, hydrosphere, cryosphere, lithosphere, and biosphere and strongly influenced by latitude, altitude, and local topography. Climates are often classified according to the averages or typical ranges of different variables, most commonly temperature and precipitation.
cloudburst
A colloquial term used to describe an excessive precipitation event, characterized by brief, sudden, exceptionally heavy rain and/or hail falling from a cloud, typically as part of a thunderstorm associated with violent upward and downward convective currents, often leading to flash flooding.
col
The point of intersection of a trough and a ridge in the pressure pattern of a weather map. It generally takes the shape of a saddle in which the air pressure is slightly higher than that within the low-pressure regions but still lower than that within the anticyclonic zones.
cold front
A type of front located at the leading edge of a cooler air mass as it replaces a warmer air mass. Cold fronts lie within a sharp surface trough of low pressure and the temperature difference between the air masses they separate can exceed 30 °C (86 °F). When enough moisture or instability is present, lines of rain or thunderstorms may accompany the boundary as it moves. In surface weather analysis, cold fronts are symbolized by a blue line with triangles pointing in the direction of travel.
cold wave
A period of weather characterized by excessively low temperatures, which may or may not also be accompanied by changes in humidity. Very cold weather is often only referred to as a cold wave if the temperature, or the rate at which the temperature decreases within a given time period, is abnormal relative to the typical climate for a given location during a given season.
Conduction
Heat transfer through direct contact, not usually significant in meteorological processes except near the surface.
Convection
The vertical movement of heat and moisture in the atmosphere, often producing cumulus clouds and thunderstorms.
CAPE (convective available potential energy)
A measure of the maximum kinetic energy per unit mass that a rising air parcel could hypothetically acquire by remaining warmer and less dense than the surrounding air; more specifically, the integrated amount of work that the upward buoyancy force would perform on a given mass of air if it rose vertically through the entire atmosphere, typically expressed in Joules per kilogram (J/kg). CAPE exists so long as a given air parcel can ascend and still remain warmer than the surrounding air. This is possible if the parcel is moist, because water vapor releases heat as it condenses, which can slow the parcel’s rate of cooling and thus keep it warmer than surrounding air up to some definite height. The repeated ascent of relatively warm and moist air can stimulate the formation of cumulus or cumulonimbus clouds and drive the development of thunderstorms. CAPE is thus commonly interpreted as the capacity of the atmosphere to support the vertical movement of air (i.e. atmospheric convection), as an indicator of convective instability, or as a rough measure of the likelihood or potential intensity of storms. Values of CAPE in environments conducive to severe thunderstorms are commonly in the thousands of Joules per kilogram.
convective instability
The inability of an air mass to resist vertical motion. In a stable atmosphere vertical movement of air is generally difficult, whereas in an unstable atmosphere vertical disturbances can be quite exaggerated, resulting in turbulent airflow and convective activity that may lead to extensive vertical clouds, storms, and severe weather.
CINH
CINH (Convective Inhibition) is the amount of energy needed to stop a parcel of air from rising into the atmosphere, acting as a cap that prevents or delays thunderstorms
convergence
A pattern of fluid flow that brings about a net inflow of fluid elements into a region, in either the atmosphere or the ocean, accompanied by compensating vertical motion. When convergence occurs in the lower atmosphere, generally below about 550 hectopascals (0.54 atm), the compensatory air motion is upward, with inflow gradually changing to outflow at higher altitudes; when it occurs in the upper atmosphere, the air motion is downward, with divergence near the surface.
crosswind
Any wind that moves in a direction that is perpendicular to the direction of travel of a reference object, such as an airplane.
Coriolis force and effect
The Coriolis force is an apparent, or fictitious, force that causes moving objects to curve or deflect because they are on a rotating surface like the Earth. It is not a physical push or pull. Instead, it happens because the ground beneath a moving object (like wind or water) rotates at different speeds depending on the latitude. The Coriolis force on Earth reaches its maximum at the North and South Poles and is zero at the equator. Coriolis Effect is the change in speed across different latitudes causes moving objects like wind and ocean currents to curve rather than travel in a straight line.
cyclone
Any large-scale air mass characterized by inward spiralling winds which circulate around a strong center of low atmospheric pressure. Cyclones can form over land or water, can vary in size from mesocyclones such as tornadoes to synoptic-scale phenomena such as tropical cyclones and polar vortices, and may transition between tropical, subtropical, and extratropical phases. Due to Coriolis Effect, as the air moves toward the center, the rotation of the Earth deflects the path of the wind. This deflection causes a counter-clockwise spin in the Northern Hemisphere and a clockwise spin in the Southern Hemisphere.
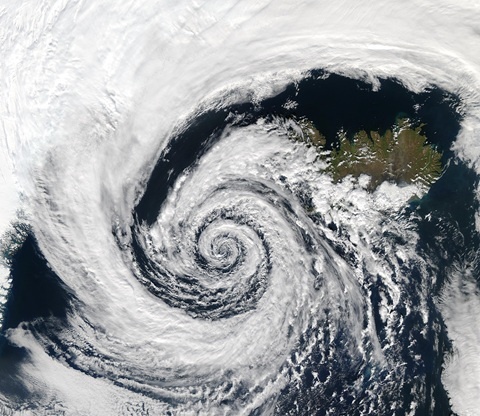
Figure above shows very large air masses (and the clouds within them) spiral counterclockwise around a strong center of low atmospheric pressure in this extratropical cyclone over Iceland.
deepening
A decrease in the central and surrounding sea-level pressure within the circulation of a pressure system (usually a low-pressure system) over a short period of time, with the result that mass is exported from the total air column overlying the system faster than it is supplied. Deepening of a low is commonly accompanied by the intensification of its cyclonic circulation and hence its winds, and the term is frequently used to imply cyclogenesis.
depression
Any area of low atmospheric pressure at a given level in the atmosphere; i.e. a “low” or trough. The term is used especially frequently to refer to an early stage in the development of a tropical cyclone during which the disturbance is only weakly developed or poorly organized
diabatic process
Any thermodynamic process in which the temperature of an air parcel changes as a result of the transfer of energy (e.g. heat) between the parcel and its surroundings, as opposed to an adiabatic process, in which the temperature changes without any such exchange. Example of Diabatic Process: The sun warms the Earth’s surface, which then heats the air layer directly above it via conduction and radiation.
direct circulation
A closed, vertically distributed thermal circulation in the atmosphere, in which warm, lighter air rises and cold, denser air sinks (or, equivalently, a system in which the rising motion occurs at a higher potential temperature than the sinking motion). Such a cell converts heat energy to potential energy and then to kinetic energy.
discontinuity
A horizontal zone across which temperature, humidity, wind speed, or any other meteorological variable changes abruptly, such as a front.
downburst
A surface-level wind system that emanates from an elevated point source and blows radially in all directions upon making contact with the ground. Downbursts are created when rain-cooled air descends rapidly, and can produce very strong damaging winds. They are often confused with tornadoes, although a tornado causes air to move inward and upward whereas a downburst directs it downward and outward. Microbursts, macrobursts, and heat bursts are all types of downburst.
Doppler Radar
A radar system that detects the motion of precipitation particles and wind by measuring the frequency shift (Doppler effect).
Earth’s rotation
Earth’s rotation is the spinning of our planet around its own imaginary center line. This turning motion goes from west to east, takes about 24 hours for one full spin, and creates the cycle of day and night. The rotation is Counterclockwise (or to the east) when looking down from the North Pole. It makes the sun look like it rises in the east and sets in the west. It helps shape global winds and ocean movement through the turning effect (Coriolis effect).
Earth’s tilt
The Earth’s axis is tilted at an angle of approximately 23.5 degrees relative to its orbital plane around the Sun. This stable inclination is the primary reason our planet experiences changing seasons, as different hemispheres receive varying amounts of direct sunlight throughout the year. Tilt creates distinct seasonal temperature contrasts, varying daylight lengths, and stable climate zones necessary for diverse life. When the North Pole tilts toward the Sun, it’s summer in the Northern Hemisphere.
echo
On a radar display, the appearance of the radio signal that is scattered or reflected back from a target. The distinct characteristics of a radar echo can be used to identify the distance and velocity of the target with respect to the signal source as well as the target’s size, shape, and composition.
El Niño
The warm phase of the El Niño–Southern Oscillation (ENSO), associated with the annual development of a band of warm ocean water in the eastern equatorial Pacific, which brings low pressure and heavy rainfall to the coasts of Central and South America. The El Niño phase of the cycle may last between two and seven years, with local weather patterns recurring every year. The cool phase of the ENSO is called La Niña.
El Niño–Southern Oscillation (ENSO)
An irregular long-term periodic variation in winds and sea surface temperatures over the tropical eastern Pacific Ocean which affects the climate of most of the world but especially the tropics and subtropics in a cycle lasting years or decades. The phenomenon, a consequence of the Walker circulation, is marked by two phases: a warming phase, El Niño, during which sea temperatures are above average over a large part of the eastern Pacific Ocean, driving high pressure and dry weather in Asia and low pressure and heavy precipitation in the Americas; and a cooling phase, La Niña, during which sea temperatures are below average in the eastern Pacific and the reverse weather pattern occurs. Each phase can last for several years, with local seasonal weather patterns recurring predictably, though there are also long intervals of “neutral” or average conditions when neither El Niño nor La Niña is active.
emagram
One of four thermodynamic diagrams used to display temperature lapse rate and moisture content profiles in the atmosphere. Emagrams have axes of temperature (T) and pressure (p). Temperature and dew point data from radiosondes are plotted on these diagrams to allow calculations of convective stability or convective available potential energy.
ensemble forecasting
A weather forecasting technique in which a numerical weather model generates a set of multiple (often several dozen) forecasts, each based on a slightly different set of initial atmospheric conditions, intended to provide an indication of the range of possible future states of the atmosphere. If the forecasts are consistent, they are usually considered reliable; if they diverge, meteorologists may feel less confident in making specific predictions for the forecast area.
extratropical cyclone
Any synoptic-scale cyclonic circulation that occurs outside of the tropics, i.e. in the middle or high latitudes, circulating around a central low-pressure area in the same manner as a tropical cyclone but developed and sustained by different mechanisms. Extratropical cyclones and anticyclones drive much of the weather in the Earth’s temperate and subpolar zones and may produce a wide variety of conditions, ranging from cloudiness and mild showers to severe thunderstorms, hail, tornadoes, and blizzards. Unlike tropical cyclones, they generally result from the interaction of two air masses with different properties, producing rapid changes in temperature and dew point along an extensive front at the boundary between the air masses, which wraps around the center of the cyclone.
extreme weather
Any weather that is unexpected, unusual, unpredictable, record-breaking, unseasonal, or especially severe (i.e. weather at the extremes of an historical distribution).
eye
A typically circular region at the center of a strong tropical cyclone that is the location of the storm’s lowest barometric pressure. The eye is usually characterized by light winds, clear skies, and mostly calm weather, in stark contrast to the severe weather that occurs in the surrounding eyewall and the rest of the storm.
firestorm
A very large wildfire or other conflagration which because of its intensity is able to create and sustain its own storm-force winds. Firestorms develop when a convective updraft of hot air rising from the burning area draws in strong wind gusts from all directions, which supply the fire with additional oxygen and thereby induce further combustion. They are often associated with flammagenitus clouds and fire whirls.
flash flood
A flood caused by heavy or excessive rainfall in a short period of time, generally less than 6 hours. Flash floods are usually characterized by raging torrents after heavy rains that rip through river beds, urban streets, or mountain canyons sweeping everything before them. They can occur within minutes or a few hours of excessive rainfall. They can also occur even if no rain has fallen, for instance after a levee or dam has failed, or after a sudden release of water by a debris or ice jam.
flood
An overflow of water which submerges land that is usually dry. Flooding may occur when water bodies such as rivers, lakes, or oceans escape their boundaries by overtopping or puncturing levees, or it may occur when precipitation accumulates on saturated ground more rapidly than it can either infiltrate or run off.
front
A boundary separating two masses of air of different density and usually also of different temperature and humidity. Weather fronts are the principal cause of meteorological phenomena outside the tropics, often bringing with them clouds, precipitation, and changes in wind speed and direction as they move. Types of fronts include cold fronts, warm fronts, and occluded fronts.
forecast verification
comparison of predicted weather to observed weather conditions to assess forecasting accuracy and reliability
geopotential height
Geopotential height is the vertical distance above sea level adjusted for the variations in Earth’s gravity with latitude and altitude. In meteorology, it measures the gravitational potential energy of a unit mass at a given level, approximating the actual geometric height of a constant pressure surface in the atmosphere. In meteorology and atmospheric science, geopotential height is often used in place of ordinary altitude when calculating the primitive equations in numerical weather prediction and when creating atmospheric models.
geostrophic wind
The theoretical wind that would result from an exact balance between the Coriolis force and the pressure gradient force (known as geostrophic balance). The true wind almost always differs from the geostrophic wind due to the influence of other forces such as friction from the ground.
Global Climate Model (GCM)
A numerical model that simulates Earth’s climate system over long periods. Used in climate research and IPCC assessments.
Global Forecast System (GFS)
A U.S. weather prediction model run by the National Weather Service that provides global forecasts up to 16 days in advance.
heat index (HI)
A meteorological index that posits the apparent temperature perceived by the average human being who is exposed to a given combination of air temperature and relative humidity in a shaded area. For example, when the air temperature is 32 °C (90 °F) with 70% relative humidity, the heat index is 41 °C (106 °F).
heat wave
A period of weather characterized by excessively high temperatures, which may or may not be accompanied by high humidity or by drought. Very hot weather is often only referred to as a heat wave if the temperature is abnormal relative to the typical climate for a given location during a given season.
hook echo
A characteristic spiral or hook-shaped radar echo associated with some (though not all) tornadoes, usually protruding from the larger echo returned by a multicell or supercell thunderstorm and signifying intense mesocyclonic rotation. Hook echoes are produced by a conspicuous contrast between backscattering from heavy precipitation as it is drawn into a strongly circulating stream of air and the relative lack of scattering in an adjacent circulation of precipitation-free air. These echoes may only last a few minutes, and though they are not infallible indicators of tornadogenesis, they do reveal extreme turbulence.
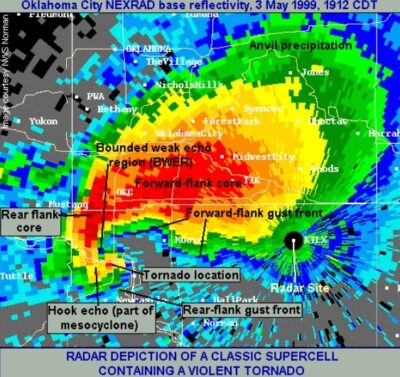
Figure above shows distinctive hook echo, indicating the presence of a tornado, plus many other features common in supercell thunderstorms are visible in this radar signature.
humidity
A measure of the amount of water vapor present in a parcel of air. By quantifying the saturation of the air with moisture, humidity indicates the likelihood of precipitation, dew, or fog occurring. The amount of water vapor needed to achieve full saturation increases as the air temperature increases. Three primary forms of humidity are widely employed in meteorology: absolute, relative, and specific. Absolute Humidity is the total mass of water vapor in a given volume of air, typically expressed in grams per cubic meter (g/m³). Unlike relative humidity, it does not depend on temperature.
hurricane
The local name for a tropical cyclone that occurs in the Atlantic Ocean or northeastern Pacific Ocean and achieves one-minute maximum sustained winds exceeding 74 mph (119 km/h; 64 kn).
hygrometer
A scientific instrument used to measure humidity.
inflow
The influx of heat and moisture into a storm system from the surrounding environment. The inflow of parcels of warm, moist air drives and sustains most types of storms, including thunderstorms and tropical cyclones.
Isallobar
A line on a weather map connecting points of equal pressure change over time.
Isentropic Surface
A surface of constant potential temperature used in dynamic meteorology to analyze atmospheric motion.
Isobar
A line on a weather map connecting points of equal atmospheric pressure. Closer isobars indicate stronger winds.
Isodrosotherm
A line connecting points of equal dew point temperature on a weather map.
Isoheight
A line of constant geopotential height on an upper-air chart.
Isohyet
A line connecting points of equal precipitation on a map.
Isoneph
A line on a weather map connecting areas of equal cloud cover.
Isotherm
A line on a map connecting points of equal temperature.
Isotropic
Having uniform properties in all directions. In meteorology, often used to describe turbulence or radiation fields.
katabatic wind
A local wind that carries cold, high-density air from a higher elevation downslope under the force of gravity as a result of the radiative cooling of the upland ground surface at night, usually at speeds on the order of 10 kn (19 km/h) or less but occasionally at much higher speeds.
landfall
The movement of a storm or other weather phenomenon over land after being over water.
lapse rate
The rate at which an atmospheric variable, most commonly temperature or pressure, decreases with increasing altitude.
latent heat
The amount of heat absorbed or released per unit mass during a change of phase of a substance at constant temperature and pressure. In meteorology, the term usually refers to the amount absorbed or released in the various transformations between the three physical states of water: ice, liquid water, and water vapor. For instance, the latent heat of vaporization requires about 2.4 million Joules per kilogram at 0 °C.
Lidar
A surveying method that measures the distance to a target by illuminating the target with pulsed laser light and measuring the reflected pulses with a sensor; differences in laser return times and wavelengths can then be used to create digital three-dimensional representations of the target. The name is now used as an acronym of light detection and ranging.
macroburst
A strong downburst that affects a path longer than 4 kilometres (2.5 mi) and persists for up to 30 minutes, with surface winds reaching as high as 210 kilometres per hour (130 mph).
Monsoon
A seasonal reversal of wind accompanied by a dramatic shift in precipitation patterns. Most notably occurs in South and Southeast Asia
meteorology
A branch of the atmospheric sciences which seeks to understand and explain observable weather events, with a major focus on weather prediction. Meteorology uses variables familiar in chemistry and physics to describe and quantify meteorological phenomena, including temperature, pressure, water vapor, mass flow, and how these properties interact and change over time.
Monte Carlo
Monte Carlo analysis is a mathematical and statistical technique that predicts the possible outcomes of a complex event or system by running repeated random simulations. Instead of guessing a single fixed number for an uncertain future, a Monte Carlo simulation plugs in many random values for unknown variables over and over again—sometimes thousands or millions of times—to build a spectrum of likely results. It is named after the famous casino city in Monaco because it relies on the same logic of chance and random sampling seen in games of gambling.
Nowcasting
a weather forecast made and disseminated within an hour or less for a specific area for an approaching weather system
occluded front
A type of front formed during the process of cyclogenesis when a cold front overtakes a warm front. Occluded fronts usually form around mature low-pressure areas when a warm air mass is physically separated (or “occluded”) from the cyclonic center at the Earth’s surface by the intervention of a cooler air mass; the warmer air is lifted into a trough of warm air aloft. In surface weather analysis, occluded fronts are symbolized by various combinations of the symbols for cold and warm fronts.
overcast
The condition of cloud clover wherein clouds obscure at least 95% of the sky. The type of cloud cover that qualifies as overcast is distinguished from obscuring surface-level phenomena such as fog.
pascal (Pa)
The SI derived unit of pressure, defined as one newton per square metre. In meteorology, measurements of atmospheric pressure are often given in hectopascals (hPa) or kilopascals (kPa).
pentad
A period of five consecutive days sometimes used in preference to the seven-day week in the analysis of meteorological data because it divides conveniently into the number of days (365) in a standard year.
period of record
The length of time during which a specific meteorological element (e.g. temperature, humidity, precipitation, etc.) has been officially observed and recorded at a particular place.
precipitation
Any product of the condensation of atmospheric water vapor that falls by gravity, the main forms of which include rain, sleet, snow, hail, and graupel. Precipitation occurs when a portion of the atmosphere becomes locally saturated with water vapor such that the water condenses into liquid or solid droplets and thus “precipitates” out of the atmosphere.
pressure gradient
The horizontal or vertical rate of change of barometric pressure in the atmosphere, usually expressed in hectopascals (hPa) per metre; the term is also sometimes used more loosely to denote simply the magnitude of the gradient within a pressure field. The three-dimensional pressure gradient vector is usually resolved into its vertical and horizontal components.
pressure gradient force (PGF)
The force experienced by a unit mass of air in response to differences in atmospheric pressure in either the horizontal or vertical plane, i.e. a pressure gradient, such that air parcels are accelerated away from regions of high pressure and toward regions of low pressure. A strong pressure gradient force leads to intense atmospheric flows and strong winds.
pressure system
A relative peak or lull in the spatial distribution of sea-level atmospheric pressure. High- and low-pressure systems evolve by the interactions of temperature, moisture, and solar radiation in the atmosphere, and are directly responsible for most local weather phenomena.
radar echo
The portion of the pulsed beam of microwave energy emitted by a radar transmitter that is reflected back to the receiver after the signal encounters a specific target or obstruction in the atmosphere, such as individual particles of precipitation. The term may also refer to the backscatter produced by these objects.
radar imaging
Any method that uses radar technology to map the location and characteristics of selected environmental phenomena by emitting a pulse of microwave radiation at a target and analyzing the portion that is partially returned by backscattering. Radar imaging is widely used in the atmospheric sciences to create images indicating large-scale spatial patterns of meteorological data, e.g. the intensity and distribution of precipitation, or the height and orientation of wind-driven ocean waves.
radar meteorology
A branch of meteorology concerned with the use of primarily ground-based radar technologies for the analysis and prediction of atmospheric phenomena across a wide variety of spatial scales.
radiosonde
A battery-powered scientific instrument released into the atmosphere, usually by a weather balloon, which measures various atmospheric variables and transmits them by radio telemetry to a ground receiver. Radiosondes are essential sources of meteorological data.
regional forecast
A weather forecast for a specified geographic region, usually a wider area than that covered by a local forecast.
rocketsonde
A type of radiosonde that is transported into the upper atmosphere, e.g. the thermosphere, by rocket propulsion before being ejected and descending to the Earth’s surface by parachute. Rocketsondes are used to make soundings at altitudes much higher than can usually be obtained by balloon or aircraft. They can provide instantaneous vertical profiles for a number of meteorological variables (temperature, pressure, ozone concentration, wind speed and direction, etc.) as they descend through the layers of the atmosphere.
Saffir–Simpson hurricane wind scale (SSHWS)
A rating system used to classify hurricanes (tropical cyclones in the Western Hemisphere) into one of five categories according to the intensity of their sustained winds, measured as the maximum sustained wind speed averaged over a one-minute interval at an altitude of 10 meters above the surface. Category 1, the lowest rating on the scale, indicates average sustained wind speeds of 33–42 metres per second (64–82 kn; 74–94 mph), where the lower limit is also used to define the distinction between a tropical storm and a hurricane; Category 5, the highest rating, indicates wind speeds of 70 metres per second (136 kn; 157 mph) or more.
satellite sounding
An atmospheric sounding obtained from instruments on a meteorological satellite in orbit around the Earth.
sea breeze
An onshore local wind that blows from sea to land, a result of the more rapid warming of the land surface relative to the sea during the day. It blows in the opposite direction of a land breeze, its nighttime counterpart in a diurnal cycle of coastal winds caused by lateral differences in surface temperature between land and sea.
season
Any division of the year marked by changes in weather, ecology, and the duration of daylight. Seasons result from the Earth’s orbit around the Sun and its axial tilt relative to the ecliptic plane. In temperate and polar regions, four calendar-based seasons – spring, summer, autumn, and winter – are generally marked by significant changes in the intensity of sunlight that reaches the Earth’s surface; these changes become less dramatic as one approach the Equator, and so many tropical regions have only two or three seasons, such as a wet season and a dry season. In certain parts of the world, the term is also used to describe the timing of important ecological events, such as hurricane seasons, flood seasons, and wildfire seasons.
severe thunderstorm
A type of severe weather consisting of an especially strong or intense thunderstorm accompanied by locally damaging downdraft winds exceeding 50 knots (58 mph), heavy rain, frequent lightning, and/or large hailstones with a diameter of at least 20 millimetres (0.79 in). Severe thunderstorms are often capable of producing tornadoes as well.
severe weather
Any dangerous meteorological phenomena with the potential to cause damage on the ground surface, serious social disruption, or loss of human life. There are many types of severe weather, including strong winds, excessive precipitation, thunderstorms, tornadoes, tropical cyclones, blizzards, and wildfires. Some severe weather may be more or less typical of a given region during a given season; other phenomena may be atypical or unpredictable.
shower
A brief downpour of precipitation (especially rain, but also snow or hail) that starts and ends abruptly and typically lasts less than 10 minutes. Showers are characterized by rapid changes in intensity and are usually associated with convective clouds (e.g. cumulonimbus) which do not completely cover the sky, such that brightness is frequently evident during showers.
standard atmosphere
A unit of pressure defined as exactly 101,325 pascals (760 torrs; 29.9 inches of mercury; 14.7 pounds per square inch), which is approximately equal to Earth’s average atmospheric pressure at sea level. It is used in meteorology and many other scientific contexts as a standardized or reference pressure.
storm
Any disturbed state of atmosphere especially affecting the ground surface and strongly implying severe weather. Storms are characterized by significant disruptions to normal atmospheric conditions, which can result in strong wind, heavy precipitation, and/or thunder and lightning (as with a thunderstorm), among other phenomena. They are created when a center of low pressure develops within a system of high pressure surrounding it.
storm cell
An air mass which contains up and down drafts in convective loops and which moves and reacts as a single entity. It functions as the smallest unit of a storm-producing weather system.
Synoptic Scale
The large-scale features of the atmosphere, such as fronts, troughs, and high/low pressure systems, typically hundreds to thousands of kilometers in size.
temperature
A physical quantity expressing the thermal motion of a substance, such as a mass of air in the atmosphere, and proportional to the average kinetic energy of the random microscopic motions of the substance’s constituent particles. Temperature is measured with a thermometer calibrated in one or more temperature scales: the Kelvin scale is the standard used in scientific contexts, but the Celsius and Fahrenheit scales are more commonly used in everyday contexts and for weather forecasting.
temperature gradient
A physical quantity that describes in which direction and at what rate the temperature changes within or across a particular system or location. It is typically expressed in units of degrees (on a particular temperature scale) per unit length; the SI unit is kelvin per meter (K/m).
thermometer
An instrument used to measure temperature or a temperature gradient.
thunderstorm
A storm characterized by the presence of lightning and its acoustic effect on the Earth’s atmosphere, known as thunder. Thunderstorms result from the rapid upward movement of warm, moist air, often along a front. They can develop in any geographic location but are most common in the mid-latitudes. They are usually accompanied by strong winds and heavy rain; especially strong or severe thunderstorms can produce some of the most dangerous weather phenomena, including large hail, downbursts, and tornadoes.
tropical cyclone
A very large, rapidly rotating storm system characterized by a low-pressure center surrounded by a closed low-level atmospheric circulation, strong winds, and continuous spiral bands of thunderstorms that produce heavy rain. Tropical cyclones develop almost exclusively over and derive their strength from warm tropical seas. The strongest systems can last for more than a week, span more than 1,600 km (1,000 mi) in diameter, and cause significant damage to coastal regions with powerful winds, storm surges, and concentrated precipitation that leads to flooding. Depending on its location and strength, a tropical cyclone may be referred to by different names and categorized within a variety of classes.
tropics
The region of the Earth surrounding the Equator, generally delimited in latitude between the Tropic of Cancer (23°26′ N) in the Northern Hemisphere and the Tropic of Capricorn (23°26′ S) in the Southern Hemisphere.
Temperate
Temperate regions are Earth’s middle latitudes characterized by moderate climates, four distinct seasons (spring, summer, autumn, winter), and temperatures that are neither extremely hot nor freezing cold. They lie between the tropical regions and the polar circles in both hemispheres
unstable air mass
Any air mass with high convective instability, characterized by dramatic vertical air currents.
updraft
Any vertical current of rising air in the atmosphere, often within a cloud, especially one originating from the tendency of warm air to ascend in altitude. Updrafts commonly develop when multiple smaller, more general ascending currents called thermals become concentrated and organized into a single flow, often as compensation for the development of a strong current of cold air moving in the opposite direction, known as a downdraft. Updrafts and downdrafts together are associated with the strong atmospheric convective forces that characterize multicell and supercell storm systems, and play important roles in the formation of tropical cyclones and tornadoes.
urban heat island (UHI)
An urban or metropolitan area within which air temperatures are significantly warmer than in surrounding rural or uninhabited areas as a result of human activities, especially the artificial modification of land surfaces and the generation of waste heat by energy usage. Urban heat islands can greatly influence precipitation, air quality, and the likelihood of certain weather phenomena in the vicinity of large cities, though not all cities have a distinct urban heat island.
visual flight rules (VFR)
A set of regulations under which a pilot operates an aircraft in weather conditions generally clear enough to allow the pilot to see where the aircraft is going, as opposed to instrument flight rules, under which operation of the aircraft primarily occurs through referencing the onboard instruments rather than through visual reference to the ground and environs.
watch
A class of weather advisory issued by a meteorological agency or weather forecasting service to notify the public that conditions in the coverage area are favorable for the development of a particular form of hazardous or severe weather, though the hazardous weather itself is not currently present, e.g. a tornado watch or hazardous seas watch. Watches are usually issued for a large geographic area, often for one or more administrative jurisdictions (e.g. counties in the United States). A watch is the first stage of a weather alert, indicating the need for precautionary planning, preparedness, and taking steps to ensure that any further information communicated by the issuing service will be received. It is distinct from and often precedes a warning, which indicates the imminent approach of hazardous weather.
weather
The state of the atmosphere at a given time and location. Weather is driven by a diverse set of naturally occurring phenomena, especially air pressure, temperature, and moisture differences between one place and another, most of which occur in the troposphere.
weather balloon
A high-altitude balloon used to carry scientific instruments into the atmosphere, which then measure, record, and transmit information about meteorological variables such as atmospheric pressure, temperature, humidity, and wind speed by means of a radiosonde or other measurement device, often one which is expendable. Weather balloons are only feasible in the lower atmosphere and typically do not exceed 40 kilometres (25 mi) in altitude; higher parts of the atmosphere are generally studied with sounding rockets or satellites.
weather forecasting
The application of science and technology to predict the conditions of the atmosphere at a given time and location. Weather forecasts are made by collecting quantitative data about the current state of the atmosphere at a given place and then using meteorology to project how the atmosphere will change. Forecast Model is a computer simulation of the atmosphere using mathematical equations and initial data. Examples include the GFS, ECMWF, NAM, and HRRR. Forecasting is important to a wide variety of human activities, including business, agriculture, transportation, recreation and general health and safety, because it can be used to protect life and property.
weather map
A map which displays various meteorological features across a particular area for a particular point or range of time. Weather maps often use symbols such as station models to conveniently present complicated meteorological data. They are used for both research and weather forecasting purposes.
weather station
Any facility, either on land or at sea, with instruments and equipment for measuring atmospheric conditions in order to provide information for weather forecasts and to study the weather and/or climate.
Wind
The horizontal movement of air caused by differences in pressure, affected by Earth’s rotation and friction. Wind occurs on a wide range of scales, from very strong thunderstorm flows lasting tens of minutes to milder local breezes lasting a few hours to global atmospheric circulations caused by the differential heating of the Equator and the poles and the Earth’s rotation. Winds are often referred to by their strength and direction; the many types of wind are classified according to their spatial scale, their speed, the types of forces that cause them, the regions in which they occur, and their effects.
wind direction
The direction from which a wind originates; e.g. a northerly wind blows from the north to the south. Wind direction is usually reported using cardinal directions or in azimuth degrees measured clockwise from due north. Instruments such as windsocks, weather vanes, and anemometers are commonly used to indicate wind direction.
wind speed
The measured speed of the air comprising a wind. Changes in wind speed are often caused by air parcels being exposed to pressure and temperature gradients in the atmosphere. Wind speed is measured with an anemometer, but may also be less precisely classified using the Beaufort scale.
_______
_______
Weather forecasting: units, equations and errors:
_
hPa:
hPa stands for hectopascal, which is the standard international unit for measuring atmospheric or barometric pressure. In weather forecasts, it indicates the weight of the air pressing down on the Earth’s surface and is numerically identical to a millibar (1 hPa = 1 mb).
The standard atmospheric pressure at sea level is 1013.2 hPa. Tracking these numbers helps you anticipate the following daily weather changes:
- High Pressure (Above 1015 hPa): Associated with clear skies, calm winds, and fair, stable weather. Stronger winter highs can exceed 1030 hPa and sometimes bring stagnant air or fog.
- Low Pressure (Below 1010 hPa): Associated with rising air, which cools and forms clouds, bringing precipitation, unsettled conditions, and stronger winds.
- Rapidly Falling Pressure: Indicates that an unsettled low-pressure system or front is moving in, signaling a likely shift to rain and wind.
Understanding these numbers provides deeper context beyond basic rain or shine. There are two main types: high-pressure systems, characterized by descending air and fair weather, and low-pressure systems, with rising air and often associated with storms. The interaction of these systems drives much of Earth’s weather patterns.
___
Differential equation:
A differential equation is a math sentence that connects an unknown function to its own derivatives, which are rates of change. While regular algebra equations ask you to find a missing number, a differential equation asks you to find a missing function. Differential equations are mathematical equations that describe how things change over time, space, or other variables. They act as the underlying code of reality, allowing scientists, engineers, and analysts to predict complex behaviors and model dynamic system.
For example: y + dy/dx = 5x
The use and solution of differential equations is an important field of mathematics, because differential equations help us to predict future behaviour based on how current values are related and how they change with respect to each other (perhaps over time).
Numerical weather prediction is the science of forecasting weather using computer simulations built from mathematical models. In this process, the atmosphere is divided into a three-dimensional lattice of grid points, and at each point the various atmospheric variables of interest are represented. Differential equations form the mathematical core of numerical weather prediction, translating physical laws of conservation of mass, momentum, and energy into dynamic models that predict future states of the atmosphere.
______
MSE:
Mean squared error (MSE) measures the average squared difference between a model’s predicted values and the actual observed values. It is widely used in statistics and machine learning to check model accuracy. Lower values mean better accuracy, and zero means a perfect fit.
Mean squared error (MSE) in weather forecasting is the average of the squared differences between predicted weather values (like temperature or rainfall) and the actual recorded observations. It penalizes large errors heavily, making it a key metric for meteorologists to evaluate model accuracy.
How MSE works in Weather Models:
- Squaring errors: The difference between each forecast and real value is squared so positive and negative misses do not cancel out.
- Heavy penalty: A larger mistake (such as missing a severe storm temperature by 10 degrees) becomes exponentially larger when squared, forcing model developers to fix major flaws.
- Model comparison: Meteorologists compare MSE across different computer models to see which forecast system tracks reality the closest.
______
______
Section-2
Atmosphere:
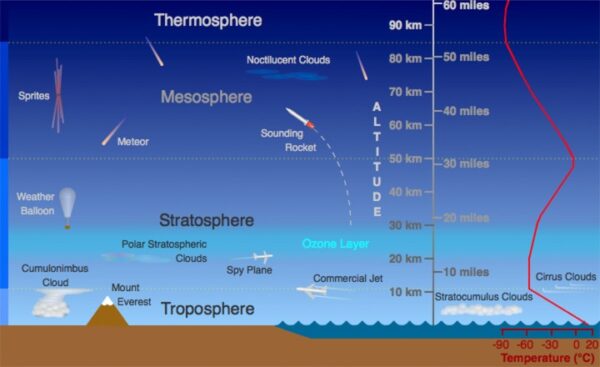
Figure above shows that the properties of Earth’s atmosphere vary by altitude across a series of distinct layers.
_
The atmosphere is the air that surrounds the surface of the Earth. It extends to about 100 kilometers/62 miles above the surface of the Earth. Most of the atmosphere is concentrated at the bottom and, in fact, 3/4 of the mass of the atmosphere is located within the lowest 11 kilometers/7 miles. Almost all weather occurs within this lowest part of the atmosphere, which is called the troposphere. The atmosphere is a fluid, just like any other gas or liquid. Currents flow through the fluid of the atmosphere, just like they would in rivers and streams. These currents in the atmosphere are what leads to common weather patterns across the globe.
Atmosphere plays a vital role in topics like protection from harmful solar radiation, regulation of temperature, and the occurrence of weather and climate. The atmosphere makes Earth suitable for life by providing oxygen and shielding us from extreme temperature variations and meteors. Atmosphere is widely used in climate studies, meteorology, aviation, astronomy, and environmental science. Concepts like the greenhouse effect and global warming, weather patterns, and satellite movement all depend on understanding the Earth’s atmosphere.
The atmosphere is made up of mostly nitrogen, oxygen, argon, carbon dioxide, water vapor, and other gases. Nitrogen is about 78% of the atmosphere, and oxygen makes up about 21%. Water vapor varies depending on whether the atmosphere is dry or moist. When it is moist, water vapor makes up about 1% of the atmosphere by volume. Dry air contains only atmospheric gases like nitrogen and oxygen, while humid air also contains water vapor. Counterintuitively, humid air is less dense and lighter than dry air at the same temperature and pressure because lighter water molecules displace heavier oxygen and nitrogen molecules. However, humid air feels heavier because it slows down sweat evaporation.
_
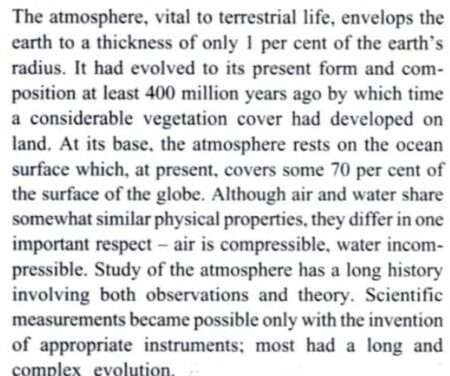
_
Most of the mass of the atmosphere is concentrated toward the surface of the Earth. The mass of the column of the atmosphere above any point is measured by atmospheric pressure. For instance, when a weather map says the pressure is 1010 millibars, that means that the weight of the column of air above that point is about 1010 millibars or 14.6 pounds per square inch. Pressure drops off rapidly with height to the point where once you reach 15 kilometers (or about 15% of the height of the atmosphere), only 10% of the pressure remains (or about 1.5 pounds per square inch).
_
The structure of the atmosphere is divided into different layers based on temperature and composition: Troposphere, Stratosphere, Mesosphere, Thermosphere, and Exosphere. Each layer has unique characteristics.
Here’s a useful table to understand Atmosphere better:
Atmosphere Table:
|
Layer |
Description |
Main function |
|
Troposphere |
Lowest layer, where weather occurs, contains most atmospheric mass |
Weather, clouds |
|
Stratosphere |
Contains ozone layer that absorbs UV radiation |
UV protection |
|
Mesosphere |
Meteors burn up, coldest layer |
Meteor protection |
|
Thermosphere |
Auroras, absorbs X-rays and UV rays |
Solar radiation absorption |
|
Exosphere |
Outermost layer, merges into space |
Transition to space |
The atmosphere is commonly split into different layers. Most of the mass and weather occurs in the lowest layer, known as the troposphere. The second lowest layer is called the stratosphere. Most planes fly somewhere in the lower stratosphere at cruising altitude. Because of the differing composition of the gases that make up the troposphere and the stratosphere, the stratosphere actually starts to warm with height. This is different from the troposphere, in which air temperature almost always cools with height. This is due to the warmth from the Earth’s surface. The line that separates the troposphere from the stratosphere is called the tropopause. The tropopause is defined by the point at which temperature stops decreasing with height and starts to increase.
__
There are in fact two very different scales in the atmosphere, the horizontal and the vertical. Horizontally, the atmosphere is much larger than we can perceive from a point on the Earth’s surface, of the order of magnitude of tens of thousands of kilometres. Vertically, by contrast, the scale of the atmosphere is much smaller (much smaller than the radius of the Earth), but it very much influences the conditions in which we live. Since much of the material of the atmosphere is squeezed into a shallow layer overlying the surface of the Earth, the distribution of e.g. temperature, humidity and other properties are strongly anisotropic, in the sense that their gross vertical and horizontal distributions are very different; for example, vertical gradients are larger.
_
The Sun has a direct and important influence on the atmosphere and is ultimately responsible for the weather. Solar energy, much of it in the form of visible sunlight, pours continuously on to the Earth, affecting both the surface and overlying air. The atmosphere is solar-powered, i.e., the Sun can be considered as the prime driver of all atmospheric activity. The diurnal variations of radiative fluxes and their variation with latitude influences, in particular, air temperature. Sunlight rays are absorbed differently by land and water surfaces (equal amounts of solar radiation heat the ground more quickly than they do water). Differential warming, in turn, causes variations in the temperature and pressure of overlying air masses. As an air mass increases its temperature, it becomes lighter and rises higher into the atmosphere. As an air mass cools, it becomes heavier and sinks. The cooling of air masses with high water vapour content can trigger precipitation. Pressure differences between masses of air generate winds, which tend to blow from high-pressure areas to areas of low pressure. Fast-moving, upper atmosphere winds known as jet streams help move weather systems around the world. Jet streams are fast-flowing, narrow bands of strong winds high in the atmosphere, mostly flowing from west to east around the globe. They form where cold polar air meets warm tropical air, guiding weather systems, storms, and airplane flights.
__
The atmosphere of Earth consists of a layer of mixed gas (commonly referred to as air) that is retained by gravity, surrounding the Earth’s surface. It contains variable quantities of suspended aerosols and particulates that create weather features such as clouds and hazes. The atmosphere serves as a protective buffer between the Earth’s surface and outer space. It shields the surface from most meteoroids and ultraviolet solar radiation, reduces diurnal temperature variation – the temperature extremes between day and night, and keeps it warm through heat retention via the greenhouse effect. The atmosphere redistributes heat and moisture among different regions via air currents, and provides the chemical and climate conditions that allow life to exist and evolve on Earth.
_
By mole fraction (i.e., by quantity of molecules), dry air contains 78.08% nitrogen, 20.95% oxygen, 0.93% argon, 0.04% carbon dioxide, and small amounts of other trace gases. Air also contains a variable amount of water vapor, on average around 1% at sea level, and 0.4% over the entire atmosphere. Earth’s primordial atmosphere consisted of gases accreted from the solar nebula, but the composition changed significantly over time, affected by many factors such as volcanism, outgassing, impact events, weathering and the evolution of life (particularly the photoautotrophs). In the present day, human activity has contributed to atmospheric changes, such as climate change (mainly through deforestation and fossil-fuel–related global warming), ozone depletion and acid deposition.
_
The atmosphere has a mass of about 5.15×10^18 kg, three quarters of which is within about 11 km (6.8 mi; 36,000 ft) of the surface. The atmosphere becomes thinner with increasing altitude, with no definite boundary between the atmosphere and outer space. The Kármán line at 100 km (62 mi) is often used as a conventional definition of the edge of space. Several layers can be distinguished in the atmosphere based on characteristics such as temperature and composition, namely the troposphere, stratosphere, mesosphere, thermosphere (formally the ionosphere), and exosphere. Air composition, temperature and atmospheric pressure vary with altitude. Air suitable for use in photosynthesis by terrestrial plants and respiration of terrestrial animals is found within the troposphere.
______
______
Vertical temperature profile of the atmosphere:
There are several ways of classifying the different layers of the atmosphere. The most common classification is based on the vertical distribution and variations of temperature in the atmosphere. In this classification, from the lowest layer to the highest layer are respectively the troposphere, the stratosphere, the mesosphere, and finally the thermosphere. The thickness and the boundary of each layer are not identical throughout the globe but vary in different time and places.
_
Figure below shows Vertical temperature profile of the atmosphere.
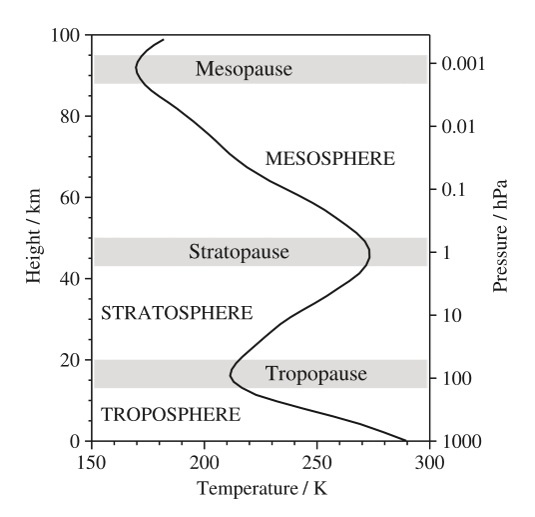
Figure above shows typical vertical structure of atmospheric temperature (K) in the lowest 100km of the atmosphere. From hydrostatic balance, the pressure at any level in the atmosphere is proportional to the mass of air above that level. From the pressure axis in figure above, it follows that approximately 90% of the atmospheric mass is in the troposphere, a little under 10% in the stratosphere and only about 0.1% in the mesosphere and above.
_
The troposphere is about 12 kilometers thick on average; it is thicker in summer than in winter. The troposphere over low latitude regions is usually thicker than over high latitude regions. The troposphere over the equator is about 18 kilometers thick, while its thickness in the regions nearest the two poles is only about eight to nine kilometers. The temperature in the troposphere usually decreases with height at the average lapse rate of 6.5 °C per kilometer. The air in the troposphere is more unstable and with strong convection. Almost all the water vapor in the atmosphere exists within this layer; therefore, common weather phenomena such as clouds, fog, rain, and snow, occur only in this layer and more often than not in its lower part.
_
The stratosphere extends from 10 kilometers to 50 – 55 kilometers above ground. Within the lower part which extends from the top of the troposphere to about 30-35 kilometers the temperature is almost constant, or increases slightly with height. Above 35 kilometers the temperature actually increases with height at the average rate of 5 °C per kilometer. Since almost no dust or water vapor from the land surface will reach the stratosphere, the air flow in this layer is steady. The upper part of the stratosphere experiences an increase of temperature due to the fact that the sun’s ultraviolet radiation is absorbed by the ozone layer. The ozone layer, located in the stratosphere, plays a vital role in absorbing most of the sun’s harmful ultraviolet (UV) radiation. This protection is essential for preventing damage to living organisms and ecosystems. The atmosphere also filters out other forms of harmful solar radiation.
_
The region of the mesosphere is about 50 to 80 kilometers in altitude. The temperature in this layer usually decreases as the height increases up to the top of the mesosphere where the temperature can be as low as – 95 °C or even lower. The composition of gases in the atmosphere from the ground to the top of the mesosphere, are almost identical except for water vapor and ozone. Therefore the region below the mesosphere is also called the homosphere.
_
The thermosphere is the region above the top of mesosphere where the temperature begins to rise again. When sun activity is low, this layer can extend to 400 kilometers in altitude. During high sun activity periods the layer can reach around 500 kilometers in altitude. The air in the lower region of the thermosphere is extremely thin; therefore the particles in the air can easily be ionized, resulting in profuse free electrons in the air. Therefore this layer is also called the ionosphere; it is very effective in reflecting radio waves.
______
______
The global energy balance:
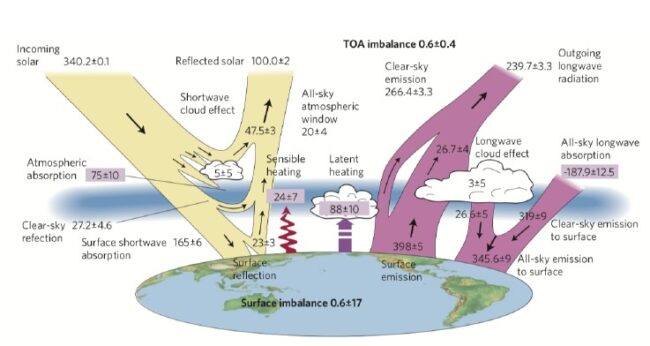
Figure above shows the global annual mean energy budget of Earth for the approximate period 2000–2010. All fluxes are in W/m2. Solar fluxes are in yellow and infrared fluxes in pink. The four flux quantities in purple-shaded boxes represent the principal components of the atmospheric energy balance.
The sun is the engine of the system. The atmosphere absorbs and reflects back to space a part of the solar radiation that is received at the top of the atmosphere (TOA). Clouds have a very strong capacity to reflect solar radiation, but also the molecules in the atmosphere cause a net backscattering of solar radiation, for example by Rayleigh scattering. In addition, gases like water vapor do also absorb solar radiation.
On annual time scales, the amount of energy that is received at the ground surface must be lost in order to achieve a mean equilibrium state. Otherwise, heat would pile up in the soil, leading to an ever increasing temperature.
_______
Atmospheric circulation:
Atmospheric circulation is the large-scale movement of air that distributes heat and moisture across the Earth, driving global climate and day-to-day weather systems. It is powered by uneven solar heating, air pressure differences, and the rotation of the Earth. Earth’s weather is a consequence of its illumination by the Sun and the laws of thermodynamics. The atmospheric circulation can be viewed as a heat engine driven by the Sun’s energy and whose energy sink, ultimately, is the blackness of space. The work produced by that engine causes the motion of the masses of air, and in that process, it redistributes the energy absorbed by Earth’s surface near the tropics to the latitudes nearer the poles, and thence to space. The large-scale atmospheric circulation “cells” shift polewards in warmer periods (for example, interglacials compared to glacials), but remain largely constant as they are, fundamentally, a property of Earth’s size, rotation rate, heating and atmospheric depth, all of which change little.
_
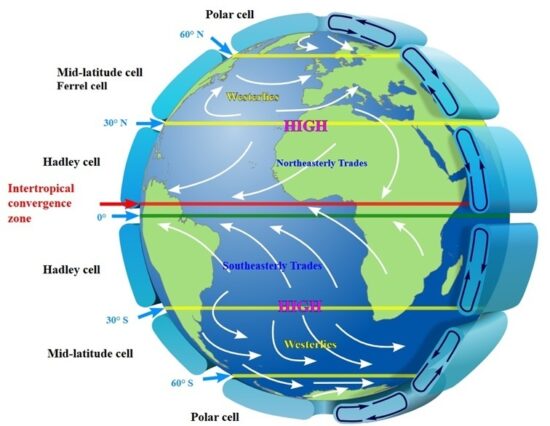
Figure above shows major circulation cells of the Earth’s atmosphere.
Earth’s atmosphere features three major circulation cells in each hemisphere (Hadley, Ferrel, and Polar) that distribute solar heat and moisture from the equator to the poles. These interacting convective loops shape global wind belts, precipitation patterns, and climate zones. The westerlies and trade winds are part of the Earth’s atmospheric circulation.
Global Atmospheric Circulation Cells:
- Hadley Cell: Warm air rises near the equator, moves toward the poles, and sinks at 30° N and S latitudes to create subtropical high-pressure belts.
- Ferrel Cell: Mid-latitude cell where surface air flows poleward as westerlies and interacts with polar air.
- Polar Cell: Cold, dense air sinks at the poles and flows toward lower latitudes as polar easterlies.
_
Land surface processes have been shown to have substantial effects on short-term weather predictions and long-term climate projections. Changes in land surface conditions influence the atmospheric circulation by modifying the surface energy balance and hydrological cycle. For example, Rowell and Blondin [1990] showed that the 5-day weather forecast for West Africa from the European Center for Medium Range Weather Forecasts (ECMWF) operational forecasting model was sensitive to the surface moisture distribution. Although land surface modeling can enhance our ability to understand land surface-atmosphere interactions, poor or inadequate representation of surface processes or land surface conditions may have a negative impact on weather prediction and climate studies.
________
Descriptions of Atmospheric Behavior:
The earth’s atmosphere is the gaseous envelope surrounding the planet. Like other planetary atmospheres, the earth’s atmosphere figures centrally in transfers of energy between the sun and the planet’s surface and from one region of the globe to another; these transfers maintain thermal equilibrium and determine the planet’s climate. However, the earth’s atmosphere is unique in that it is related closely to the oceans and to surface processes, which, together with the atmosphere, form the basis for life.
Because it is a fluid system, the atmosphere is capable of supporting a wide spectrum of motions, ranging from turbulent eddies of a few meters to circulations having dimensions of the earth itself. By rearranging air, motions influence other atmospheric components such as water vapor, ozone, and clouds, which figure importantly in radiative and chemical processes and make the atmospheric circulation an important ingredient of the global energy budget.
_
The mobility of fluid systems makes their description complex. Atmospheric motions can redistribute mass and constituents into an infinite variety of complex configurations. Like any fluid system, the atmosphere is governed by the laws of continuum mechanics. These can be derived from the laws of mechanics and thermodynamics governing a discrete fluid body by generalizing those laws to a continuum of such systems. In the atmosphere, the discrete system to which these laws apply is an infinitesimal fluid element or air parcel, defined by a fixed collection of matter.
Two frameworks are used to describe atmospheric behavior. The Eulerian description represents atmospheric behavior in terms of field properties, like the instantaneous distributions of temperature, motion, and constituents. Governed by partial differential equations, the field description of atmospheric behavior is convenient for numerical purposes. The Lagrangian description represents atmospheric behavior in terms of the properties of individual air parcels, for example, in terms of their instantaneous positions, temperatures, and constituent concentrations. Because it focuses on transformations of properties within an air parcel and on interactions between that system and its environment, the Lagrangian description offers conceptual as well as certain diagnostic advantages. In the Lagrangian framework, the system considered is an individual air parcel moving through the circulation.
_
Of the factors influencing atmospheric behavior, gravity is the single most important one. Even though it has no upper boundary, the atmosphere is contained by the gravitational field of the planet, which prevents atmospheric mass from escaping to space. Because it is such a strong body force, gravity determines many atmospheric properties. Most immediate is the geometry of the atmosphere. Atmospheric mass is concentrated in the lowest 10 km—less than 1% of the planet’s radius. Gravitational attraction has compressed the atmosphere into a shallow layer above the earth’s surface, in which mass and constituents are stratified vertically. Through stratification of mass, gravity imposes a strong kinematic constraint on atmospheric motion. Circulations with dimensions greater than a few tens of kilometers are quasi-horizontal, so vertical displacements of air are much smaller than horizontal displacements. Under these circumstances, constituents like water vapor and ozone fan out in layers or “strata.” Vertical displacements are comparable to horizontal displacements only in small-scale circulations like convective cells and fronts, which have horizontal dimensions comparable to the vertical scale of the mass distribution.
_
The compressibility of air complicates the description of atmospheric behavior because it allows the volume of a fluid element to change as it experiences changes in surrounding pressure. Therefore, concentrations of mass and constituents for an individual air parcel can change, even though the number of molecules remains fixed. The concentration of a chemical constituent can also change through internal transformations, which alter the number of a particular type of molecule. For example, condensation will decrease the abundance water vapor.
_
The most important variable constituent is water vapour. Water is the only atmospheric constituent that can change phase at the typical pressures and temperatures experienced in the Earth’s atmosphere. It can condense to form clouds and precipitate out as rain, and it can evaporate from the surface and from cloud and rain droplets. These are fast processes, so the residence time of water vapour is brief. At any given instant, water vapour can account for anything between 5% of the atmosphere (near the surface in the tropics) and almost zero (in the stratosphere). To an excellent approximation, the atmosphere can be considered as a two-component gas, made up of variable proportions of dry air and water vapour.
_
Observed vertical structure:
Vertical soundings of temperature, pressure and humidity are taken daily at a large number of meteorological stations spanning the globe. The data thus obtained are among the principal inputs to weather forecasting. Figure below shows a randomly selected sample sounding at Valentia station, south-west Ireland, at 00Z on 14 September 2005. This serves to illustrate some key general features of the atmosphere’s vertical structure.
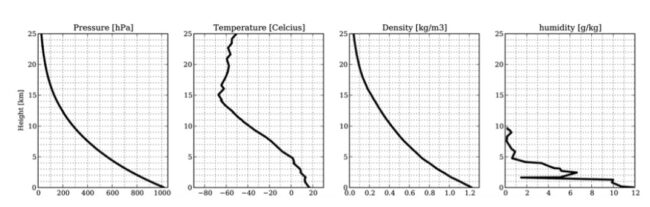
- Pressure decreases smoothly with height. Surface pressure is about 1000 hPa.
- Temperature also decreases with height, though there is much more structure (more wiggles) in the profile. The rate of decrease or lapse rate is on average 6 °C /km (though in this particular sounding is closer to 5 °C/km). Above a certain height (about 15 km) the temperature increases with height (the lapse rate is negative). The cross-over point is known as the tropopause, separating the troposphere below from the stratosphere above. Surface temperature is about 15 °C or 288 K. A useful round-number value to keep in mind as a typical surface temperature is 300 K.
- Density decreases with height, mirroring the pressure. The surface value is roughly 1 kg /m3.
- Humidity decreases sharply with height, dropping to near zero above 2–3 km
______
______
Section-3
Weather:
Weather is the state of the atmosphere at a specific time and location, determined by a combination of variables: temperature, humidity, air pressure, wind speed and direction, cloud cover, and precipitation. These variables are in constant motion and interaction, changing from minute to minute, hour to hour, and day to day. The key word is short-term. Weather is what you experience when you step outside this morning. Climate, in contrast, is the long-term average of these conditions over decades. A desert’s climate is dry and hot overall, but its weather on a given day might be cool with rain. A city’s climate may be mild, yet it can still experience heatwaves or winter storms. This distinction matters because when people complain that “forecasts are wrong” or “climate change is just weather changing,” they are often mixing up the two concepts. Weather is fickle; climate is the backdrop. Both are essential to understanding the world we live in, but they operate on different scales of time. Climate is the weather of a place averaged over a length of time. Scientists determine a region’s climate by examining its vegetation, average monthly and annual temperature, and average monthly and annual precipitation. Earth’s surface is a patchwork of climate zones. For example, in various parts of Earth, we find deserts; tropical rain forests; prairies; forests of cone-bearing trees; frozen, treeless plains; and coverings of glacial ice. Unlike changes in the weather, which can occur in minutes, climate changes generally take many years.
_
As a basic definition, weather is the state of the atmosphere. Most weather occurs in the troposphere, or the lowest layer of the atmosphere. This is the restless arena where warm and cold air masses collide, where clouds form and dissipate, where storms gather their strength. The troposphere’s depth varies. Near the equator, it can be as thick as 15 kilometers; near the poles, it’s only about 8 kilometers. Weather is made up of multiple parameters, including air temperature, atmospheric (barometric) pressure, humidity, precipitation, solar radiation and wind. Each of these factors can be measured to define typical weather patterns and to determine the quality of local atmospheric conditions.
Weather at a place is defined as the state of the atmosphere, prevailed at that place, over a short period of time. It is generally expressed as like “it’s too hot now”, “it’s very windy today”, “it’s very dry now”, “today is a rainy day” etc. In these examples, weather at a place has been expressed in terms of the state of certain atmospheric variables which are here air temperature, wind, humidity and rainfall, respectively.
_
Weather elements form a chain reaction.
For example, temperature, pressure and humidity (moisture) can interact to form clouds. These clouds, in turn, can reduce solar radiation available for plants; or they can increase precipitation, which can runoff into a body of water and, in case of intense/extreme events, perhaps lead to flooding. Similarly, lack of precipitation affects weather conditions but it also affects soil moisture and water levels, and can lead to the development of drought conditions.
High temperatures, in addition to heating the air, can also increase the heat transfer to local bodies of water and increase evaporation or have an impact on aquatic life/ecology and water pollution. High temperatures can also affect energy balances and consumption, or affect the thermal comfort in cities. Ultimately, it can affect human health or put lives at risk.
Wind speed and direction can be indicative of a front moving into the area, or it can create waves and encourage a stratified water column to mix, in a water body.
Thus, overall, the environmental conditions produced by different weather parameters have an impact on the quality of the surrounding ecosystem.
_
The atmosphere is composed primarily of nitrogen (about 78%) and oxygen (about 21%), with trace amounts of other gases like argon, carbon dioxide, and neon. Water vapor, though it makes up only a fraction of a percent, is the real wild card, capable of driving the most dramatic shifts in the sky. Without water vapor, there would be no clouds, no rain, no snow — and no weather worth speaking of. The hydrological cycle — the endless movement of water between ocean, sky, and land — is the beating heart of weather.
Every gust of wind, every drop of rain, every swirling hurricane ultimately begins with sunlight. The Sun’s energy warms the Earth unevenly — more directly at the equator, less at the poles. This uneven heating is the root cause of most atmospheric motion. Dark forests absorb heat differently than pale deserts. Oceans store heat differently than rocky mountains. These differences create areas of warmer, lighter air and cooler, denser air.
Warm air rises, creating areas of low pressure. Cool air sinks, forming high pressure. Nature abhors imbalance, so air flows from high-pressure zones toward low-pressure zones. This flow is what we feel as wind, though the rotation of the Earth — through the Coriolis effect — bends these winds into sweeping curves, shaping the jet streams and trade winds that encircle the globe.
A cloud is far more than a patch of fluff in the sky. It is the visible evidence of invisible processes — warm, moist air rising, cooling, and condensing around tiny particles like dust or sea salt. The shapes and types of clouds reveal the atmosphere’s secrets to those who can read them.
Towering cumulonimbus clouds, their tops anvil-shaped and their bases dark and roiling, signal thunderstorms and heavy rain. Thin, wispy cirrus clouds high above often herald a change in weather, such as an approaching warm front. Low, gray stratus clouds can hang like a blanket for days, bringing light rain or drizzle. Each type has its own role in the unfolding story of the day.
For centuries, farmers, sailors, and shepherds learned to “read” clouds long before meteorology became a science. Even today, a practiced observer can tell from the morning sky whether the afternoon will bring fair weather or storms.
While clouds give us something to see, the real drivers of weather are often invisible. Air pressure — the weight of the atmosphere above us — is a powerful force. The weather events happening in an area are controlled by changes in air pressure. Air pressure is caused by the weight of the huge numbers of air molecules that make up the atmosphere. Typically, when air pressure is high their skies are clear and blue. The high pressure causes air to flow down and fan out when it gets near the ground, preventing clouds from forming. When air pressure is low, air flows together and then upward where it converges, rising, cooling, and forming clouds. Remember to bring an umbrella with you on low pressure days because those clouds might cause rain or other types of precipitation.
Fronts form where two air masses meet. A cold front occurs when cold, dense air pushes under warmer air, forcing it upward. This can trigger abrupt weather changes — sudden storms, sharp temperature drops, gusty winds. A warm front, in which warm air advances over cooler air, usually brings more gradual changes: layered clouds, steady rain, and a slow rise in temperature.
These systems can be vast, stretching for hundreds or thousands of kilometers, and they migrate across continents, guided by jet streams and the rotation of the planet.
_
Weather is driven by air pressure, temperature, and moisture differences between one place and another. These differences can occur due to the Sun’s angle at any particular spot, which varies with latitude. The strong temperature contrast between polar and tropical air gives rise to the largest scale atmospheric circulations: the Hadley cell, the Ferrel cell, the polar cell, and the jet stream. Weather systems in the middle latitudes, such as extratropical cyclones, are caused by instabilities of the jet streamflow. Because Earth’s axis is tilted relative to its orbital plane (called the ecliptic), sunlight is incident at different angles at different times of the year. On Earth’s surface, temperatures usually range ±40 °C (−40 °F to 104 °F) annually. Over thousands of years, changes in Earth’s orbit can affect the amount and distribution of solar energy received by Earth, thus influencing long-term climate and global climate change.
_
Weather changes so fast:
You may wake to clear skies, only to see them darken by noon. This is the nature of a dynamic atmosphere. Air masses shift constantly, shaped by winds, mountains, and bodies of water. A valley may trap fog in the morning that burns off by midday. Coastal regions may be sunny until sea breezes bring in cooler, cloudier air from offshore. Thunderstorms can form in the heat of the afternoon and vanish by sunset. These rapid changes are especially pronounced in certain regions — for example, the American Midwest, where cold Arctic air, warm Gulf air, and dry continental air can collide dramatically, producing fast-moving fronts and severe storms.
_
The weather of any given region has a considerable impact on the water, sunlight and temperature of an ecosystem. These factors play very important roles by influencing the types of plant and animal wildlife that can survive in the area. Certain weather patterns can also cause dangerous storms and natural disasters. Hence, weather information helps farmers to plan when to sow or harvest their crops, helps pilots to know when to take off or land, helps sailors at sea to timetable their journeys, helps people to plan what dress to put on for the day (e.g., they will know whether or not to put on a sweater or a jacket and whether or not to carry an umbrella) and helps the government to prepare for disasters like floods, drought, very strong winds among others.
_
The main goal of a Meteorological office is to issue weather forecasts in different time scales to various user agencies like aviation, marine, agriculture, water management, builders, tourism industry, planners and to general public. The forecast requirement varies from detailed weather forecasts in time scales of a few hours to days and to more general indication of the broad weather pattern of succeeding months, seasons or even beyond. For example, aviation industry needs weather information in time scales of a few hours or a day whereas agriculture sector demands weather forecasts in time scales of a week. Weather forecasts of a month or a season in advance are required mostly by planners.
_
Weather categories:
The four most common types of everyday weather are sunny, cloudy, rainy, and windy. Depending on the region and season, weather is generally categorized by a combination of factors including temperature, precipitation, wind, and the amount of sunlight.
The 4 Main Types of Weather:
- Sunny: This occurs when the sun’s rays are unobstructed by clouds, resulting in bright, clear skies and typically warmer temperatures.
- Cloudy: Defined by a sky heavily covered with water vapor or ice crystals, which can obscure the sun and often lead to cooler conditions.
- Rainy: When clouds become heavy with condensed water vapor, moisture falls to the ground in the form of liquid rain.
- Windy: This describes the rapid movement of air, caused by differences in atmospheric pressure, which can be felt as anything from a light breeze to strong gusts.
Beyond the four main conditions, weather can also include freezing precipitation like snowy weather, or more extreme, hazardous conditions like stormy weather (which includes thunderstorms, tornadoes, and hurricanes).
__
What is a cold event?
Cold events are a sudden change in temperature that causes extended and extreme cold weather. These types of events often have impact travel, agriculture and emergency services. Like heatwaves, cold snaps have been shown to increase mortality rates. Scientists think there will be fewer cold temperature extremes as global average temperatures continue to rise.
What is a heatwave?
Heatwaves are a prolonged period of hot weather relative to the temperature usually experienced in an area. Heatwaves sometimes include periods of high humidity too. Heatwaves usually happen in summer when high pressure weather systems develop over a certain area. These systems are slow moving, meaning they can stay in one area for many days or weeks. Climate change is making extreme weather, such as heatwaves, more likely to occur.
What is a drought?
Droughts occur when an area experiences below average rainfall in a period of time. The lack of rain can lead to crop failures and environmental damage by reducing moisture levels in the soil, increasing the likelihood of forest fires and creating water shortages. Droughts can reduce access to clean drinking water and cause food shortages if communities are dependent on local agriculture.
______
______
Weather parameters (weather elements):
Weather refers to the atmospheric conditions at a particular location observed over a short period of time. These conditions are also called as weather parameters. There are six main components, or parts, of weather. They are temperature, atmospheric pressure, wind, humidity, precipitation, and cloudiness. Together, these components describe the weather at any given time. These changing components, along with the knowledge of atmospheric processes, help meteorologists—scientists who study weather—forecast what the weather will be in the near future. The weather, which looks like a single phenomenon, is in fact a set of different meteorological events expressed in specific values (numbers) at a particular point in space at a particular time. These conditions are called weather elements or parameters or parts.
_
A list of selected Important Weather Parameters is given in the following table.
|
S. No. |
Weather Parameter |
Definition / Role |
|
1 |
Temperature |
Measure of the thermal state of the atmosphere at a given location. |
|
2 |
Humidity |
Amount of water vapor present in the air (relative or absolute). |
|
3 |
Atmospheric Pressure |
Force exerted by the weight of the air above a surface. |
|
4 |
Dew Point |
The temperature at which air becomes saturated with water vapor and dew forms. |
|
5 |
Wind Speed |
The rate of air movement across the Earth’s surface. |
|
6 |
Wind Direction |
The direction from which the wind originates, expressed in degrees or cardinal points. |
|
7 |
Precipitation |
All forms of water, liquid or solid, that fall from clouds and reach the ground. |
|
8 |
Cloud Cover |
Fraction of the sky obscured by clouds, measured in oktas. |
|
9 |
Visibility |
The distance at which an object or light can be clearly discerned. |
|
10 |
Solar Radiation |
Total energy from the sun received per unit area. |
|
11 |
UV Index |
Index indicating the strength of ultraviolet radiation from the sun. |
_______
Instruments used to measure Weather Parameters:
|
S, No. |
Weather Parameter |
Instrument Used |
Description |
|
|
1 |
Temperature |
Thermometer |
|
Measures air temperature using mercury, alcohol, or digital sensors. |
|
2 |
Humidity |
Hygrometer |
|
Detects moisture in the air; includes dry/wet bulb and electronic sensors. |
|
3 |
Atmospheric Pressure |
Barometer |
|
Records atmospheric pressure; mercury and aneroid types are standard. |
|
4 |
Wind Speed |
Anemometer |
|
Measures wind velocity using rotating cups or ultrasonic transducers. |
|
5 |
Wind Direction |
Wind Vane (Weather Vane) |
|
Indicates the direction from which wind originates. |
|
6 |
Rainfall |
Rain Gauge |
|
Measures the amount of precipitation over time. |
|
7 |
Cloud Height
|
Ceilometer |
|
Uses laser or infrared sensors to determine cloud base height and sky condition. |
|
8 |
Visibility |
Transmissometer/ Visibility Sensor |
|
Determines horizontal visibility, especially in fog and smog. |
|
9 |
Dew Point |
Dew Cell / Psychrometer |
Measures the temperature at which air becomes saturated. |
|
|
10 |
Solar Radiation |
Pyranometer |
Measures global solar irradiance on a flat surface. |
|
|
11 |
UV Radiation |
UV Radiometer / UV Sensor |
Measures intensity of ultraviolet solar radiation. |
|
|
12 |
Snowfall |
Snow Gauge / Snowboard |
Collects and quantifies snow accumulation. |
|
|
13 |
Evaporation Rate |
Atmometer / Evaporimeter |
Measures water evaporation from surfaces or soil. |
|
_______
_______
A list of all the basic weather elements you see in the weather forecast:
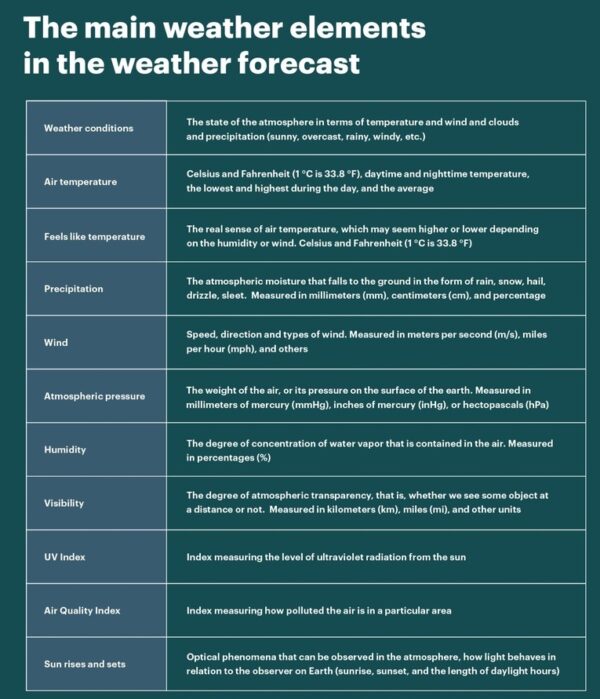
Figure above shows main weather elements you see in the weather forecast.
_
The main weather elements can be divided into several groups: basic parameters, additional parts, and various kinds of indices and optical phenomena.
- General weather conditions:
Weather conditions are the first thing you usually pay attention to when you look at the general weather forecast for the day. There are several of them in total, but they are conveyed in simple words that anyone can understand: sunny, overcast, rainy, windy, and so on. In the forecasts, these conditions are indicated by weather symbols most of which are also easy to understand from the first try: the sun is for sunny, two raindrops are for moderate rain, the cloud is for a cloudy day…
Clouds come in a variety of forms. Not all of them produce precipitation. Wispy cirrus clouds, for example, usually signal mild weather. Other kinds of clouds can bring rain or snow. A blanketlike cover of nimbostratus clouds produces steady, extended precipitation. Enormous cumulonimbus clouds, or thunderheads, release heavy downpours. Cumulonimbus clouds can produce thunderstorms and tornadoes as well.
_
Three main weather elements:
Every weather forecast contains the three main weather parameters: temperature, precipitation, and wind. These elements make up the weather in the first place because they are the most critical for humans.
- Temperature:
When we talk about temperature, we mean air temperature, which can be different depending on the time of year, altitude, and other factors.
But there is a second common type of it that you can see in the weather forecast — feels like temperature. This is our real sense of air temperature, which may seem higher or lower depending on the humidity or wind. That’s why two important parameters are taken into account when calculating this temperature: the Heat Index and the Wind Chill.
Temperatures are measured in degrees, in the two common systems of Celsius and Fahrenheit, and come in daytime and nighttime temperatures, and the lowest and highest during the day, and the average.
- Precipitation:
Precipitation is atmospheric moisture that falls to the ground in the form of rain, snow, or hail. But it can also be drizzle, sleet, and many other types of precipitation. They result from interactions with other weather elements: temperature, humidity, wind, and others.
Sometimes the precipitation forecast is also expressed as a percentage. In this case you may see the phrase “Chance of rain” in the forecast. This seems simple to understand, but in general, calculating the probability of precipitation is a complicated thing.
Usually, the rain is measured in millimeters (mm) the snow is measured in centimeters (cm), and other units common to your region: inches (in), and so on. In general, heavy rain is 15–50 mm (0.5—1.9 in) in 12 hours, heavy snowfall is 7–20 cm (2.7–7.4 in) in the same 12 hours.
- Wind:
Wind is the movement of air. Wind forms because of differences in temperature and atmospheric pressure between nearby regions. Winds tend to blow from areas of high pressure, where it’s colder, to areas of low pressure, where it’s warmer.
In the upper atmosphere, strong, fast winds called jet streams occur at altitudes of 8 to 15 kilometers (5 to 9 miles) above the Earth. They usually blow from about 129 to 225 kilometers per hour (80 to 140 miles per hour), but they can reach more than 443 kilometers per hour (275 miles per hour). These upper-atmosphere winds help push weather systems around the globe.
Wind can be influenced by human activity. Chicago, Illinois, is nicknamed the “Windy City.” After the Great Chicago Fire of 1871 destroyed the city, city planners rebuilt it using a grid system. This created wind tunnels. Winds are forced into narrow channels, picking up speed and strength. The Windy City is a result of natural and manmade winds.
There are two main characteristics of wind that are not difficult to guess (or to find out if you often check the weather forecast) — speed and direction. They determine how fast the wind is (i.e. strong and destructive) and from where it blows, because that’s what it means: north (N), southwest (SW), or north-northeast (NNE). Wind direction always names the place the wind is coming from, not where it is going. A west wind originates in the west and moves east.
But that’s not all you can know about wind, of course, because it’s probably the most interesting weather parameter. For example, there are many different types of wind, including the wind gusts; it is measured with different scales and can be represented by the wind barbs on the weather map; you can read it better and faster with a wind rose, and more.
If we talk about the exact units of measurement, they are also the units adopted in your region: meters per second (m/s), miles per hour (mph), and others.
_
Three additional but still main weather elements:
In addition to the three basic parameters mentioned above, there are usually three other weather elements that are also considered essential: atmospheric pressure, humidity, and visibility.
- Atmospheric pressure:
In simple terms, atmospheric pressure is the weight of the air, or its pressure on the surface of the earth and everything on it, including humans, animals, plants, rocks, and other living things. Hence, pressure is either high or low. Changes in atmospheric pressure signal shifts in the weather. A high-pressure system usually brings cool temperatures and clear skies. A low-pressure system can bring warmer weather, storms, and rain.
The most important thing to know about changes in pressure is that it helps to predict the weather, such as weather fronts. In particular, if you know exact atmospheric pressure figures, you can predict the weather for the next 12–24 hours. The pressure also affects how people feel, and so on.
Pressure is measured in millimeters of mercury (mmHg), inches of mercury (inHg), or hectopascals (hPa) at sea level (in a normal weather forecast), but it can also be measured at different altitudes, because the higher you are, the less air above you and its pressure on you. The normal pressure is 760 mmHg (29.92 inHg, 1,013.25 hPa).
An average low-pressure system, or cyclone, measures about 995 millibars (29.4 inches). A typical high-pressure system, or anticyclone, usually reaches 1,030 millibars (30.4 inches). The word “cyclone” refers to air that rotates in a circle, like a wheel.
Atmospheric pressure changes with altitude. The atmospheric pressure is much lower at high altitudes. The air pressure on top of Mount Kilimanjaro, Tanzania—which is 5,895 meters (19,344 feet) tall—is 40 percent of the air pressure at sea level. The weather is much colder. The weather at the base of Mount Kilimanjaro is tropical, but the top of the mountain has ice and snow
- Humidity:
It is characterized by the degree of concentration of water vapor that is contained in the air. In other words, the air can be wetter or drier. Humidity, however, is more complicated than it sounds. That’s because there are three different subtypes: absolute humidity, relative humidity, and specific humidity. The humidity you see in the weather forecast is the second type, although all three are widely used in meteorology and are related to each other.
Humidity is usually expressed as relative humidity, or the percentage of the maximum amount of water air can hold at a given temperature. Cool air holds less water than warm air. At a relative humidity of 100 percent, air is said to be saturated, meaning the air cannot hold any more water vapor. Excess water vapor will fall as precipitation. Clouds and precipitation occur when air cools below its saturation point. This usually happens when warm, humid air cools as it rises.
- Visibility:
Visibility as a weather element speaks to the degree of atmospheric transparency, that is, whether we see some object at a distance or not. For example, the most common fog is a serious obstacle for drivers, pilots, cyclists, and even pedestrians. Other weather elements that reduce visibility are haze, snowstorms, sand or dust storms, and others. That’s why visibility is one of the crucial parameters, which is included in almost all forecasts as one of the top ten things.
This weather element is also divided into several types — primarily depending on the time of day, and refers to the actual weather, that is, what is observed here and now (and will not be tomorrow).
Visibility is measured in the same units as the distance at which the observed object becomes invisible to the eye and is expressed in kilometers (km), miles (mi), and other units.
_
Two main meteorological indices:
There are two main weather indices that you can find in almost all weather forecasts:
- Ultraviolet Index:
The UV Index is an index developed and standardized for use around the world by the World Health Organization (WHO) and several other such agencies to measure the level of ultraviolet radiation from the sun.
- Air Quality Index:
AQI is an index for measuring the quality of the air. In other words, we can use the index to determine how polluted the air is in a particular area.
_
The main optical weather phenomenon:
Meteorology is not only temperature, precipitation, and wind, but also the various optical phenomena that can be observed in the atmosphere, that is, essentially how light behaves in relation to the observer on Earth. Weather forecasts usually indicate the main such a phenomenon — sunrise and sunset, and sometimes the length of daylight hours.
______
______
Causes of weather changes:
On Earth, common weather phenomena include wind, cloud, rain, snow, fog and dust storms. Some more common events include natural disasters such as tornadoes, hurricanes, typhoons and ice storms. Almost all familiar weather phenomena occur in the troposphere (the lower part of the atmosphere). Weather does occur in the stratosphere and can affect weather lower down in the troposphere, but the exact mechanisms are poorly understood.
_
Uneven heating of the Earth’s surface by the sun and the resulting movement of air and water in the atmosphere cause weather changes on Earth.
Key factors driving Weather Changes:
- Solar Energy: The sun heats the Earth unequally because of the planet’s curved shape and tilt, creating temperature differences between the equator and poles. Warm air rises and cold air sinks because of differences in density and gravitational displacement caused by temperature. This continuous cycle of warm air going up and cold air going down creates convection currents, which drive weather patterns and circulate heat.
- Wind and Air Movement: Warm air is lighter and rises, while cool air is heavy and sinks. This constant shifting creates wind as air moves to balance out pressure and temperature.
- Water Cycle and Clouds: As warm, humid air rises, it cools and turns water vapor into tiny droplets, forming clouds that eventually produce rain or snow.
- Pressure Systems: High and low atmospheric pressure areas move across the Earth. Low-pressure systems usually bring clouds and rain, while high-pressure systems bring clear skies.
- Earth’s Rotation and Geography: The rotation of the Earth (the Coriolis effect) bends wind directions, while local features like mountains and oceans shape regional wind and moisture patterns.
- Air Masses and Fronts: When large bodies of warm and cold air collide, they form weather fronts that frequently bring storms, rain, or sudden temperature drops.
_
Weather is the daily condition of the atmosphere and its minute-to-weekly variance. Weather is commonly thought of as a collection of variables such as temperature, humidity, precipitation, cloudiness, visibility, and wind. Weather occurs primarily due to air pressure, temperature and moisture differences from one place to another. These differences can occur due to the sun angle at any particular spot, which varies by latitude in the tropics. In other words, the farther from the tropics one lies, the lower the sun angle is, which causes those locations to be cooler due to the spread of the sunlight over a greater surface. The strong temperature contrast between polar and tropical air gives rise to the large scale atmospheric circulation cells and the jet stream. Weather systems in the mid-latitudes, such as extratropical cyclones, are caused by temperature contrasts between warm and cold air masses. Weather systems in the tropics, such as monsoons or organized thunderstorm systems, are caused by different processes.
_
Because the Earth’s axis is tilted relative to its orbital plane, sunlight is incident at different angles at different times of the year. In June the Northern Hemisphere is tilted towards the Sun, so at any given Northern Hemisphere latitude sunlight falls more directly on that spot than in December. This effect causes seasons. The 23.5-degree tilt of Earth’s rotational axis—not its elliptical orbit—is the primary driver of our season. The Earth’s elliptical orbit causes minor variations in solar radiation and seasonal speeds, but it does not drive our main weather or seasonal temperature changes. Over thousands to hundreds of thousands of years, changes in Earth’s orbital parameters affect the amount and distribution of solar energy received by the Earth and influence long-term climate.
_
The uneven solar heating (the formation of zones of temperature and moisture gradients, or frontogenesis) can also be due to the weather itself in the form of cloudiness and precipitation. Higher altitudes are typically cooler than lower altitudes, which is the result of higher surface temperature and radiational heating, which produces the adiabatic lapse rate. In some situations, the temperature actually increases with height. This phenomenon is known as an inversion and can cause mountaintops to be warmer than the valleys below. Inversions can lead to the formation of fog and often act as a cap that suppresses thunderstorm development. On local scales, temperature differences can occur because different surfaces (such as oceans, forests, ice sheets, or human-made objects) have differing physical characteristics such as reflectivity, roughness, or moisture content. Surface temperature differences in turn cause pressure differences. A hot surface warms the air above it causing it to expand and lower the density and the resulting surface air pressure. The resulting horizontal pressure gradient moves the air from higher to lower pressure regions, creating a wind, and the Earth’s rotation then causes deflection of this airflow due to the Coriolis effect. The simple systems thus formed can then display emergent behaviour to produce more complex systems and thus other weather phenomena. Large scale examples include the Hadley cell while a smaller scale example would be coastal breezes.
_
Warm air rises and cold air sinks.
Warm air rises and cold air sinks because of differences in density and gravitational displacement caused by temperature. Heating air gives its molecules more energy, making them move much faster. Fast-moving molecules bounce off each other and spread further apart. This expansion means fewer molecules fit into the same amount of space, making the warm air lighter or less dense than the cooler air around it.
Higher Temperatures = Lower Air Density, as seen in figure below.
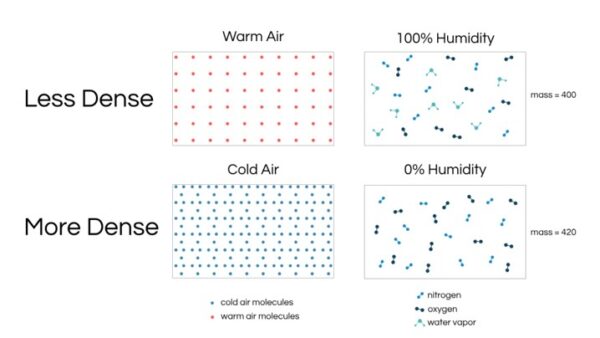
Gravity pulls heavily on the dense, cold air surrounding the warm air. The heavier, cooler air slides underneath the warm air and pushes it upward. Because cold air packs tightly together and has a higher density, gravity pulls it down toward the ground. This continuous cycle of warm air going up and cold air going down creates convection currents, which drive weather patterns and circulate heat.
Higher Humidity = Lower Air Density, as seen in figure above.
While you may often hear wet, humid weather described as “heavy”, counterintuitively, humid air is less dense than dry air. This is because water vapor molecules actually weigh less than the oxygen or nitrogen molecules they replace. The impact, however, is relatively small.
In a nutshell, warm humid air rises, cold dry air sinks.
_
Sea and land breeze.
A sea breeze is a cool wind that blows from the sea to the land during the daytime. The sun warms both the land and the water, but land heats up much quicker than water. The air above the land gets hot, becomes lighter, and rises into the atmosphere. This creates a low-pressure area over the land. Cooler, heavier air sitting over the sea rushes in toward the land to fill the empty space, creating a refreshing sea breeze. After the sun sets, the land loses its heat quickly, while the sea retains heat longer. The air above the now-cooler land becomes cool and dense, creating a high-pressure zone. The air above the sea is warmer and rises, creating a low-pressure area, which causes the wind to blow from the land out toward the sea.
_
The atmosphere is a chaotic system. As a result, small changes to one part of the system can accumulate and magnify to cause large effects on the system as a whole. This atmospheric instability makes weather forecasting less predictable than tidal waves or eclipses. Although it is difficult to accurately predict weather more than a few days in advance, weather forecasters are continually working to extend this limit through meteorological research and refining current methodologies in weather prediction. However, it is theoretically impossible to make useful day-to-day predictions more than about two weeks ahead, imposing an upper limit to potential for improved prediction skill.
_______
_______
Weather systems:
Weather system is an organized set of atmospheric conditions—such as wind, pressure, temperature, and moisture—that interact to create specific weather patterns over a region. For example, high/low pressure, fronts etc. Weather system is the cycle of temperature, air pressure, wind, and water in the atmosphere. Weather system is a complex, chaotic pattern driven by solar heating, air pressure shifts, and moisture movement across the globe. The sun heats the Earth unevenly. This creates warm and cold areas. Warm air rises and creates low pressure. Cold air sinks and creates high pressure. Air moves from high-pressure areas to low-pressure areas. Water vapor floats in the air. It forms clouds and rain. High pressure sinking air brings clear skies and calm days. Low pressure rising air brings clouds, storms, and rain. A weather map is filled with symbols indicating different types of weather systems. Spirals, for instance, are cyclones or hurricanes, and thick lines are fronts. Cyclones have a spiral shape because they are composed of air that swirls in a circular pattern.
_
Meteorologists classify weather systems according to their size and how long they last. The two largest and longest-lasting types of systems are planetary-scale systems and synoptic-scale systems. Planetary-scale systems are the belts of winds that circle the globe and may blow in the same direction for weeks at a time. Synoptic-scale systems cover a portion of a continent or ocean and last up to a week or so. The term synoptic comes from a Greek word meaning a general view.
Two briefer and smaller types of systems are mesoscale systems and microscale systems. Mesoscale systems may last an hour or less and are so small they may affect the weather of only part of a city. Examples include thunderstorms and sea breezes. Microscale systems, such as tornadoes, usually last only several minutes and affect an area not much larger than a few football fields.
______
Temperature:
Temperature means air temperature. Air temperature is a measure of the energy of motion of the air’s gas molecules. The factors most responsible for the heating and cooling of the atmosphere are radiation arriving from the sun and radiation flowing from Earth.
The sun continually sends energy into space as electromagnetic radiation. One kind of solar radiation is visible light. The other forms of solar electromagnetic radiation are invisible to human beings. They include infrared (heat) rays and ultraviolet rays. About 30 percent of the solar electromagnetic radiation that reaches the atmosphere is reflected back into space, mostly by clouds. The atmosphere and Earth’s surface absorb the remaining 70 percent, becoming warmer. The temperature of an area depends on the strength of the sun’s rays, which is determined by the angle at which the rays hit the earth. The earth’s temperature is hotter at the equator and colder at the poles because of the difference in the angle of the sun’s rays. Since the earth is round, the sun’s rays hit different areas at different angles; the higher the latitude the more slanted are the sun’s rays. In tropical or lower latitude areas the sun stays more or less overhead throughout the year. Since direct rays provide more heat than rays at an angle, the tropics receive the most heat and have the warmest average temperatures.
The warmed Earth cools by radiating infrared rays. Some of this radiation travels directly into space. The atmosphere absorbs almost all the remainder as it streams off the surface of the planet. This absorption of radiation, known as the greenhouse effect, makes the air near Earth’s surface about 59 Fahrenheit degrees (33 Celsius degrees) warmer than it would be otherwise.
The atmosphere also sheds heat energy by radiating infrared rays. Some of this infrared radiation flows down to the surface, while the remainder travels out into space.
Air temperature generally varies from day to night and from season to season because of changes in the amount of radiation heating Earth’s atmosphere. For example, days usually are warmer than nights because Earth receives the heating rays of the sun only during the day. At night, infrared radiation from the planet streams off into space, and the air temperature drops.
Air temperature also changes with the seasons. Except near the equator, where temperatures remain fairly constant the year around, summers are warmer than winters. In the summer, the sun is higher in the sky, and days are longer. When the sun is higher above the horizon, the intensity of the sunlight striking Earth’s surface increases. More hours of sunlight in summer also mean more solar heating.
Altitude also affects air temperature. Within the troposphere, the air temperature generally drops 3.5 Fahrenheit degrees per 1,000 feet of elevation (6.5 Celsius degrees per 1,000 meters of elevation). Thus, it is usually colder on top of a mountain than in the surrounding lowlands.
The temperature of a certain area depends upon a set of conditions that are called climate controls. These controls include latitude, altitude, topography, distance from large bodies of water, and nearby ocean currents. All these factors added up together to create temperature of an area.
_
Relative humidity and air temperature have an inverse relationship, meaning that when temperature goes up, relative humidity goes down if the actual moisture in the air stays the same. Warmer air has more energy and a larger capacity to hold water vapor than cold air. Cooler air holds less moisture, meaning even a small amount of water vapor can result in a high relative humidity percentage.
_
Temperature and air density have an inverse relationship, meaning that when air temperature goes up, air density goes down. Heat gives air molecules high energy. They move fast and spread far apart. This expansion means fewer molecules fit in the same volume, creating lower density. Cold removes energy from molecules. They move slowly and pack tightly together. More molecules fit into that same space, creating higher density.
Scientists show this with the ideal gas law equation:
D = P/RT
D is density.
P is pressure.
R is a constant number for gas.
T is temperature.
Because temperature T is on the bottom of the fraction, a higher temperature results in a lower density. Hot air is lighter than the cool air around it, so it rises. Note that density of air is directly proportional to pressure.
______
Pressure:
Atmospheric pressure, also known as air pressure or barometric pressure (after the barometer), is the pressure within the atmosphere of Earth. The standard atmosphere (symbol: atm) is a unit of pressure defined as 101.325 kPa (1,013.25 hPa), which is equivalent to 1,013.25 millibars, 760 torr (or about 760 mmHg), about 29.9212 inHg, or about 14.696 psi. The atm unit is roughly equivalent to the mean sea-level atmospheric pressure on Earth; that is, the Earth’s atmospheric pressure at sea level is approximately one atm.
In most circumstances, atmospheric pressure is closely approximated by the hydrostatic pressure caused by the weight of air above the measurement point. Atmospheric pressure decreases with higher altitude because Earth’s gravity pulls most air molecules close to the ground, leaving fewer molecules and less weight pressing down from above.
Atmospheric pressure is caused by the gravitational attraction of the planet on the atmospheric gases above the surface and is a function of the mass of the planet, the radius of the surface, and the amount and composition of the gases and their vertical distribution in the atmosphere. It is modified by the planetary rotation and local effects such as wind velocity, density variations due to temperature and variations in composition. Pressure on Earth varies with the altitude of the surface, so air pressure on mountains is usually lower than air pressure at sea level.
Air pressure also changes from place to place across Earth’s surface. Part of this change is due to differences in land elevation. Most of the remainder is caused by changes in air temperature. Cold air is relatively dense — that is, it has more air molecules per unit volume — and so it exerts relatively high pressure. Warm air is less dense and exerts relatively low pressure.
Regions where air pressure is relatively high usually experience fair weather, while regions where air pressure is relatively low experience cloudy, stormy weather. Generally, the weather stays fair or improves if air pressure rises. If the air pressure falls steadily, however, the weather may turn cloudy and rainy or snowy.
Air moves from areas where the air pressure is relatively high toward areas where the air pressure is relatively low. This movement of air is what we call wind.
_
Low pressure and high pressure:
We often hear the terms high pressure and low pressure in weather reports. Low pressure means that the atmospheric pressure of a region is lower than the surrounding area; when the situation is reversed, it is called high pressure. Therefore, the designation of high and low pressure is only relative like the designation of peaks and valleys in mountainous areas.
Every day meteorologists collect barometric pressure readings measured simultaneously at weather stations all over the world, and then update them on a map with the location of the weather stations marked on it. They then will connect by pencil the weather stations that have the same pressure readings thereby drawing an isobaric line. The chart formed by these isobaric lines is called the synoptic chart (or a weather map). By studying the distribution of the isobaric lines on the chart we can clearly see the location and distribution of the high and low pressure systems on the surface of the Earth.
Usually, low pressure occurs in mid-latitude temperate zones. It is formed by the movement caused by the colliding surface (i.e. front) of two characteristically different warm and cold air masses when they meet. The development of a low pressure system can be divided into four stages: early, mature, decay, and dissipation. The average life span of a low pressure system is about seven days.
In the Northern Hemisphere, due to the rotation of the Earth and surface friction, the air currents surrounding a low pressure system will flow in a counterclockwise direction, toward the center of the low pressure (Figure below). As a result, air flows will gather from the surrounding area and accumulate at the center of the low pressure system, forcing the air in the center to rise, cooling and condensing the water vapor in the uplifted air, forming clouds and eventually rain. Therefore, regions under a low pressure system usually experience bad weather. Air flows surrounding a high pressure system, on the other hand, flow in clockwise direction; the air flows out of the center (Figure below) forcing the air over the center to flow down and outward.
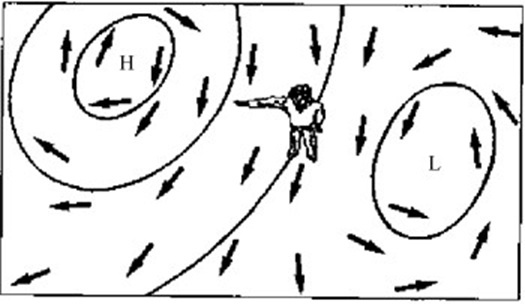
In the Northern Hemisphere, the wind in a high pressure system flows in clockwise direction out of the center, while in low pressure system wind flows in a counterclockwise direction towards the center. Therefore, with his back to the wind, the person will have high pressure at his right and low pressure at his left as seen in the figure above.
Low pressure systems are what lead to clouds and precipitation to form due to rising air. That rising air causes condensation at higher levels, which can form either liquid water or ice. When enough liquid water forms, it falls to the ground as rain. When enough ice forms, it falls to the ground as snow. Because temperature decreases with height, all summertime thunderstorms produce ice near the top of the thunderstorm. Without that ice, lightning and thunder within a thunderstorm would not be possible.
High pressure is usually associated with sinking air, and that sinking air suppresses the formation of clouds and precipitation. However, that doesn’t mean that no impactful weather can occur with high pressure systems. Sometimes they can cause strong winds which can be damaging and, because they are usually associated with dry air, they can cause dangerous fire weather conditions. These windy and dry conditions will become more impactful as wildfires continue to be a bigger problem, especially in the United States.
High pressure systems can also act as a steering flow for other low pressure systems. For example, a hurricane may move in a certain direction because of its proximity to strong high pressure, which forces it around its circulation. In the Northern Hemisphere, the air moving around an area of high pressure typically moves in a clockwise direction (sometimes referred to as anticyclonic).
_
What is considered a rapid pressure drop?
A fall of more than about 1 hPa per hour (3–4 hPa over three hours) counts as rapid and usually signals an approaching front or storm within 12–24 hours. A fall exceeding 6 hPa in three hours is very rapid and associated with severe weather: deep lows, squall lines, and damaging winds.
What barometer reading means a storm is coming?
No single reading does; the fall is the signal, not the value. That said, a barometer already below about 1000 hPa and still falling fast deserves attention, and readings under 980 hPa indicate a deep low is overhead or nearby. A high reading falling rapidly means deterioration is coming even though the current number looks benign.
______
Winds and wind systems on the Earth:
Wind is caused by the uneven heating of the Earth’s surface by the sun. This heat difference creates areas of high and low air pressure. Air moves from high-pressure areas to low-pressure areas, and that moving air is what we feel as wind. The sun warms the Earth, but land and water absorb heat at different speeds. Air over warm surfaces heats up, becomes light, and rises. This creates a low-pressure area. Cool air is heavy and stays close to the ground. It rushes in to fill the space left by the rising warm air. The rotation of the Earth bends the path of the wind. This is called the Coriolis effect. Mountains, valleys, and large bodies of water block or funnel the air. This creates local breezes and changes wind speed.
_
Wind is formed by the flow of air in horizontal directions. In meteorological definitions the coming direction of the wind is called wind direction. For example, Taipei will usually experience easterly winds in winter, meaning that the wind comes from the east. In weather observation, wind direction is presented by 16 directions or by angle degree. Common units for wind speed are as follows: meters per second (m/s), kilometers per hour (km/hr), miles per hour (mph), nautical miles per hour or knots. The converting of these units lists as follow:
1 m/s = 3.60 km/hr = 2.24 mph = 1.94 knot
_
Planetary-scale wind systems:
Suppose that Earth did not rotate and that the noon sun was always directly above the equator. Air temperatures would be highest at the equator and decrease toward the poles. Cold air is denser than warm air. Thus, air pressure would be higher at the poles and lower at the equator. Because air moves from areas of high pressure to areas of low pressure, cold air would sweep toward the equator, where it would push the warm air upward. In the upper atmosphere, the warm air would move toward the poles, cool, and sink over the poles. Thus, the planetary-scale circulation of wind would consist of two huge cells, one in each hemisphere.
In reality, the rotation of the Earth changes everything.
Rotation of Earth on its axis causes winds that blow long distances — thousands of miles or kilometers — to shift direction gradually. This shift is known as the Coriolis effect, which causes winds in the Northern Hemisphere to shift to the right and winds in the Southern Hemisphere to shift to the left. In the Northern Hemisphere, for example, winds blowing southward shift to the west. Winds blowing northward shift to the east.
Rotation of the planet also causes winds near Earth’s surface to split into three belts in each hemisphere. These three belts are (1) the trade winds, which blow near the equator, between 30 degrees north latitude and 30 degrees south latitude; (2) the westerlies (winds from the west), which blow in the middle latitudes between 30 degrees and 60 degrees north and south of the equator; and (3) the polar winds, which blow in the Arctic and Antarctic, from 60 degrees latitude toward the poles.
Figure below shows wind system on the surface of a rotating earth.
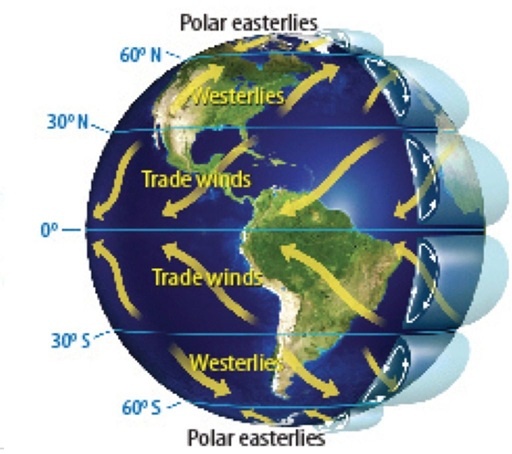
Trade winds north of the equator blow from the northeast. South of the equator, they blow from the southeast. The trade winds of the two hemispheres meet near the equator, causing air to rise. Rising air cools, and its relative humidity therefore increases. Thus, a band of cloudy, rainy weather circles the globe near the equator.
Westerlies blow from the southwest in the Northern Hemisphere and from the northwest in the Southern Hemisphere. Westerlies and trade winds blow away from the 30 degrees latitude belt. Over broad regions centered at 30 degrees latitude, surface winds are light or calm, and air slowly descends. Air warms as it descends, and its relative humidity decreases, making clouds and precipitation unlikely. As a result, fair, dry weather characterizes much of the 30 degrees latitude belt.
Polar winds are easterlies (winds from the east). They blow from the northeast in the Arctic and from the southeast in the Antarctic. In the Northern Hemisphere, the boundary between the cold polar easterlies and the mild westerlies is known as the polar front. A front is a narrow zone of transition, usually between a mass of cold air and a mass of warm air. Storms develop and move along the polar front, bringing cloudiness, rain, or snow.
_
Important seasonal changes take place in Earth’s wind patterns. Wind belts shift toward the poles in spring and toward the equator in fall. For example, during the fall, the polar front in the Northern Hemisphere often moves from Canada down to the continental United States.
Planetary-scale winds control the direction of movement of smaller-scale weather systems. For example, in the tropics, trade winds generally steer hurricanes and other weather systems from east to west. In middle latitudes, westerlies move weather systems from west to east. The westerlies are particularly vigorous near the top of the troposphere and just over the polar front. This corridor of exceptionally strong winds is known as a jet stream. The jet stream of the polar front supplies energy to developing storms and then moves them rapidly along the front.
_
Beaufort scale:
The Beaufort scale is a system that connects wind speed to what you can see on land or at sea. The air is seldom still and winds may be steady in strength or gusting. They may have a predominant direction or swirl around. Strong winds add to the resistance a ship experiences, make it heel and make manoeuvring difficult. Masters of sailing ships dreaded being caught close to a rocky lee shore. Winds create waves. The main influence of the wind is felt indirectly through the waves it generates on the surface of the sea. The severity of these waves will depend upon the strength (i.e. velocity) of the wind, the time it acts (i.e. its duration) and the distance over which it acts (i.e. the fetch). The strength of the wind is broadly classified by the Beaufort Scale. The numbers 0 to 12 were introduced by Admiral Sir Francis Beaufort in 1806, 0 referring to a calm and force 12 to a wind of hurricane force. At first it was only used over the sea, but later it was extended for use over land. After several amendments it became the general measure of wind force used today.
_
Jet streams:
Jet streams are fast-flowing, narrow bands of strong winds high in the atmosphere, typically located 9 to 16 kilometers (30,000 to 50,000 feet) above sea level. They circle the globe primarily from west to east due to the Earth’s rotation and sharp temperature differences between the equator and the poles. Uneven solar heating creates a heavy thermal gradient between cold polar air and warm tropical air. The resulting pressure differences, combined with the Coriolis effect from Earth’s spin, pinch the moving air into swift, horizontal ribbons. They steer surface storms, low-pressure systems, and air masses across continents. Pilots use them to boost travel speeds when flying west-to-east, or avoid them when heading in reverse to save fuel.
Figure below is an image of 250 millibar winds. The jet stream is shown in the blue shading.
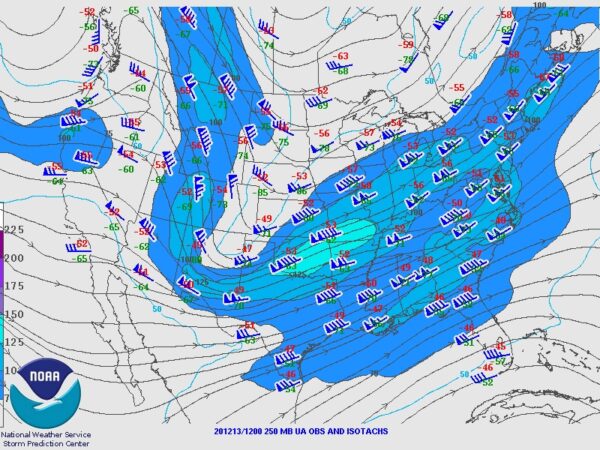
The jet stream almost always moves from west to east with the rotation of the Earth. Wind speeds in the jet stream can reach between 100 and 200 miles per hour. The jet stream doesn’t usually travel in a straight line; it usually has peaks and valleys. These peaks and valleys often create weather systems which lead to impactful weather events. The peaks are referred to as “ridges” and the valleys are referred to as “troughs.” These “waves” in the jet stream are referred to as Rossby waves, which are usually between 1,000 and 2,500 miles long. When there is a ridge in the jet stream in the Northern Hemisphere (where the jet stream is closer to the North Pole), warmer air is generally moving further north. When there is a trough in the jet stream in the Northern Hemisphere (where the jet stream is closer to the equator), colder air is generally moving further south. This movement of warmer and colder air can help lead to weather fronts, which are responsible for most weather phenomena.
________
Synoptic scale weather systems:
Synoptic-scale systems include air masses, fronts, lows, and highs. The movement of these systems causes the day-to-day changes in the weather of Europe, the continental United States, and other regions in the middle latitudes.
___
Air masses:
An air mass is a huge volume of air covering thousands of square miles or kilometers that is relatively uniform in temperature and humidity. The properties of an air mass depend on where it forms. Air masses that develop at high latitudes are colder than air masses that form over low latitudes. Air masses that form over the ocean are relatively humid, and those that form over land are relatively dry. The four basic types of air masses are (1) cold and dry, (2) cold and humid, (3) warm and dry, and (4) warm and humid.
_
Across North America, warm air masses move north and northeastward, and cold air masses move south and southeastward. Maritime polar air, which is cool and humid, forms over the North Pacific and North Atlantic. This air mass brings low clouds and precipitation to the Pacific Northwest, New England, and eastern Canada. Continental polar air, which is dry and cold in winter and dry and mild in summer, forms in north-central Canada. Arctic air, which is dry and much colder than continental polar air, forms over the snow-covered regions north of about 60 deg latitude in the Northern Hemisphere. The movement of Arctic air to the south causes the bone-numbing cold waves that sweep across the Great Plains and Northeast in winter.
Most of the maritime tropical air that invades North America originates over the Gulf of Mexico and the tropical Atlantic. This warm, humid air mass brings oppressive summer heat waves to areas east of the Rocky Mountains. Continental tropical air forms over the deserts of Mexico and the southwest United States. In summer, this hot, dry air mass surges over Texas and other parts of the American Southwest.
_
As an air mass travels from place to place, its temperature and humidity can change. For example, air over the Pacific Ocean west of North America is mild and humid. If that air mass moves eastward, it is forced up the slopes of the coastal mountain ranges. Air temperature drops, the relative humidity increases to saturation, clouds form, and rain or snow develops. As the air travels down the opposite slopes of the mountain ranges, the air temperature rises, the relative humidity decreases, and clouds thin out or vanish.
This process repeats with each mountain range the air mass encounters as it moves eastward. By the time it reaches the Western Plains, the air mass has become considerably drier and milder. This modified air mass, known as Pacific air, brings mild, dry weather to much of the central and eastern regions of the United States and Canada.
___
Fronts:
Fronts form where air masses meet. A front is a narrow zone of transition between air masses that differ in temperature or humidity. In most cases, the air masses differ in temperature, so that the fronts are either warm or cold. When cold air moves forward, it will displace the warm air and force the warm air to recede; this kind of front is called a cold front. In the reverse situation, it is called a warm front. When the strength of the cold and warm fronts are not significantly different the front will linger and it will be called a stationary front.
_
A warm front is the leading edge of an advancing warm air mass. Warm air is less dense than cold air, so warm air advances by riding up and over the retreating cold air. As the warm air ascends, its temperature drops, relative humidity increases, and clouds and perhaps precipitation form. In North America, clouds can extend hundreds of miles or kilometers to the north and northwest of a warm front. Rain or snow is usually light to moderate and may last 12 to 24 hours or longer. Warm fronts are usually shown on weather maps as a red line with red semicircles pointing in the direction the front is moving.
_
A cold front is the leading edge of an advancing cold air mass. Cold air is denser than warm air, so that cold air advances by moving under and pushing up the retreating warm air. As warm air ascends, its temperature falls, relative humidity rises, and clouds and often precipitation develop. Clouds associated with a cold front typically form a narrow band along the front. Rain or snow falls in brief showers. If the cold front is fast-moving and well-defined by considerable temperature contrast across the front, thunderstorms are likely. Some of these thunderstorms could become severe and produce hail, torrential rains, or strong winds. Tornadoes also may develop from severe thunderstorms. Cold fronts are usually shown on weather maps as a blue line with blue triangles pointing in the direction the front is moving.
_
A front that stalls is known as a stationary front. The weather along a stationary front often consists of considerable cloudiness and light rain or snow. Stationary fronts are usually shown on weather maps as an alternating blue and red line with alternating blue triangles and red semicircles pointing in both directions.
Occluded fronts are a special type of front where a cold front catches up to a warm front. Cold fronts typically move faster than warm fronts because warm fronts are working against the density of the air whereas cold fronts are working with the density of the air. When an occluded front occurs, the chances for severe weather are limited, but impactful heavy rain and snow events can still occur. Occluded fronts are usually shown on weather maps as a purple line with purple triangles and semicircles pointing in the direction the front is moving.
_
Lows:
Lows are areas of relatively low air pressure. The winds in a low pressure system bring contrasting air masses together to form fronts. For this reason, lows are sometimes described as the chief weather-makers of regions in the middle latitudes. Scientists use the term cyclone to refer to a synoptic-scale low-pressure area. They also use the term to mean a hurricane in some parts of the world.
Viewed from above in the Northern Hemisphere, surface winds in a low-pressure area blow in a counterclockwise and inward direction. Surface winds converging in the low cause air to rise, cool, and reach saturation. Clouds and precipitation usually develop. Air ascends mostly along fronts that develop as winds in the low bring cold and warm air masses together.
Lows generally travel from southwest to northeast across North America and may complete a journey from Colorado to New England in three or four days. As a rule, temperatures are lower to the left (north) of the path followed by the low-pressure area and higher to the right (south). In winter, the heaviest snows usually fall about 90 to 150 miles (150 to 250 kilometers) to the north and west of the moving low-pressure area.
_
Highs:
Highs, also known as anticyclones, are areas of relatively high air pressure. A high, which brings fair weather, often follows in the wake of a low. Viewed from above in the Northern Hemisphere, surface winds in a high blow in a clockwise and outward direction. As winds blow out and away from a high, air descends near the center of the system. Descending air warms, and the relative humidity decreases.
Highs are either warm or cold. Warm highs form south of the polar front and are characterized by high temperatures and low relative humidities. Such highs are massive weather systems that extend from Earth’s surface to the top of the troposphere. In the summer, a warm high sometimes stalls over North America. If the high remains stationary for several weeks, it creates a drought.
Cold highs form north of the polar front. They are shallow masses of cold, dry air that develop mostly in the winter over the snow-covered regions of northern Canada, Alaska, and Siberia. As cold highs move southeastward over Canada and into the continental United States, they bring fair but cold weather.
_
Mesoscale and microscale systems result from the development and movement of synoptic and planetary-scale systems. Mesoscale systems, which may last an hour or less and affect only part of a city, include thunderstorms and sea breezes. A tornado is an example of a microscale system, the smallest and briefest of significant weather systems.
_______
Water vapor to clouds to precipitation:
Precipitation means rain, snow, or other forms of moisture falling from the clouds. All fresh water, whether on the surface or underground comes from the atmosphere in the form of precipitation. Globally, the atmosphere contains approximately 12,900 cubic kilometers of water vapor at any given time, approximately 7 times more than all the world’s rivers combined. Though this water is invisible to us in its vapor state, it plays a huge role in weather patterns, cloud formation, and even climate. On average, roughly 20% of the total atmospheric water budget in a given area will condense into clouds; of that amount, only about 30% will fall to the ground as precipitation naturally (roughly 6% of the overall water budget).
Water vapor constitutes approximately 0-4% of the atmosphere by volume. Together, evaporation from surface water and transpiration from plants contribute the water vapor in the air that can eventually form clouds. As the air rises in lower atmosphere it expands due to lower atmospheric pressure, and the energy used in expansion causes the air to cool. Generally speaking, for each 1000 meters which the air rises, it will cool by 6 °C. Reducing air temperature decreases its ability to hold water vapor so that condensation occurs. A cloud is a visible mass of tiny water droplets or ice crystals suspended in the atmosphere, forming when water vapor cools and condenses around microscopic particles (condensation nuclei) like dust or salt. Clouds are composed of large numbers of water droplets, or ice crystals, or both. Because of their small size and relatively high air resistance, they can remain suspended in the air for a long time, particularly if they remain in ascending air currents. It should be noted that condensation by itself does not cause precipitation (rain, snow, sleet, hail). The moisture in clouds must become heavy enough to succumb to gravity and return to earth’s surface.
There are various mechanisms by which air rises to form cloud. Heated by sunshine warmed air starts to rise because, when warm, it is lighter and less dense than the air around it. Air rises when wind blows into the side of a mountain range or other terrain and is forced upward, higher in the atmosphere. Clouds also form when air is forced upward at areas of low pressure. Air also rises when two large masses of air collide at the Earth’s surface.
Clouds usually form where air moves upward. As air ascends, it encounters lower and lower pressure. Air responds to lower pressure by expanding. Whenever gases expand, they cool. As air cools, its relative humidity increases until it reaches saturation and clouds form. Where air moves downward, clouds usually do not develop. Descending air is compressed, it warms up, and its relative humidity decreases. Saturation is not possible, and so clouds do not form.
Convective clouds form through strong vertical air motions, often associated with instability. Convective clouds (cumulonimbus) can produce intense, localized precipitation. Stratiform clouds develop in stable atmospheric conditions with gentle lifting over large areas. Stratiform clouds (altostratus, nimbostratus) generate widespread, longer-duration precipitation. Orographic clouds form when moist air is forced upwards by elevated terrain like mountains, causing it to cool, condense, and form visible clouds, often resulting in precipitation.
________
________
Weather Phenomena:
Weather phenomena are observable events and processes in Earth’s atmosphere. They are driven by solar radiation, air pressure, and moisture. On Earth, common weather phenomena include wind, cloud, rain, snow, fog and dust storms. Some more common events include natural disasters such as tornadoes, hurricanes, typhoons and ice storms. Almost all familiar weather phenomena occur in the troposphere (the lower part of the atmosphere).
Space and time scales of different atmospheric phenomena:
There are a variety of phenomena occurring in our atmosphere having different space and time scales as seen in figure below.
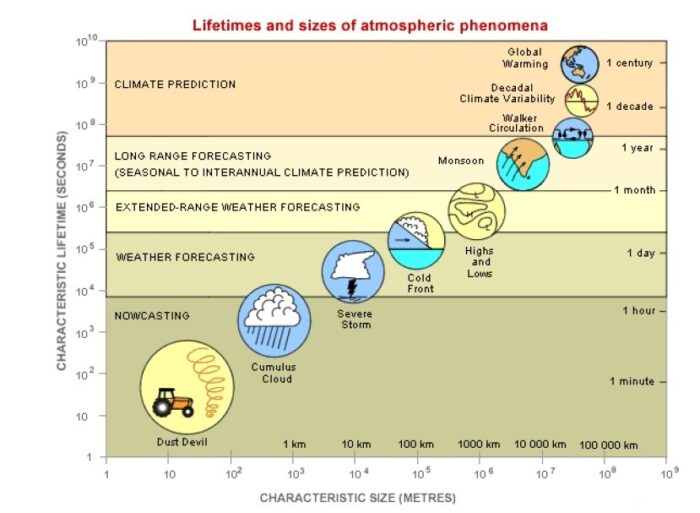
_
Some Common Weather Phenomena:
Mid-latitude cyclone:
The most common type of weather phenomena is a mid-latitude cyclone. This is a low pressure system which often occurs near the trough of the jet stream in the mid-latitudes (between 30 and 60 degrees north). Depending on the time of year and the temperatures, this weather phenomena can bring severe weather such as damaging winds, tornadoes, and large hail, as well as heavy snow and blizzard conditions. When the jet stream is relatively straight (just moving from west to east), mid-latitude cyclones are not likely to occur.
Tropical Cyclones:
Tropical cyclones (often referred to as tropical storms and hurricanes in the Atlantic Basin) are common low pressure systems in the summer and fall months, when the sea surface temperatures are often the warmest. The warm sea surface temperatures act as the “fuel” for tropical cyclones. Tropical cyclones also often occur in the Eastern Pacific, the Western Pacific, and the northern Indian Ocean. Tropical cyclones can bring catastrophic sustained winds of over 150 miles per hour, as well as rising sea levels (often called storm surge) several feet above high tide, and heavy rainfall over 20 inches.
Winter Weather:
The most common type of winter weather is snow, which is caused by mid-latitude cyclones. When snow is falling heavily enough and there are strong enough winds, blizzard conditions can occur, which can knock out power and make travel essentially impossible. One special type of mid-latitude cyclone that creates winter weather is called a Nor’easter. Nor’easters are named due to winds from the northeast; they form and move through the northeastern United States, bringing strong winds and heavy snow. Another common type of winter weather is freezing rain, which is caused by liquid rain that forms above freezing temperatures, but falls and hits the surface where temperatures are below freezing. The rain freezes on contact with the surface and can lead to ice buildup, causing widespread power outages and hazardous travel.
The location and track of the developing surface low pressure system is critical for forecasting where winter weather will occur. Just a slight difference in the timing or track of the low pressure minimum could mean the difference between getting feet of snow or getting no snow at all for a particular location. This is what gives meteorologists headaches when forecasting winter weather events. Many weather models will try to predict a possible outcome of where the surface low pressure will form and track, but rarely do they ever get it right on the nose. This is why most winter weather forecasts are more probabilistic (e.g. you might get 6-12 inches of snow), rather than deterministic, meaning there is one forecasted outcome (e.g. the high temperature today is 75 degrees).
Fire Weather:
Fire weather refers to the atmospheric conditions which wildfires more likely to occur and become stronger. This is most relevant to the central and western United States, where wildfires pose a significant threat to life and property. The basic ingredients for fire weather are dry air and strong winds. These conditions can occur throughout the year in the central and western United States. However, when there is a lot of precipitation making the ground more wet, fire weather is less likely to occur. One other consideration for forecasting fire weather is the availability for fuels, meaning how much brush and grass can be burned if a wildfire were to form. Even if it is very dry and windy, if there is nothing to burn, the wildfire will not occur.
______
______
Weather seasons:
A season is a time of year with distinct climatic conditions. Spring, summer, fall, and winter are predictable. Each has its unique seasonal light, temperature, and weather patterns. Seasons have a huge impact on plant development and vegetation. Winter is known for its cold, short days, and low plant growth. Spring brings new life to plants, trees, and flowers. Summer is the hottest and brightest season; therefore plants grow fast. Autumn brings cooler temperatures and leaf loss.
Earth’s weather seasons are caused by the planet’s 23.5-degree axial tilt as it revolves around the sun, creating different climate patterns depending on location.
The Four Temperate Seasons:
In mid-latitude and temperate regions, the year is divided into four main seasons that reverse between the Northern and Southern Hemispheres:
- Spring: March to May (Northern) / September to November (Southern); marked by warming temperatures and blooming plant life.
- Summer: June to August (Northern) / December to February (Southern); the hottest period with the longest days.
- Fall (Autumn): September to November (Northern) / March to May (Southern); a transition period with cooling temperatures and falling leaves.
- Winter: December to February (Northern) / June to August (Southern); the coldest months with shorter daylight hours.
_
Tropical and Regional Variations:
Not everywhere on Earth follows the traditional four-season model:
- Wet and Dry Seasons: Many tropical and equatorial areas experience a Time and Date rainy or monsoon season and a distinct dry season instead of hot and cold cycles.
- Six Seasons: Certain cultures and regions, such as Bangladesh, recognize six distinct traditional seasons (summer, monsoon, autumn, late autumn, winter, and spring) based on local micro-climates and calendars.
- Polar Regions: Polar zones experience extreme variations in daylight, effectively reducing the year into long, dark winters and brief, cool summers.
_
India experiences four primary weather seasons.
- Winter (December to February): Cool and dry weather with cold mornings and nights. Northern regions can get very cold with fog, while southern areas stay mild.
- Summer (March to June): Hot and dry weather. Temperatures often rise above 40°C in central and northern areas, accompanied by hot dry winds called “loo”.
- Monsoon (July to September): Rainy and humid weather. The southwest monsoon brings most of the country’s annual rainfall, which is vital for farming.
- Post-Monsoon / Autumn (October to November): A transition period with clear skies and pleasant temperatures as the rain retreats
__
The formation of monsoons:
In winter the land is colder than the sea, therefore the density and the pressure of the air over the land will be higher. As a result, wind flows from land to sea. In summer the situation will be reversed. The land is warmer and the air over land is lower in density; wind flows from sea to land. With extensive seasonal change of wind direction, it is called a “monsoon”. A monsoon is most noticeable in the south and east of Asia. This is due to the fact that in summer the Asian inland is heated up by the Sun and its temperature rises quickly, thereby creating an extensive low pressure region, which leads the air over the Indian Ocean to flow toward the land. This air current is called a “southwest monsoon” in Asia. The southwest monsoon can bring the wet oceanic air into inland Asia and generate continuous precipitation. This will bring abundant rainfall, sometimes even floods.
In winter, a high pressure system develops over the cold Asian Continent. A large amount of cold dry air blows out from the continent, and will only absorb water vapor until it reaches the ocean surface far from the land. On the east coast of the Mainland China, south of 30° N, this prevalent northeast wind is called a “northeast monsoon”. In winter the continental high pressure moves south. When the cold front edge arrives at the sea area near Taiwan via the East China Sea, along with it comes the northeast monsoon with substantially strong winds. During the northeast monsoon season, the north and northeast of Taiwan will experience cloudy and partially rainy weather.
A monsoon is most powerful in the south and east Asia, because the Asian Continent is the world’s largest land-mass. Other regions in the world that also experience monsoon phenomenon are Spain, the north of Australia, Africa (except the Mediterranean region), the U.S. west coast and Chile.
_____
_____
Tropical Weather versus extratropical weather:
What makes tropical weather different from that at higher latitudes (extratropic)?
Which is more predictable?
There are two reasons why tropical weather is different from that at higher latitudes. The sun shines more directly on the tropics than on higher latitudes (at least in the average over a year), which makes the tropics warm. And, the vertical direction (up, as one stands on the Earth’s surface) is perpendicular to the Earth’s axis of rotation at the equator, while the axis of rotation and the vertical are the same at the pole; this causes the Earth’s rotation to influence the atmospheric circulation more strongly at high latitudes than low. Because of these two factors, clouds and rain storms in the tropics can occur more spontaneously compared to those at higher latitudes, where they are more tightly controlled by larger-scale forces in the atmosphere. Because of these differences, clouds and rain are more difficult to forecast in the tropics than at higher latitudes. On the other hand, temperature is easily forecast in the tropics, because it doesn’t change much.
_
Heat, Moisture, Clouds and Rain:
The higher the temperature, the more water vapor can be in the air without condensing. As the sun shines strongly on the tropics — particularly on the warm oceans which have an effectively infinite amount of water to evaporate into the air — the overlying atmosphere becomes very humid. Temperature and pressure both drop quickly with altitude, in the tropics as elsewhere on Earth. If air rises — as it can, for example, if it is a little warmer and thus lighter than the air around it — it will expand and cool, eventually causing some of the water vapor in it to condense into tiny liquid droplets, forming a cloud. The latent heat of the condensation warms the air, causing it to become still warmer, and allowing the updraft to rise further. If enough water condenses, the cloud droplets can become large enough to fall as rain.
Sometimes a tropical shower ends quickly, as the clouds and falling rain evaporate. The evaporating rain cools the air near the surface, so that it isn’t warm enough to rise into a new cloud. Sometimes, though, the cooling effect as well as the weight of the rain itself can create a downdraft strong enough to create turbulence that in turn lifts nearby warm, humid air, making a new updraft (Figure below). This process can feed on itself to produce a large complex of such storms that maintains rainy weather over a period of days and a region thousands of km in extent, sometimes moving coherently across the tropics and generating new storms as it moves. The circumstances that lead to one outcome vs. another — very rainy weather over a large region, completely clear skies, or anything in between — sometimes differ only in subtle ways.
_
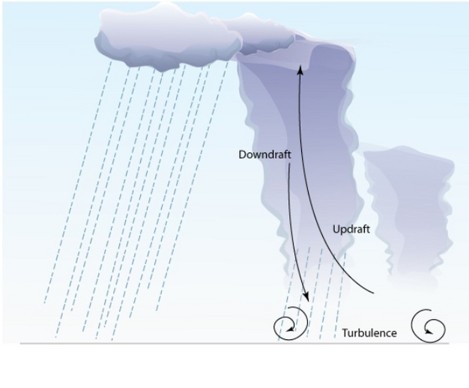
Figure above is a schematic of deep convective cloud showing an updraft, precipitation-driven downdraft, and turbulence below cloud base.
_
Rotation and the Coriolis Force:
The orientation of the tropics relative to the Earth’s rotation axis also complicates tropical weather prediction. At higher latitudes, where the rotation axis doesn’t make too great an angle to the vertical, the Coriolis force plays a big role in determining which way the wind blows. The Coriolis force makes the wind blow approximately parallel to the isobars, or lines of constant pressure. In the northern hemisphere, the wind goes clockwise around highs and counterclockwise around lows; opposite in the southern. If there were no Coriolis force, the wind would simply blow from high to low pressure, across the isobars. If that were to happen, the highs and lows wouldn’t last long. The wind would equalize the pressure field, flowing out of highs and into lows and making the pressure horizontally uniform. By preventing this, the Coriolis force allows the highs and lows to exist for a long time. These highs and lows — the weather systems of the extratropics — evolve in a somewhat predictable way. While being pushed along by the jet stream, they often arrange themselves into alternating high-low patterns in the east-west direction, sometimes referred to as “waves”. These wave patterns go through cycles of growth and decay that we understand, and that computer models are able to simulate accurately. Strong temperature contrasts — fronts — form where the highs and lows push warm air up against cold air, and clouds and rain tend to form where they push air upwards.
_
In the tropics, the Coriolis force is weak, the highs and lows flatten out, and global pressure maps show almost no structure — apart from the occasional tropical cyclone. With the flat pressure field comes a flat temperature field. There are no fronts in the tropics. Though temperature still drops quickly with height, at a given level the temperature is quite similar at any point within the tropics. So tropical temperature is quite predictable. Since it doesn’t change much, it’s easy to forecast, even far in advance. For a given upcoming date, just look up what the temperature was on that date in a few past years; it will probably have been not too different on that same date in different years, and will be within the same narrow range this year.
_
Winds and rain, on the other hand, are difficult to predict in the tropics. Without strong highs, lows and fronts pushing the air around and determining where it rises, the rain appears to form more from the spontaneous bubbling up of buoyant convective clouds. These convective clouds are what we know in many areas as thunderstorms — though over ocean in particular, they need not necessarily produce thunder and lightning. When these clouds become big and organized enough, they can generate their own large-scale weather systems. At any given moment, much of the tropics seems to have the potential for such systems to develop, but most of the time they do not, for reasons that are neither clear to scientists nor well-predicted by computer models. The humidity field may be part of the answer — regions of higher humidity may be more prone to disturbed weather than drier regions, and humidity varies more than temperature within the tropics, particularly in the upper atmosphere. However, this is not a completely satisfying or useful answer either, because humidity in turn is strongly influenced by the weather, and can change rapidly.
________
________
The urban climate:
The World Meteorological Organization (WMO) defines urban climate as “local climate which differs from that in neighbouring rural areas, as a result of urban development”. That means air temperature, precipitation, concentration of air pollutants, noise and wind speed often differ from the surrounding areas. For example, cities usually have a higher air temperature than the surrounding area and hence are in the focus of climatic spatial planning. In times of climate change, the climatic differences between the city and the surrounding regions might result in increasing heat stress on population and infrastructures during the warm(er) seasons.
The climate of a site may be regarded as the integration of a series of controls, differing in scale. ln sequence these are: the regional climate, determined by synoptic factors; the modifying effects of the local orography; and the self-induced modifications of the buildings and building groups themselves. In addition, in discussing urban climates, we have nevertheless to distinguish between (1) the modification of the climate by the accumulation of buildings (change of topography) and (2) the modification of the climate by urban air pollution. The growing rate of pollutants emitted into the atmosphere by anthropic activities, combined with the influence of topography change, leads to an accumulation of trace substances in the air over cities and, frequently, to the formation of haze. This haze dome, which builds up over densely populated areas, is concentrated or dispersed according to rate of emissions, the effective emission level above the ground, the wind profile, the vertical temperature profile and relief. The characteristics of the haze dome affect the quality of the urban environment. Thus, all these different factors and effects are important for discussing the urban environment from different perspectives, in particular due to the chain reactions involved.
___
Cities affect temperatures for thousands of miles:
Even if you live more than 1,000 miles from the nearest large city, it could be affecting your weather.
In a study that shows the extent to which human activities are influencing the atmosphere, scientists have concluded that the heat generated by everyday activities in metropolitan areas alters the character of the jet stream and other major atmospheric systems. This affects temperatures across thousands of miles, significantly warming some areas and cooling others, according to the study in Nature Climate Change in 2013.
The extra “waste heat” generated from buildings, cars, and other sources in major Northern Hemisphere urban areas causes winter warming across large areas of northern North America and northern Asia. Temperatures in some remote areas increase by as much as 1 degree Celsius (1.8 degrees Fahrenheit), according to the research by scientists at the Scripps Institution of Oceanography; University of California, San Diego; Florida State University; and the National Center for Atmospheric Research.
At the same time, the changes to atmospheric circulation caused by the waste heat cool areas of Europe by as much as 1 degree C (1.8 degrees F), with much of the temperature decrease occurring in the fall.
The net effect on global mean temperatures is nearly negligible — an average increase worldwide of just 0.01 degrees C (about 0.02 degrees F). This is because the total human-produced waste heat is only about 0.3 percent of the heat transported across higher latitudes by atmospheric and oceanic circulations.
The researchers stressed that the effect of waste heat is distinct from the so-called urban heat island effect. Such islands are mainly a function of the heat collected and re-radiated by pavement, buildings, and other urban features, whereas this study examines the heat produced directly through transportation, heating and cooling units, and other activities.
______
______
Weather observation and measurement:
Because no single country can constantly measure and report on conditions in every part of the atmosphere, the world’s nations must cooperate to monitor the weather effectively. To this end, they founded the International Meteorological Organization in 1873, renaming it the World Meteorological Organization (WMO) in 1950. Members of the WMO participate in the worldwide observation of the atmosphere and in the exchange of weather data and forecasts. Weather observations come from many different sources, including land-based observation stations, radar systems, weather balloons, airplanes, ships, and satellites.
_
The World Meteorological Organization coordinates the worldwide efforts that are prerequisite for the production of accurate and timely weather forecasts. Currently, there are well over 10000 manned and automatic surface weather stations, 1000 upper air stations (weather balloons with radiosondes), 7000 ships, 100 moored and 1000 drifting buoys, hundreds of weather radars and 3000 specially equipped commercial aircrafts that measure key parameters of the atmosphere, land and ocean surface every day. Additionally, there are some 30 meteorological and 200 research satellites in the global network for meteorological, hydrological and other geophysical observations. Each day in the United States over 210 million weather observations are processed and used to create weather forecasts.
_____
Surface and upper air weather measurements capture atmospheric conditions at ground level and through the vertical layers of the atmosphere.
Surface Weather Measurements:
- Location: Ground level up to 10 meters.
- Parameters: Temperature, dew point, wind speed, wind direction, barometric pressure, cloud cover, visibility, and precipitation.
- Frequency: Updated hourly or multiple times per hour.
- Instruments: Thermometers, barometers, hygrometers, anemometers, and rain gauges.
Upper Air Weather Measurements:
- Location: Vertical atmospheric layers from low levels (like 850 mb) up to the upper troposphere.
- Parameters: Altitude pressure profiles, vertical temperature, humidity, and high-altitude wind speed/direction.
- Frequency: Standard soundings typically twice daily at 00Z and 12Z.
- Instruments & Methods: Radiosondes (weather balloons), radar wind profilers, and satellite sounders.
______
Surface weather observation:
Surface weather observations are the fundamental data used for safety as well as climatological reasons to forecast weather and issue warnings worldwide. They can be taken manually, by a weather observer, by computer through the use of automated weather stations, or in a hybrid scheme using weather observers to augment the otherwise automated weather station. The ICAO defines the International Standard Atmosphere (ISA), which is the model of the standard variation of pressure, temperature, density, and viscosity with altitude in the Earth’s atmosphere, and is used to reduce a station pressure to sea level pressure. Airport observations can be transmitted worldwide through the use of the METAR observing code. Personal weather stations taking automated observations can transmit their data to the United States mesonet through the Citizen Weather Observer Program (CWOP), the UK Met Office through their Weather Observations Website (WOW), or internationally through the Weather Underground Internet site. A thirty-year average of a location’s weather observations is traditionally used to determine the station’s climate. In the US a network of Cooperative Observers makes a daily record of summary weather and sometimes water level information.
_
Surface weather observations can include the following elements:
- The Station Identifier, or Location identifier, consists of four characters for METAR observations, with the first representing the region of the world the station lies within. For example, the first letter for areas in and around the Pacific Ocean is P, and for Europe is E. The second character may represent the country/state the location lies within. For Hawaii, the first two letters are “PH” while for Great Britain, the first two letters of the station identifier are “EG”. Canada and the contiguous United States are an exception, with the first letters C and K representing the regions, respectively. The final two or three letters normally represent the name of the location or airport.
- Visibility, measured in meters for most sites worldwide, except in the United States where statute miles are reported.
- Runway visibility, measured in meters in many locations worldwide, or feet within the United States.
- Temperature is a measure of the kinetic energy of a sample of matter. Temperature is the unique physical property that determines the direction of heat flow between two objects placed in thermal contact. If no heat flow occurs, the two objects have the same temperature; otherwise heat flows from the hotter object to the colder object. Temperature, within meteorology, is measured with thermometers exposed to the air but sheltered from direct solar exposure. In most of the world, the degree Celsius scale is used for most temperature measuring purposes. However, the United States is the last major country in which the degree Fahrenheit temperature scale is used by most lay people, industry, popular meteorology, and government. Despite this, METAR reports from the United States also report the temperature (and dewpoint, see below) in degrees Celsius.
- Dew point is the temperature to which a given parcel of air must be cooled, at constant atmospheric pressure, for water vapor to condense into water. The condensed water is called dew. The dew point is a saturation point. When the dew point temperature falls below freezing it is called the frost point, as the water vapor no longer creates dew but instead creates frost or hoarfrost by deposition. The dew point is associated with relative humidity. A high relative humidity indicates that the dew point is closer to the current air temperature. If the relative humidity is 100%, the dew point is equal to the current temperature. Given a constant dew point, an increase in temperature will lead to a decrease in relative humidity. At a given barometric pressure, independent of temperature, the dew point determines the specific humidity of the air. The dew point is an important statistic for general aviation pilots, as it is used to calculate the likelihood of carburettor icing and fog. When used with the air temperature, a formula can be used to estimate the height of cumuliform, or convective, clouds.
- Wind is determined using anemometers and wind vanes, or aerovanes, located a standard 10 metres (33 ft) above ground level (AGL). Average wind speed is measured using a two-minute average in the United States, and a 10-minute average elsewhere. Wind direction is measured using degrees, with north representing 0 or 360 degrees, with values increasing from 0 clockwise from north. Wind gusts are reported when there is variation of the wind speed of more than 10 knots (5.1 m/s) between peaks and lulls during the sampling period.
- Sea level pressure (SLP) is the pressure at sea level or (when measured at a given elevation on land) the station pressure reduced to sea level assuming an isothermal layer at the station temperature. This is the pressure normally given in weather reports on radio, television, and newspapers or on the Internet. When barometers in the home are set to match the local weather reports, they measure pressure reduced to sea level, not the actual local atmospheric pressure. The reduction to sea level means that the normal range of fluctuations in pressure is the same for everyone. The pressures which are considered high pressure or low pressure do not depend on geographical location. This makes isobars on a weather map meaningful and useful tools.
- Altimeter setting is a term and quantity used in aviation. The regional or local air pressure at mean sea level is called the altimeter setting, and the pressure which will calibrate the altimeter to show the height above ground at a given QNH airfield.
- Present weather, which present restrictions to visibility or presence of thunder or squalls, are reported in observations to indicate to aviation any possible threats during landings and takeoffs from airports. Types included in surface weather observations include precipitation, obscurations, other weather phenomena such as, well-developed dust/sand whirls, squalls, tornadic activity, sandstorms, volcanic ash, and dust storms.
- Intensity of precipitation is primarily measured for meteorological concerns. However, it can be of concern to aviation as heavy precipitation can limit visibility. Also, intensity of freezing rain can determine how hazardous it is for pilots to fly nearby certain locations since it can be an in-flight hazard by depositing ice on the wings of aircraft, which can be detrimental to flight.
- Precipitation amount over the past 1, 3, 6 or 24 hours is of particular interest to meteorologists in verifying forecast amounts of precipitation and determining station climatologies.
- Snowfall amount during the past 6 hours is taken for meteorological and climatological concerns. However, it may also be reported hourly using “SNOINCR” remarks to provide air field technicians information on how frequently snow must be plowed from runways and taxiways.
- Snow depth is measured for meteorological and climatological concerns once a day. However, during periods of snowfall, it is measured each six hours to determine amount of recent snowfall.
______
Land-based observation stations.
About 10,000 land-based weather stations — also known as surface stations — monitor the weather worldwide. In the United States, the National Weather Service coordinates weather observations at about 1,000 land-based stations with information obtained from about 10,000 volunteer weather observers. The Atmospheric Environment Service of Canada operates a similar observation network.
_
The conventional monitoring network is composed of ground stations that cover the measurement of standard weather parameters as seen in figure below.
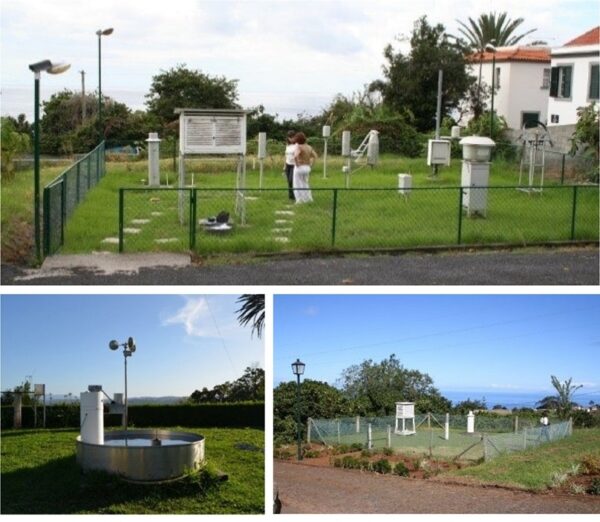
Figure above shows views of meteorological stations from monitoring networks showing several measuring devices.
Observation stations use a variety of instruments to monitor the state of the atmosphere. Weather stations typically have different instruments, for example: thermometer for measuring air and sea surface temperature; barometer for measuring atmospheric pressure; hygrometer for measuring humidity; anemometer for measuring wind speed; pyranometer for measuring solar radiation; rain gauge for measuring liquid precipitation over a period of time; psychrometer for measuring humidity by taking both a wet-bulb and a dry-bulb temperature reading; wind sock for measuring general wind speed and wind direction; wind vane, also called a weather vane or a weathercock, for showing which way the wind is blowing.
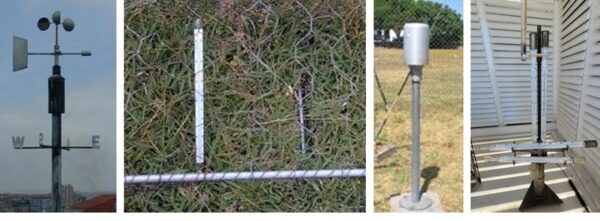
Figure above shows examples of instruments deployed at meteorological station. From left to right: anemometer, grass thermometer, rain gauge, and sheltered, thermometer for maxima and minima temperature (in horizontal position) and psychrometer (in vertical position).
_
Weather stations typically have these following instruments:
- Thermometer for measuring air and sea surface temperature
- Barometer for measuring atmospheric pressure
- Hygrometer for measuring humidity
- Anemometer for measuring wind speed
- Pyranometer for measuring solar radiation
- Rain gauge for measuring liquid precipitation over a set period of time
- Wind sock for measuring general wind speed and wind direction
- Wind vane (also called a weather vane or a weathercock) for showing the wind direction
- Present Weather/Precipitation Identification Sensor for identifying falling precipitation
- Disdrometer for measuring drop size distribution
- Transmissometer for measuring visibility
- Ceilometer for measuring cloud ceiling
__
Weather station parameters:
|
Measured |
Measuring range |
Resolution |
Precision |
|
Humidity |
0~100%RH |
0.1%RH |
±0.5℃ |
|
Temperature |
-40~80℃ |
0.1℃ |
±5%RH |
|
Atmospheric pressure |
10~1200hPa |
0.1hPa |
±1.5hPa |
|
Soil temperature |
-40~80℃ |
0.1℃ |
±0.5℃ |
|
Soil Humidity (moisture) |
0-100%RH |
0.1%RH |
±5%RH |
|
Conductivity |
0-10000us/cm |
1us/cm |
±5% |
|
Wind speed |
0~70m/s |
0.1m/s |
±(0.3+0.03V)m/s |
|
wind direction |
0~360° |
– |
±3° |
|
Illuminance |
0-200000Lux |
– |
±7% |
|
Rainfall |
0-4mm/min |
0.2mm |
±4% |
|
Solar radiation |
0~2000W/m2 |
– |
≤5% |
|
CO2 |
0~2000ppm |
1ppm |
±7% |
|
Supply mode |
220V |
DC12-24V |
solar power optional |
_
The stations of the surface network are scattered across the continents. Each country maintains its own network(s). As far as is possible, the observations are made in sites that are standard in construction and exposure, but are nevertheless representative of the surrounding terrain. However, selected sites vary considerably in altitude, therefore, parameters such as station pressure need to be correct. No attempt is made to correct air temperature for stations’ altitude. All instruments used should be designed to conform to international standards, and operated by staff trained to operate them in a consistent and adequate manner. This guarantees that atmospheric data observed across the world are comparable.
In surface networks, conventional analogue instruments are being replaced, to allow for digital (continuously) recording and data transmission (automatic weather stations). Networks of weather radars are as yet very incomplete and limited. At some stations air quality measurements might also be undertaken.
_______
The upper air network:
Observations of wind, temperature, relative humidity and pressure are made by radiosondes (free-flying balloons released from the upper-air stations of the synoptic network). While in flight, the data are sent by radio to the ground station, and the sonde’s position is monitored by automatically tracking radar. Although these data sampling intervals, in space and time, are much greater in the upper-air network than in the surface network, the fact that the atmospheric structure is much smoother and larger in scale aloft than it is near the surface justifies the interest in this type of data acquisition. The surface heterogeneities generate significantly smaller and more transient structures, especially over land. Radiosondes are currently under active development, which opens new perspectives in this field. Revisiting times and imagery spatial resolution, as well as the multi-spectral and hyperspectral resolution of the sensors have been increasing much in the last few years.
The first meteorological satellite was launched in 1960. Since then, they have multiplied and developed considerably. Meteorological satellites are platforms for electromagnetic scanning of the atmosphere from above (i.e., top-side observations). The scanning can be passive or active. In passive scanning, satellites merely make use of existing radiation emitted or reflected from the atmosphere, without adding to it. The radiometers used are sensitive to one or more wavelength bands, for example, in the visible and infrared ranges. Radiometers that are sensitive in the far infrared are independent of solar radiation and respond instead to the terrestrial radiation emitted continuously by the Earth´s surface and atmosphere. This radiation increases in intensity as the temperature of the emitting materials rise; thus, the resulting imaging has a brightness scale that corresponds to a temperature scale in the original panorama. The brightness scale can be replaced by an arbitrary colour scale for easy of subsequent analysis by eye. At present, satellites are providing complementary data for characterizing the weather; the data spatial and temporal resolutions depend on the source.
Weather radars gather an immense amount of information about the composition and distribution of atmospheric precipitation over an enormous range, up to hundreds of kilometres in radius. Radars detect, in real time, every litre of water content between the ground and a layer 15km above the earth’s surface. They also provide information about the water’s physical state: hail, snow, or liquid. Radars can measure wind speed distribution within its range – air traffic controllers can be advised of adverse gust fronts and wind shear conditions near runways. Radar applications are many, aside from meteorology; civil protection agencies, air traffic safety, irrigation decisions, mitigation of damage in case of floods, cloud seeding for rain and more.
_______
_______
Severe weather:
Severe weather is any dangerous meteorological phenomenon with the potential to cause damage, serious social disruption, or loss of life. These vary depending on the latitude, altitude, topography, and atmospheric conditions. High winds, hail, excessive precipitation, and wildfires are forms and effects, as are thunderstorms, downbursts, tornadoes, waterspouts, tropical cyclones, and extratropical cyclones. Regional and seasonal phenomena include blizzards, snowstorms, ice storms, and dust storms.
The term severe weather is technically not the same phenomenon as extreme weather. Extreme weather describes unusual weather events that are at the extremes of the historical distribution for a given area. Severe weather is one type of extreme weather, which includes unexpected, unusual, severe, or unseasonal weather and is by definition rare for that location or time of the year. Due to the effects of climate change, the frequency and intensity of some of the extreme weather events are increasing, for example, hot airflow direction, heatwaves and droughts.
_
Meteorologists have generally defined severe weather as any aspect of the weather that poses risks to life or property or requires the intervention of authorities. A narrower definition of severe weather is any weather phenomenon relating to severe thunderstorms. According to the World Meteorological Organization (WMO), severe weather can be categorized into two groups: general severe weather and localized severe weather. Nor’easters, European wind storms, and the phenomena that accompany them form over wide geographic areas. These occurrences are classified as general severe weather. Downbursts and tornadoes are more localized and therefore have a more limited geographic effect. These forms of weather are classified as localized severe weather.
_
The NWS divides severe weather alerts into several types of hazardous/hydrologic events:
- Severe local storms – Short-fused, small-scale hazardous weather or hydrologic events produced by thunderstorms (including large hail, damaging winds, tornadoes, and flash floods).
- Winter storms – Weather hazards associated with freezing or frozen precipitation (freezing rain, sleet, and/or snow), or combined effects of winter precipitation and strong winds.
- Fire weather – Weather conditions that contribute to an increased risk and help cause the spread of wildfires.
- Flooding – Hazardous hydrological events resulting in temporary inundation of land areas not normally covered by water, often caused by excessive rainfall.
- Coastal/lakeshore hazards – Hydrological hazards that may affect property, marine or leisure activities in areas near ocean and lake waters including high surf and coastal or lakeshore flooding, as well as rip currents.
- Marine hazards – Hazardous events that may affect marine travel, fishing and shipping interests along large bodies of water, including hazardous seas and freezing spray.
- Tropical cyclone hazards – Hazardous tropical cyclone events that may affect property in inland areas or marine activities in coastal waters, resulting in wind damage, storm surge, tornadoes and flooding rain.
- Non-precipitation hazards – Weather hazards not directly associated with any of the above including extreme heat or cold, dense fog, high winds, and river or lakeshore flooding.
_
Weather Patterns that cause Severe Weather:
There are four main ingredients for severe weather – shear, lift, instability, and moisture. Almost every severe weather outbreak has some combination of these four ingredients.
Shear:
Shear means winds changing speed and/or direction with height. Sometimes this is referred to as vertical wind shear. Shear is important because it separates the updrafts and downdrafts within a thunderstorm so that they are not competing with each other. This allows for stronger updrafts, which are more likely to produce things like tornadoes and large hail. Shear values supportive of severe weather would generally be at least 20 knots between 0 and 6 kilometers above the surface.
Lift:
Lift refers to a sort of mechanism to get the ball rolling when it comes to creating the updraft of a thunderstorm. The most common types of lift are warm and cold fronts. Lift can also be found from stationary fronts and dry lines. Sometimes during summertime thunderstorms, lift can simply come from a very hot surface due to daytime heating.
Instability:
Instability means how likely the atmosphere is to support thunderstorm development once there is initial lift. If lift is pushing a ball off a hill, instability is the height of the hill. In other words, instability is a measure of how much updrafts will continue once given a little push by a lifting mechanism. Instability is commonly measured with a variable called CAPE (Convective Available Potential Energy). CAPE can be measured with weather balloons that are launched across the United States by the National Weather Service twice a day. There are many other variables that can be used to measure instability, but CAPE is the most widely used and understood. Typical severe thunderstorms have CAPE values of at least 500 joules per kilogram (J/kg). The most impactful severe weather events can have CAPE values exceeding 5,000 J/kg.
Moisture:
Moisture is pretty self-explanatory – it is how much water vapor is in the air. This moisture is needed to condense the water vapor into clouds and precipitation. When an updraft occurs, the water vapor wants to condense out of the air at higher altitudes. This leads to the formation of clouds and thunderstorms. The most well known way to approximate moisture is relative humidity, which is a percentage of how much water vapor is currently in the air, compared to how much total water vapor the air can physically support. However, relative humidity does not actually measure how much water vapor is in the air. Instead, meteorologists often use the “dew point” temperature to measure the liquid water vapor content of the air. Dew point temperature refers to the temperature at which water vapor would be forced out of the air in order for temperatures to cool further, which is how dew forms in the early morning hours. It really depends on the environment, but severe thunderstorms typically have dew point temperatures over 50 degrees Fahrenheit.
Other Considerations:
There are many other factors to consider when forecasting a severe weather event. One other important factor is the jet stream. Typically, a strong jet stream, which leads to greater shear, is necessary to dynamically support strong thunderstorms. Some orientations of the jet stream are more favorable than others for thunderstorm development.
__________
Severe Storms:
As baseline temperatures rise, the threat of severe storms increases. Warmer air holds more moisture, enabling stronger thunderstorm events and impacting more communities as developments push into storm-threatened regions.
A severe storm produces wind gusts of at least 58 mph, hail one inch or larger in diameter, and/or tornadic activity. Flash flooding is also associated with severe storm threats. There are about 100,000 thunderstorms each year in the US. About 10% of these reach severe levels.
Thunderstorms form when warm, moist air rises into cold air and condenses into a rain event with lightning occurring from within the cumulonimbus cloud (a.k.a anvil clouds). Thunder comes from lightning, so, all thunderstorms have lightning as a convective feature. Lightning occurs as the negative charges (electrons) in the bottom of the cloud are attracted to the positive charges (protons) on the ground. Temperatures in the air of a lightning channel may reach as high as 50,000 °F, five times hotter than the sun.
Hail forms when raindrops are carried upward by thunderstorm updrafts into extremely cold areas of the atmosphere and freeze. Hailstones grow by colliding with liquid water freezing onto the hail. With rising baseline temperatures due to extreme weather, smaller hail pellets begin to melt before reaching the surface causing larger hailstones to become the main hail event as extreme weather progresses.
Tornadoes are narrow, violently rotating columns of air that extend from the base of a thunderstorm to the ground. About 1,200 tornadoes occur in the US annually although recent years have been overactive.
Damaging Winds are often called “straight-line” winds to differentiate the damage they cause from tornado damage. Damaging Wind Gusts range between 58 mph and 74 mph (between 50 knots and 64 knots) causing minor damage. Very Damaging Wind Gusts range between 75 mph and 91 mph (between 65 knots and 79 knots) causing moderate damage.
A weather hole is a location that receives calmer weather than the surrounding area. It is an area thunderstorms often miss, or near which approaching storms often dissipate.
_
Cloudburst:
A cloudburst is an extreme amount of precipitation in a short period of time, sometimes accompanied by hail and thunder, which is capable of creating flood conditions. Cloudbursts can dump enormous amounts of water in less than 5 minutes; for example – 25 mm of precipitation falling on one square kilometre, corresponding to 25,000 metric tons of water. This readily generates flood conditions. However, cloudbursts are infrequent as they occur only via orographic lift or occasionally when a warm air parcel mixes with cooler air, resulting in sudden condensation. At times, a large amount of runoff from higher elevations is mistakenly conflated with a cloudburst. The term “cloudburst” arose from the notion that clouds were akin to water balloons and could burst, resulting in rapid precipitation. Though this idea has since been disproven, the term remains in use.
_
Flash flooding:
Flash flooding is the process where a landscape, most notably an urban environment, is subjected to rapid floods. These rapid floods occur more quickly and are more localized than seasonal river flooding or areal flooding and are frequently (though not always) associated with intense rainfall. Flash flooding can frequently occur in slow-moving thunderstorms and is usually caused by the heavy liquid precipitation that accompanies it. Flash floods are most common in densely populated urban environments, where few plants and bodies of water are present to absorb and contain the extra water. Flash flooding can be hazardous to small infrastructure, such as bridges, and weakly constructed buildings. Plants and crops in agricultural areas can be destroyed and devastated by the force of raging water. Automobiles parked within affected areas can also be displaced. Soil erosion can occur as well, exposing risks of landslide phenomenon.
______
Western disturbances:
The extratropical storm that originates in the Mediterranean region which brings sudden winter rain to the north-western parts of the Indian sub-continent is known as Western Disturbance. It is a non-monsoonal precipitation pattern which is driven by the westerlies. This may happen during any season, not necessarily in monsoon. These extratropical storms are a global phenomenon. This phenomenon usually carries moisture in the upper layer of the atmosphere, unlike their tropical counterparts where the moisture is carried in the lower layer of atmosphere. In the case of the Indian subcontinent, moisture is sometimes shed as rain when the storm system encounters the Himalayas or Himalayan region.
______
Tropical cyclones:
Tropical cyclones are also called hurricanes or typhoons, depending on the region. A tropical cyclone is a rapidly rotating storm that begins over tropical oceans, and they can vary in speed, size, and intensity. Tropical cyclones are the second-most dangerous natural hazards, after earthquakes. Tropical cyclones represented 17% of weather-, climate- and water related disasters and were responsible for one third of both deaths (38%) and economic losses (38%) over the 50-year period.
A tropical cyclone is a rapidly rotating storm system with a low-pressure area, a closed low-level atmospheric circulation, strong winds, and a spiral arrangement of thunderstorms that produce heavy rain and squalls.
Tropical cyclones typically form over large bodies of relatively warm water. They derive their energy through the evaporation of water from the ocean surface, which ultimately condenses into clouds and rain when moist air rises and cools to saturation. This energy source differs from that of mid-latitude cyclonic storms, such as nor’easters and European windstorms, which are powered primarily by horizontal temperature contrasts. Tropical cyclones are typically between 100 and 2,000 km (62 and 1,243 mi) in diameter. The strong rotating winds of a tropical cyclone are a result of the conservation of angular momentum imparted by the Earth’s rotation as air flows inwards toward the axis of rotation. As a result, cyclones rarely form within 5° of the equator.
The thermodynamic behavior of a hurricane can be modelled as a heat engine that operates between the heat reservoir of the sea at a temperature of about 300K (27 °C) and the heat sink of the tropopause at a temperature of about 200K (−72 °C) and in the process converts heat energy into mechanical energy of winds. Parcels of air traveling close to the sea surface take up heat and water vapor, the warmed air rises and expands and cools as it does to cause condensation and precipitation. The rising air, and condensation, produces circulatory winds that are propelled by the Coriolis force, which whip up waves and increase the amount of warm moist air that powers the cyclone. Both a decreasing temperature in the upper troposphere or an increasing temperature of the atmosphere close to the surface will increase the maximum winds observed in hurricanes. When applied to hurricane dynamics it defines a Carnot heat engine cycle and predicts maximum hurricane intensity. A mature tropical cyclone operates as a Carnot heat engine, turning heat from warm ocean water into the powerful kinetic energy of high-speed winds.
_______
_____ __
Weather versus climate:
Weather is what you experience when you step outside on any given day. In other words, it is the state of the atmosphere at a particular location over the short-term. Climate is the average of the weather patterns in a location over a longer period of time, usually 30 years or more. Weather can change quickly, from one moment to the next and over short distances. It can be raining one minute, and snowing the next. It can be pouring on one side of town and sunny on the other. Climate, on the other hand, changes more slowly. That’s why we come to expect, for example, that the Northeast will be cold and snowy in January and that the South will be hot and humid in July. Also, climate generally doesn’t vary much over short distances, except in the mountains. Climate is about the long term. It’s about using the weather data we collected in the past to look for long-term trends of 30 years or more. It also about applying the best science we have today to predict changes that may occur in the ocean and atmosphere in the future.
_
Worldwide, scientists observe weather conditions at thousands of stations every day of the year. Some observations are made hourly, others just once a day. Over time, these observations allow us to define what’s normal at each location. Scientists calculate averages of daily weather conditions, such as average temperature, precipitation, humidity, and wind speed, to describe climate.
When scientists talk about climate, they’re talking about the averages of measurable things like land or sea temperature, amount of rainfall, date of the first frost, amount of sea ice melt, or sea level, etc. often over long timespans of 30 years or more.
In many locations around the United States, weather and climate records have been kept for more than 140 years. These long-term records enable scientists to detect climate patterns and trends.
_
Climate describes average weather conditions over longer periods and over large areas. This is the average weather conditions in a particular location based on the average weather experienced there over 30 years or more. Climate refers to what is expected to happen in the atmosphere rather than the actual conditions. It is possible for the weather to be different from that suggested by the climate.
The world can be divided into different climatic zones that share similar climates. These are shown in the map below.
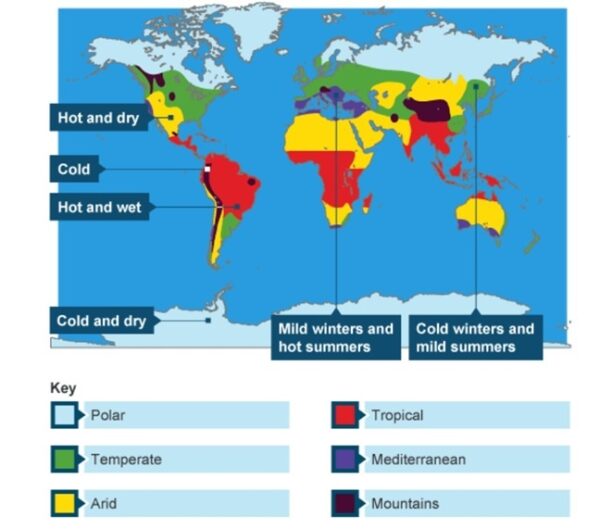
_
Despite their differences, weather and climate are interlinked. As with weather, climate takes into account precipitation, wind speed and direction, humidity, and temperature. In fact, climate can be thought of as an average of weather conditions over time. More importantly, a change in climate can lead to changes in weather patterns.
Climate conditions vary between different regions of the world and influence the types of plants and animals that live there. For example, the Antarctic has a polar climate with subzero temperatures, violent winds, and some of the driest conditions on Earth. The organisms that live there are highly adapted to survive the extreme environment.
By contrast, the Amazon rainforest enjoys a tropical climate. Temperatures are consistently warm with high humidity, plenty of rainfall, and a lack of clearly defined seasons. These stable conditions support a very high diversity of plant and animal species, many of which are found nowhere else in the world.
_
The terms climate change and global warming are often used interchangeably. Is there a difference between the two? To scientists there is, but in general, everyday conversation, people use both.
Climate change refers to any significant change in the measures of climate for extended periods of time, usually over decades or longer. This includes major, long-term changes in temperature, precipitation, humidity, ocean heat, wind patterns, sea level, sea ice extent, and other factors, and how these changes affect life on Earth.
Climate change results from both human activities and natural causes. Human activities include the emission of heat-trapping greenhouse gases, such as carbon dioxide, into the atmosphere and changes in land-use patterns, such as agriculture and urbanization. Natural causes range from regular pattern shifts in the dynamics of our oceans and atmosphere, such as El Niño/ La Niña, to volcanic eruptions that emit various gasses and aerosols in the atmosphere, to long-term changes in the Earth’s orbit around the sun, to variations in the amount of energy from the Sun that reaches Earth.
Global warming is one aspect of climate change. Specifically, it relates to the recent and ongoing rise in global average temperatures near Earth’s surface (land, ocean or both). Over the last 50 years, global warming has primarily been due to the increase of heat-trapping pollutants, called greenhouse gases, that humans are adding to the atmosphere primarily by burning fossil fuels. The current increase in global average temperature appears to be occurring much faster than at any point in the last 11,000 years. Global warming is causing climate patterns to change. However, it is only one aspect of climate change.
__
Global warming alters weather patterns by increasing atmospheric moisture and destabilizing major wind currents, which drives more extreme storms, prolonged droughts, and severe heatwaves. Warmer air holds more water vapor. For every degree Celsius the planet warms, the air holds about 7% more moisture. This extra moisture feeds storm systems, causing heavy rain and sudden floods in many regions. Higher temperatures pull moisture from soils and plants at a faster rate. Dry soil heats up faster than wet soil, making heatwaves hotter and droughts last much longer. Global warming reduces the temperature gap between the Arctic and the equator, causing the jet stream to slow down. A slow jet stream makes weather systems linger in one place for days or weeks. This turns normal weather into extreme, prolonged floods or dry spells. Oceans absorb most of the extra heat trapped by greenhouse gases. Warm ocean water acts as fuel for tropical storms. Hurricanes can grow stronger, faster, and drop much more rain than they did in the past.
_
Scales of climate and their importance:
(1) Microclimate:
Microclimate deals with the climatic features specific to small areas and with the physical processes that take place in the layer of air very near to the ground. Soil-ground conditions, character of vegetation cover, aspect of slopes, and state of the soil surface, relief forms – all these may create special local conditions of temperature, humidity, wind and radiation in the layer of air near the ground which differ sharply from general climatic conditions. One of the most important tasks of agricultural meteorology is to study the properties of air near the ground and surface layer of soil, which falls under the micro climate.
(2) Meso climate:
The scale of meso climate falls between micro and macro climates. It is concerned with the study of climate over relatively smaller areas between 10 & 100 km across.
(3) Macro climate:
Macro climate deals with the study of atmosphere over large areas of the earth and with the large scale atmospheric motions that cause weather.
______
______
Natural climate change and its impact on weather: El Nino and La Nina:
Weather hazards such as heavy rain and typhoons are regional, but they are still shaped by the larger global circulation. El Niño and La Niña are the warm and cool phases of a natural climate pattern across the tropical Pacific known as the El Niño-Southern Oscillation, or “ENSO” for short. The pattern shifts back and forth irregularly every two to seven years, bringing predictable changes in ocean temperature and disrupting the normal wind and rainfall patterns across the tropics. These changes in the seasonal climate of the world’s biggest ocean have a cascade of global side effects. El Niño is characterized by unusually warm ocean temperatures in the central and eastern Pacific, as opposed to La Niña, which is characterized by unusually cold ocean temperatures in the central and eastern Pacific. El Niño is an oscillation of the ocean-atmosphere system in the tropical Pacific having important consequences for weather around the globe. Among these consequences are increased rainfall across the southern tier of the US and in Peru, which has caused destructive flooding, and drought in the West Pacific, sometimes associated with devastating brush fires in Australia. Observations of conditions in the tropical Pacific are considered essential for the prediction of short term (a few months to 1 year) climate variations.
_
El Niño and La Niña are opposite phases of a natural climate cycle called the El Niño-Southern Oscillation (ENSO) that alters ocean temperatures and wind patterns across the Pacific Ocean. The El Niño–Southern Oscillation is a single climate phenomenon that recurs in three phases: Neutral, La Niña or El Niño. La Niña and El Niño are opposite phases in the oscillation which are deemed to occur when specific ocean and atmospheric conditions are reached or exceeded.
An early recorded mention of the term “El Niño” (“The little Boy” in Spanish) to refer to climate occurred in 1892, when Captain Camilo Carrillo told the geographical society congress in Lima that Peruvian sailors named the warm south-flowing current “El Niño”, referring to the Christ Child, because it was most noticeable around Christmas. Over time the term has evolved and now refers to the warm and negative phase of the El Niño–Southern Oscillation (ENSO). La Niña (“The little Girl” in Spanish) is the colder counterpart of El Niño, as part of the broader ENSO climate pattern. A negative phase exists when atmospheric pressure over Indonesia and the West Pacific is abnormally high and pressure over the East Pacific is abnormally low during El Niño episodes, and a positive phase is when the opposite occurs during La Niña episodes.
_
Diagram below shows a cross-section of the Pacific and related phenomena:
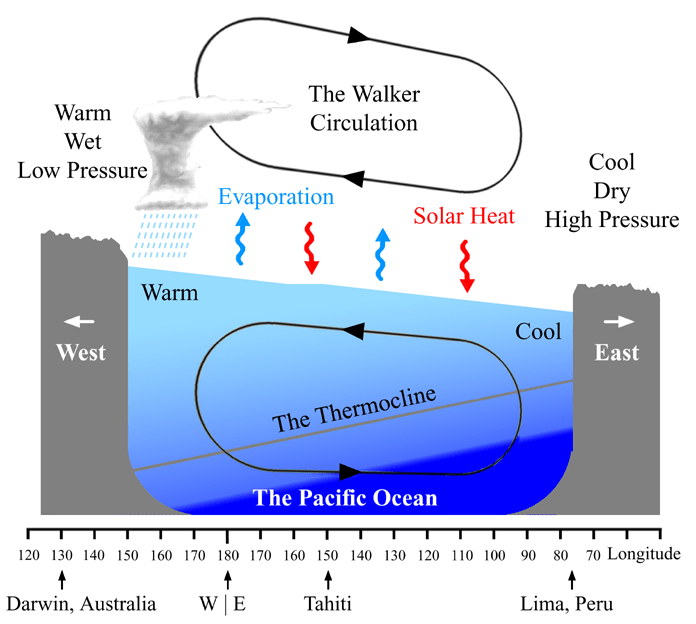
The West Pacific is typically warmer than the East Pacific. The warmer water in the West Pacific leads to: more clouds, more rainfall, and a lower air pressure. The buildup of warm waters towards the west also leads to a thicker layer of warm ocean water that lowers the depth of the thermocline. A thermocline is the transition layer in a large body of water—like an ocean or deep lake—where the water temperature changes rapidly with depth, separating warm surface water from cold deep water.
On average, the temperature of the ocean surface in the tropical East Pacific is roughly 8–10 °C (14–18 °F) cooler than in the tropical West Pacific. The sea surface temperature (SST) of the West Pacific northeast of Australia averages around 28–30 °C (82–86 °F). SSTs in the East Pacific off the western coast of South America are closer to 20 °C (68 °F).
Strong trade winds near the equator drive water away from the East Pacific and into the West Pacific. This water is slowly warmed by the Sun as it moves west along the equator, the wind stress acting on the ocean surface being balanced by a sea surface slope. One result of this is that sea levels near Indonesia are typically around 0.5 m (1.5 ft) higher than that near Peru.
The warm surface waters collect in the western Pacific, with the result that the thermocline, the transitional zone between the warmer waters near the ocean surface and the cooler waters of the deep ocean, lies much deeper in the western Pacific, where it has an average depth of around 140 m (450 ft) compared to around 30 m (90 ft) in the East Pacific. At depth, the sloping surface thermocline helps reduce the east–west pressure difference due to the sea level slope, but below the thermocline, the pressure difference is still enough to drive the eastward flowing cold equatorial undercurrent.
The cooler deep ocean water replaces the outgoing surface waters in the East Pacific, rising to the ocean surface in a process called upwelling. Along the western coast of South America, water near the ocean surface is pushed westward due to the combination of the trade winds and the Coriolis effect. This process is known as Ekman transport. Colder water from deeper in the ocean rises along the continental margin to replace the near-surface water.
This process cools the East Pacific because the thermocline is closer to the ocean surface, leaving relatively little separation between the deeper cold water and the ocean surface. The northward-flowing Humboldt Current carries colder water from the Southern Ocean to the tropics in the East Pacific. The combination of the Humboldt Current and upwelling maintains an area of cooler ocean waters off the coast of Peru.
The West Pacific lacks a cold ocean current and has less upwelling as the trade winds are usually weaker than in the East Pacific, allowing the West Pacific to reach higher temperatures. These warmer waters provide energy for the upward movement of air. As a result, the warm West Pacific has, on average, more cloud and rain than the cool East Pacific.
_
ENSO describes a quasi-periodic change of both oceanic and atmospheric conditions over the tropical Pacific Ocean. These changes affect weather patterns across much of the Earth. The tropical Pacific is said to be in one of three states of ENSO (also called “phases”) depending on the atmospheric and oceanic conditions. When the tropical Pacific roughly reflects the average conditions, the state of ENSO is said to be in the neutral phase. However, the tropical Pacific experiences occasional shifts away from these average conditions.
If the trade winds (blowing from east to west) are weaker than average, then both the upwelling in the East Pacific and the flow of warmer ocean surface waters towards the West Pacific lessen. This results in a cooler West Pacific and a warmer East Pacific, leading to a shift of cloud and rain towards the East Pacific. This situation is called El Niño. The opposite occurs if trade winds are stronger than average, leading to a warmer West Pacific and a cooler East Pacific. This situation is called La Niña and is associated with increased cloudiness and rainfall over the West Pacific.
_______
El Niño:
The term El Niño comes from Spanish, meaning “Christ Child”. Peruvian fishermen used this term to describe the phenomenon of abnormal sea temperature and ocean current changes in sea areas near the tropical Pacific region during Christmas time.
Under normal climate conditions, the atmospheric pressure of the east Pacific is higher than the west. This difference of atmospheric pressure generates the tropical easterlies and drives the east Pacific Ocean current westward. After the westbound ocean currents are heated by the sun they will gather in the central and western Pacific. In the east Pacific, the low temperature sea water in the deep ocean will flow up to replace the westbound ocean currents. This upwelling current is rich in nutrients, and therefore will attract a lot of fish. This is the cause behind the booming success of the fishery industry in Peru and other nations in the region. The excrement from sea birds accumulated here while looking for the fish also serves as a main source of fertilizer for the agricultural industries in the region.
_
During El Niño, the atmospheric pressure in the east Pacific lowers while the pressure in the west increases. This sudden difference in atmospheric pressure reduces the strength of the Tropical easterlies even turning them into westerlies. The ocean current of the east Pacific will therefore no longer flow west, but rather east and collect in the eastern Pacific region after temperatures have risen by heating from the sun. This in turn results in higher east Pacific temperature and lower temperatures in the west. The warmer sea water in the east Pacific prevents the deep sea water in the area from rising. As a result the number of fish in the current is also reduced and with it the number of sea birds, creating substantial damage to both the fishing and agricultural industries in the region.
_
The characteristics of El Niño are a reverse of sea temperature differences between the east and west Pacific. An accompanying effect to the atmosphere is the east-west oscillation of the pressure fields. When the sea temperature is higher in the east Pacific, the pressure of the atmosphere will be higher in the west. Conversely if the sea temperature is higher in the west, then the atmospheric pressure will be higher in the east. Since meteorologists indicate the difference of these two atmospheric pressures by measuring the pressures at Tahiti in the south Pacific and Darwin in Australia, they call this oscillation of pressure fields “Southern Oscillation”. Since El Niño and Southern Oscillation are closely interrelated atmospheric and oceanic phenomena, they are sometimes abbreviated as ENSO.
_
The process of abnormal climate changes caused by El Niño can be explained by the following simple physical process. When sea temperature rises, it heats up the atmosphere like the fire in a stove heating up water in a pot. During El Niño, when the sea temperature of the east Pacific rises abnormally, the atmosphere above the ocean surface will be heated by the water vapor from the ocean and the air flows upward. After the effects of convection it will become clouds and rain. To balance the rising effect in the east Pacific region, the air in the west Pacific region with lowered sea temperature will therefore flows downward, increasing the air pressure at the ground surface and therefore suppressing rain. The effects the changes of climate during an El Niño can be summarized as follows: The increase of sea temperature, the rise of air and the reduction of ground surface pressure in the east Pacific region, will increase the chances of rain and of floods. In the west Pacific the situation is reversed, which can result in droughts especially in Indonesia, the Philippines, and north Australia.
_
El Niño phenomenon takes place once every two to seven years. El Niño usually has a life span of 1.5 to 2 years, which is divided into an early stage, mature stage, and decay stage. El Niño in 1982-83 created the greatest difference of sea temperature and caused the most serious damage. According to estimation, the droughts and fires induced which occurred in this period in South Asian countries and Australia caused a total damage of US$3.5 billion. On the other hand, the floods also caused American countries in the eastern Pacific region US$2.5 billion in damage. These are by no means small damage. Due to the severe damage El Niño can cause to human life and property, weather centers in the world are all devoting themselves to El Niño-related research.
_______
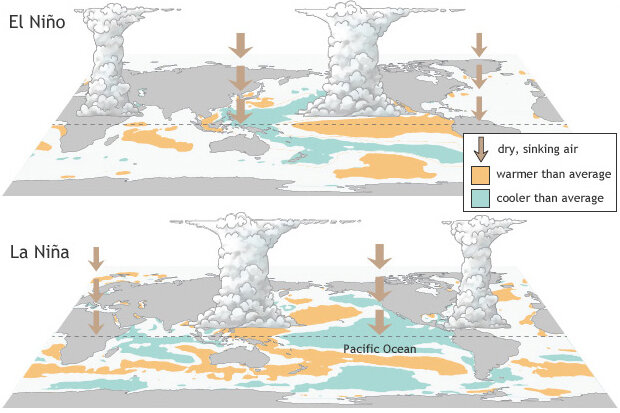
Figure above shows schematic diagram depicting the large-scale atmospheric effects of El Niño and La Niña. The diagram shows how El Niño shifts the primary region of deep tropical thunderstorm activity well eastward across the basin, which is the primary mechanism through which it alters global weather patterns.
_______
La Niña:
La Niña, the comparative term for El Niño, originates from Spanish, meaning baby girl. Both El Niño and La Niña refer to the abnormal changes of sea temperature and ocean current in the eastern Pacific region. The observation area is within 5° N and 5° S, and 90° to 150° W (Niño 3 region). A five month moving average of sea temperature is used in the calculation. If the result is 0.5 °C higher than the climate mean, then an El Niño phenomenon is regarded to exist. If the temperature is 0.5 °C lower than the climate mean, a La Niña phenomenon is regarded to exist. Under normal climate conditions, the atmospheric pressure of the east tropical Pacific is higher than that of the west; this difference of pressure generates the easterlies and leads the east Pacific current west. During the La Niña, the normal east-west sea temperature difference is enlarged and therefore enhanced as mentioned. Since the change of sea temperature is one of the major factors of climate changes, during El Niño the world will experience abnormal cool summers and warm winters, and during La Niña, hotter summers and colder winters.
______
______
Section-4
Meteorology:
Meteorology is the scientific study of the Earth’s atmosphere and the physical processes that produce weather and short-term atmospheric phenomena. It primarily investigates variables like temperature, humidity, and atmospheric pressure to observe, explain, and forecast day-to-day weather conditions. Meteorology relies heavily on the principles of physics and chemistry to model atmospheric motions and phenomena. While meteorology focuses on short-term atmospheric states (like a daily forecast or an approaching storm), climatology studies long-term weather patterns and trends spanning decades or centuries.
_
Meteorology is the science of weather. It is essentially an inter-disciplinary science because the atmosphere, land and ocean constitute an integrated system. The three basic aspects of meteorology are observation, understanding and prediction of weather. There are many kinds of routine meteorological observations. Some of them are made with simple instruments like the thermometer for measuring temperature or the anemometer for recording wind speed. The observing techniques have become increasingly complex in recent years and satellites have now made it possible to monitor the weather globally. Countries around the world exchange the weather observations through fast telecommunications channels. These are plotted on weather charts and analysed by professional meteorologists at forecasting centres. Weather forecasts are then made with the help of modern computers and supercomputers. Weather information and forecasts are of vital importance to many activities like agriculture, aviation, shipping, fisheries, tourism, defence, industrial projects, water management and disaster mitigation. Recent advances in satellite and computer technology have led to significant progress in meteorology. Our knowledge of the weather is, however, still incomplete.
_
Meteorology is the scientific study of the atmosphere: its structure, composition, physical processes, and the phenomena that arise from them (weather and climate). It explains how and why atmospheric conditions change over time and space, and it develops methods to observe, analyze, model, and predict those changes.
Core components:
- Atmospheric structure: vertical layers (troposphere, stratosphere, etc.), temperature and pressure profiles, and composition (gases, aerosols, water vapor).
- Thermodynamics and radiation: heat transfer, radiative balance, phase changes of water (evaporation, condensation, freezing) that drive cloud and precipitation processes.
- Dynamics: fluid mechanics applied to the atmosphere—winds, turbulence, cyclones, anticyclones, jet streams, waves (Rossby, gravity), and general circulation.
- Microphysics: formation and behavior of cloud droplets, ice crystals, and precipitation particles.
- Chemistry and aerosols: gaseous chemistry (ozone, pollutants), interactions between aerosols and clouds, and their impact on radiation and air quality.
- Observations and instrumentation: surface stations, radiosondes, radar, satellites, lidar, buoys, aircraft measurements, and remote-sensing retrievals.
- Numerical weather prediction (NWP): mathematical models that solve the governing equations (Navier–Stokes, thermodynamic and continuity equations) on computers to forecast weather; includes data assimilation to incorporate observations.
- Climate science overlap: long-term statistics of weather, climate variability (ENSO, NAO), and climate change driven by natural and anthropogenic forcings.
Applications:
- Short-term weather forecasting (hours to weeks).
- Severe weather warnings (thunderstorms, tornadoes, hurricanes, blizzards).
- Aviation, marine, and road transport planning.
- Hydrology and flood forecasting.
- Agriculture, energy (wind and solar resource forecasting), and urban planning.
- Air quality management and climate impact assessments.
_
The term “meteorology” originates from the ancient Greek word meteōron, which translates to “a thing high up,” combined with logia, meaning “the study of”. In ancient times, the term meteor was used to describe any phenomenon observed high up in the sky or falling from it—including rain, snow, clouds, and shooting stars.
The word was firmly established around 340 B.C.E. when the Greek philosopher Aristotle wrote a treatise titled Meteorologica. This monumental work consolidated all the knowledge of the time regarding weather, climate, and atmospheric phenomena. As scientific knowledge advanced over the centuries, the study of the Earth’s atmosphere kept the historical name “meteorology,” while the study of extraterrestrial burning space rocks officially became known as “meteoritics. Despite this division, the historical term survives in modern atmospheric sciences, and weather phenomena are still technically classified into different types of “meteors,” such as hydrometeors (rain and snow), electrometeors (lightning), and photometeors (haloes and rainbows).
_
Atmospheric sciences is an umbrella term for the study of the atmosphere, its processes, and its interactions with the Earth’s hydrosphere (water), lithosphere (earth), and biosphere (all living things). Meteorology is one sub-field of atmospheric science. Climatology, the study of atmospheric changes that define climates over time, is another. Not only does meteorology look at how the atmosphere behaves, it also deals with the chemistry of the atmosphere (the gases and particles in it), the physics of the atmosphere (its fluid motion and the forces that act upon it), and weather forecasting. Meteorology is a physical science — a branch of natural science that tries to explain and predict nature’s behavior based on empirical evidence, or observation. A person who studies or practices meteorology professionally is known as a meteorologist.
_
Meteorologists study meteorological phenomena driven by solar radiation, Earth’s rotation, ocean currents, and other factors. These include everyday weather like clouds, precipitation, and wind patterns, as well as severe weather events such as tropical cyclones and severe winter storms. Such phenomena are quantified using variables like temperature, pressure, and humidity, which are then used to forecast weather at local (microscale), regional (mesoscale and synoptic scale), and global scales. Meteorologists collect data using basic instruments like thermometers, barometers, and weather vanes (for surface-level measurements), alongside advanced tools like weather satellites, balloons, reconnaissance aircraft, buoys, and radars. The World Meteorological Organization (WMO) ensures international standardization of meteorological research.
_
The study of meteorology dates back millennia. Ancient civilizations tried to predict weather through folklore, astrology, and religious rituals. Aristotle’s treatise Meteorologica sums up early observations of the field, which advanced little during early medieval times but experienced a resurgence during the Renaissance, when Alhazen and René Descartes challenged Aristotelian theories, emphasizing scientific methods. In the 18th century, accurate measurement tools (e.g., barometer and thermometer) were developed, and the first meteorological society was founded. In the 19th century, telegraph-based weather observation networks were formed across broad regions. In the 20th century, numerical weather prediction (NWP), coupled with advanced satellite and radar technology, introduced sophisticated forecasting models. Later, computers revolutionized forecasting by processing vast datasets in real time and automatically solving modeling equations. 21st-century meteorology is highly accurate and driven by big data and supercomputing. It is adopting innovations like machine learning, ensemble forecasting, and high-resolution global climate modeling. Climate change–induced extreme weather poses new challenges for forecasting and research, while inherent uncertainty remains because of the atmosphere’s chaotic nature (see butterfly effect).
_
People, animals, pests, insects, and microorganisms, plants, trees, forests, and marine life all experience effects from the atmosphere during various stages of their life cycles, Therefore, meteorology clearly plays a significant role in all facets of contemporary human life. There is a plethora of applications for meteorology. Weather forecasting, aviation meteorology, agricultural meteorology, hydrometeorology, military meteorology, nuclear meteorology, and maritime meteorology are among the disciplines of meteorology.
_______
_______
Branches of meteorology:
Synoptic meteorology:
Weather observations, taken on the ground or on ships, and in the upper atmosphere with the help of balloon soundings, represent the state of the atmosphere at a given time. When the data are plotted on a weather map, we get a synoptic view of the worlds weather. Hence day-to-day analysis and forecasting of weather has come to be known as synoptic meteorology. It is the study of the movement of low pressure areas, air masses, fronts, and other weather systems like depressions and tropical cyclones.
Dynamic meteorology:
This particular branch of meteorology attempts to describe the atmospheric processes through mathematical equations which together are called a numerical model. After defining the initial state of the atmosphere and ocean, the equations are solved to derive a final state, thus enabling a weather prediction to be made. Dynamic meteorology deals with a wide range of hydrodynamical equations from a global scale to small turbulent eddies. The process of solving the equations is very complicated and requires powerful computers to accomplish.
Physical meteorology:
In physical meteorology we study the physical processes of the atmosphere, such as solar radiation, its absorption and scattering in the earth-atmosphere system, the radiation back to space and the transformation of solar energy into kinetic energy of air. Cloud physics and the study of rain processes are a part of physical meteorology.
Agricultural meteorology:
In simple terms, agricultural meteorology is the application of meteorological information and data for the enhancement of crop yields and reduction of crop losses because of adverse weather. This has linkages with forestry, horticulture and animal husbandry. The agrometeorologist requires not only a sound knowledge of meteorology, but also of agronomy, plant physiology and plant and animal pathology, in addition to common agricultural practices. This branch of meteorology is of particular relevance to India because of the high dependence of their agriculture on monsoon rainfall which has its own vagaries.
Applied meteorology:
Like agriculture, there are many human activities which are affected by weather and for which meteorologists can provide valuable inputs. Applied meteorologists use weather information and adopt the findings of theoretical research to suit a specific application; for example, design of aircraft, control of air pollution, architectural design, urban planning, exploitation of solar and wind energy, air-conditioning, development of tour.
Aviation meteorology:
Aviation meteorology deals with the impact of weather on air traffic management and flight operations. It is important for aircrews to understand meteorological conditions affecting flight planning and in-flight safety. Weather phenomena such as turbulence, icing, thunderstorms, and reduced visibility are major hazards to aviation and are included in standardized pilot training syllabi worldwide.
Hydrometeorology:
Hydrometeorology is the branch of meteorology that deals with the hydrologic cycle, the water budget, and the rainfall statistics of storms. A hydrometeorologist prepares and issues forecasts of accumulating (quantitative) precipitation, heavy rain, heavy snow, and highlights areas with the potential for flash flooding.
Nuclear meteorology:
Nuclear meteorology investigates the distribution of radioactive aerosols and gases in the atmosphere.
Maritime meteorology:
Maritime meteorology deals with air and wave forecasts for ships operating at sea. Organizations such as the Ocean Prediction Center, Honolulu National Weather Service forecast office, United Kingdom Met Office, KNMI and JMA prepare high seas forecasts for the world’s oceans.
Military meteorology:
Military meteorology is the research and application of meteorology for military purposes.
Environmental meteorology:
Environmental meteorology mainly analyzes industrial pollution dispersion physically and chemically based on meteorological parameters such as temperature, humidity, wind, and various weather conditions.
Renewable energy:
Meteorology applications in renewable energy includes basic research, “exploration”, and potential mapping of wind power and solar radiation for wind and solar energy.
_______
_______
Scales of meteorology:
The study of the atmosphere can be divided into distinct areas that depend on both time and spatial scales. At one extreme of this scale is climatology. In the timescales of hours to days, meteorology separates into micro-, meso-, synoptic and global scale meteorology. Respectively, the geospatial size of each of these three scales relates directly to the appropriate timescale.
Scales of Atmospheric Motion Systems:
|
Scales of Atmospheric Motion Systems |
|
|
Type of motion |
Horizontal scale (meter) |
|
Molecular mean free path |
10−7 |
|
Minute turbulent eddies |
10−2 – 10−1 |
|
Small eddies |
10−1 – 1 |
|
Dust devils |
1–10 |
|
Gusts |
10 – 102 |
|
Tornadoes |
102 |
|
Cumulonimbus clouds |
103 |
|
Fronts, squall lines |
104 – 105 |
|
Hurricanes |
105 |
|
Synoptic Cyclones |
106 |
|
Planetary waves |
107 |
______
Meteorology categorizes weather and atmospheric phenomena into four primary scales of space and time:
- Microscale:
The smallest scale, spanning a few centimeters to a kilometer, lasting from seconds to minutes. It involves localized features like:
-Wind gusts
-Dust devils
-Small-scale turbulence and eddies
- Mesoscale:
Medium-sized systems ranging from a few kilometers to several hundred kilometers, typically lasting from minutes to hours. Examples include:
-Thunderstorms and squall lines
-Tornadoes
-Land and sea breezes
- Synoptic Scale:
Large-scale weather patterns covering hundreds to thousands of kilometers, lasting for days to a week. This is the scale most common on traditional weather maps, including:
-Mid-latitude cyclones and anticyclones
-Weather fronts
-Large-scale air masses
- Global (Planetary) Scale:
The largest scale, encompassing atmospheric phenomena that span tens of thousands of kilometers and last for weeks or longer. These determine broader planetary weather patterns, such as:
-Jet streams
-Trade winds
-Planetary and Rossby waves
_______
_______
Weather instruments:
Weather instruments are specialized tools designed to measure and record various atmospheric conditions. These devices play a crucial role in meteorology, providing accurate data on temperature, humidity, air pressure, wind speed, and precipitation. By collecting precise measurements, weather instruments enable meteorologists to analyze current conditions, track patterns, and make informed predictions about future weather events. Each instrument serves a specific purpose, capturing data on different aspects of weather such as temperature, humidity, air pressure, wind speed, and precipitation. By utilizing a combination of ground-based and airborne instruments, meteorologists can gather real-time data and make informed predictions about weather patterns and climate trends. The importance of weather instruments cannot be overstated. They form the backbone of modern weather forecasting, helping to safeguard lives and property by providing early warnings for severe weather events. Additionally, these tools contribute valuable data for climate research, agricultural planning, and various industries that rely on weather information. From simple thermometers to advanced satellite systems, weather instruments continue to evolve, enhancing our understanding of the Earth’s complex atmospheric processes.
_
Thermometer:
Thermometers are essential weather instruments that measure air temperature. They provide crucial data for meteorologists to analyze and predict weather patterns. By accurately gauging the thermal energy in the atmosphere, thermometers help forecasters understand heat waves, cold snaps, and seasonal changes.
Types of Thermometers:
Several types of thermometers are used in meteorology:
-Mercury thermometers: Traditional instruments using mercury expansion
-Digital thermometers: Electronic devices offering quick, precise readings
-Bimetallic strip thermometers: Utilize two metals with different expansion rates
-Resistance thermometers: Measure temperature through electrical resistance changes
Thermometer readings are fundamental for creating temperature maps, tracking climate trends, and issuing weather advisories. They play a vital role in agriculture, urban planning, and public safety by providing accurate temperature information for various sectors and activities.
_
Barometer:
A barometer is a crucial weather instrument used to measure atmospheric pressure. This device helps meteorologists predict short-term changes in the weather by detecting variations in air pressure. Barometers come in two main types: mercury and aneroid. Mercury barometers use a column of mercury in a glass tube to measure pressure changes, while aneroid barometers employ a small, flexible metal chamber that expands or contracts with pressure fluctuations. Barometers operate on the principle that air pressure decreases as altitude increases. By measuring these pressure changes, they can indicate whether the weather is likely to improve or worsen. Generally, rising pressure suggests fair weather, while falling pressure often signals approaching storms or precipitation. Meteorologists rely on barometer readings to create accurate weather forecasts, helping to predict everything from clear skies to severe storms.
_
Anemometer:
An anemometer is a crucial weather instrument used to measure wind speed and direction. This device typically consists of three or four cups mounted on a rotating shaft. As the wind blows, it causes the cups to spin, with the rotation speed directly correlating to wind velocity. Modern anemometers often incorporate electronic sensors for precise measurements.
Types of Anemometers:
-Cup anemometer: The most common type, using rotating cups to gauge wind speed.
-Vane anemometer: Combines wind speed measurement with direction indication.
-Hot-wire anemometer: Utilizes a heated wire to measure wind speed based on cooling rate.
Meteorologists and researchers rely on anemometers to gather essential data for weather forecasting, climate studies, and wind energy assessments. These instruments play a vital role in various fields, from aviation to agriculture, helping to ensure safety and optimize operations in wind-sensitive environments.
_
Rain Gauge:
A rain gauge is a crucial meteorological instrument used to measure precipitation accurately. This simple yet effective device consists of a funnel-shaped collector that channels rainfall into a measuring tube. The standard rain gauge used by the National Weather Service features an 8-inch diameter collector.
Types of Rain Gauges:
-Standard Rain Gauge: Manual measurement using a graduated cylinder.
-Tipping Bucket Rain Gauge: Automated system that records rainfall electronically.
-Weighing Rain Gauge: Measures precipitation weight, including snow and hail.
Rain gauges provide essential data for hydrologists and meteorologists. By accurately measuring rainfall amounts, these instruments help predict flooding, assess drought conditions, and contribute to long-term climate studies. Farmers also rely on rain gauge data for irrigation planning and crop management.
_
Hygrometer:
A hygrometer is an essential weather instrument used to measure atmospheric humidity. This device provides crucial data for meteorologists, farmers, and various industries. Hygrometers come in different types, including mechanical, electrical, and digital models. Each type utilizes unique methods to detect moisture levels in the air.
Hygrometers operate on the principle of measuring changes in physical or electrical properties affected by humidity. Some use human or animal hair that expands or contracts with moisture, while others employ electronic sensors to detect water vapor. Modern digital hygrometers often incorporate additional features like temperature readings and data logging capabilities. Accurate humidity measurements are vital in many fields. In agriculture, hygrometers help farmers optimize irrigation and protect crops. In manufacturing, they ensure proper conditions for sensitive processes. Hygrometers also play a crucial role in weather forecasting, aiding meteorologists in predicting precipitation and assessing comfort levels.
_
Ceilometer:
A ceilometer is a sophisticated meteorological instrument designed to measure cloud base height and vertical visibility. This device uses laser or infrared technology to emit a focused beam of light vertically into the atmosphere. By analyzing the backscattered light, the ceilometer can accurately determine the altitude of cloud layers up to 25,000 feet. Ceilometers play a crucial role in aviation safety by providing pilots and air traffic controllers with real-time data on cloud ceilings. They’re also essential for meteorologists in forecasting and studying cloud formation patterns. Some advanced models can detect multiple cloud layers simultaneously, offering a comprehensive vertical profile of the atmosphere.
_
Weather Balloon:
A weather balloon or sounding is a sort of mobile weather station in that it carries instruments into the upper air in able to record observations of weather variables (like atmospheric pressure, temperature, humidity, and winds), then sends back this data during its suborbital flight. It is comprised of a 6-foot-wide helium- or hydrogen-filled latex balloon, and payload package (radiosonde) that encases the instruments. Weather services treat radiosondes as disposable because retrieving them after flight is not cost-effective. Weather balloons are launched at over 500 locations worldwide twice per day, usually at 00 Z and 12 Z.
Weather balloons are essential tools for gathering atmospheric data. These large, helium-filled balloons carry a package of instruments called a radiosonde high into the atmosphere. As they ascend, they collect crucial information on temperature, humidity, air pressure, and wind speed at various altitudes. Weather balloons are typically launched twice daily from hundreds of sites worldwide. They can reach altitudes of up to 100,000 feet, expanding to the size of a small house as they rise due to decreasing air pressure. The radiosonde transmits data back to ground stations in real-time, providing meteorologists with valuable information for weather forecasting and climate research. The data collected by weather balloons is vital for creating accurate weather models and predicting severe weather events. This information helps improve short-term forecasts and long-term climate studies, making weather balloons indispensable in modern meteorology.
_
Thermograph:
A thermograph is a sophisticated weather instrument that continuously records temperature changes over time. This device combines a thermometer with a recording mechanism, providing a visual representation of temperature fluctuations. Thermographs typically use a bimetallic strip or electronic sensor to measure temperature, which is then plotted on a rotating drum or digital display. These instruments are crucial for tracking daily, seasonal, and long-term temperature patterns, helping scientists understand climate change and forecast weather more accurately. In agriculture, thermographs aid in optimizing crop management by monitoring frost risks and heat stress conditions.
_
Wind Vane (or Weather Vane):
A wind vane, also known as a weather vane, is a crucial instrument for determining wind direction. This simple yet effective device typically consists of a rotating arrow or pointer mounted on a fixed vertical rod. The arrow’s tail end is wider and catches the wind, causing it to spin and point in the direction from which the wind is blowing. Wind vanes are often adorned with decorative shapes like roosters or ships, adding aesthetic appeal to their functional purpose. They’re commonly seen atop buildings, barns, and weather stations. While basic in design, wind vanes provide valuable data for meteorologists, farmers, and outdoor enthusiasts, helping predict weather patterns and plan activities accordingly. Modern wind vanes may incorporate electronic sensors for more precise measurements, but the fundamental principle remains unchanged since ancient times.
_
Pyranometer:
A pyranometer is a sophisticated weather instrument designed to measure solar radiation flux density. This precision device captures the total amount of shortwave radiation reaching the Earth’s surface, including both direct sunlight and diffuse sky radiation. Pyranometers typically consist of a thermopile sensor beneath a glass dome, which allows for a 180-degree view of the sky. Pyranometers provide valuable data on solar irradiance, helping scientists and engineers understand solar energy potential, evaluate crop growth conditions, and analyze long-term climate trends. Their accuracy and reliability make them indispensable tools in the study of our planet’s energy balance and the development of sustainable energy solutions.
_
UV Radiometer:
A UV radiometer is a sophisticated weather instrument designed to measure ultraviolet (UV) radiation from the sun. This device plays a crucial role in monitoring potentially harmful UV levels, which can impact human health and the environment. UV radiometers typically use specialized sensors to detect different wavelengths of UV light, including UVA, UVB, and sometimes UVC. These instruments are essential for meteorologists, environmental scientists, and public health officials. They provide valuable data for UV index forecasts, helping people make informed decisions about sun protection. UV radiometers are also used in research to study the effects of UV radiation on ecosystems, materials degradation, and atmospheric processes. By continuously monitoring UV levels, these devices contribute to our understanding of long-term climate trends and ozone layer health.
_
Lightning Sensor:
Lightning sensors are sophisticated instruments designed to detect and monitor electrical discharges in the atmosphere. These devices play a crucial role in weather forecasting and public safety by providing real-time data on lightning activity. Lightning sensors typically use one of two methods to detect strikes:
-1. Electromagnetic detection: These sensors measure the electromagnetic pulses emitted by lightning strikes.
-2. Optical detection: This type uses high-speed cameras to capture the visual flash of lightning.
By providing early warnings and accurate strike data, lightning sensors help meteorologists and safety officials make informed decisions to protect lives and property.
_
Disdrometer:
A disdrometer is a sophisticated weather instrument designed to measure the size distribution and velocity of falling precipitation particles. This device plays a crucial role in meteorology and hydrology by providing detailed information about rainfall intensity, drop size, and kinetic energy. Disdrometers use various technologies, including laser-optical sensors or impact-based mechanisms, to detect and analyze individual raindrops or other precipitation particles. As drops fall through the sensor area, the instrument records their size, speed, and quantity, enabling meteorologists to gain insights into storm characteristics and rainfall patterns. These instruments are invaluable for weather forecasting, climate research, and agricultural applications. By offering precise measurements of precipitation microstructure, disdrometers help improve radar calibration, enhance flood prediction models, and contribute to our understanding of precipitation processes in different weather systems.
_
Sunshine Recorder:
The sunshine recorder is a crucial meteorological instrument used to measure the duration and intensity of sunlight. This device typically consists of a glass sphere that acts as a lens, focusing sunlight onto a specially designed card. As the sun moves across the sky, it burns a trace on the card, allowing meteorologists to calculate the total hours of bright sunshine in a day. Sunshine recorders provide valuable data for various applications, including agriculture, solar energy planning, and tourism. They help farmers optimize crop growth cycles, assist solar panel installers in determining ideal locations, and inform vacation planners about the sunniest destinations. Additionally, these instruments play a vital role in climate research, contributing to our understanding of long-term weather patterns and global climate change.
_
Radiometer:
Radiometers differ from sunshine recorders and are specifically designed to measure solar radiation intensity. There are various types of radiometers capable of measuring wavelengths ranging from ultraviolet to infrared. Two commonly used types are photoelectric radiometers and thermoelectric radiometers, the latter known for its greater accuracy, albeit at a higher cost. Radiometers are valuable tools across multiple disciplines: they help monitor solar radiation balance and study the greenhouse effect in meteorology, measure astronomical radiation to understand celestial bodies and the universe’s evolution, and evaluate the environmental impact of pollutants in ecological science.
_
Weather Radar:
Weather radar is an essential weather instrument used to locate precipitation, calculate its motion, and estimate its type (rain, snow, or hail) and intensity (light or heavy). First used during World War II as a defense mechanism, radar was identified as a potential scientific tool when military personnel happened to notice “noise” from precipitation on their radar displays. Today, radar is an essential tool for forecasting precipitation associated with thunderstorms, hurricanes, and winter storms.
Radar is a radio wave detection technology that is an active microwave atmospheric remote sensing device. Weather radars use a wide range of radio wavelengths, from 1 centimeter to 1,000 centimeters. They are often divided into different bands to indicate the primary function of the radar. Any radar that does not have Doppler performance is called a non-coherent or conventional weather radar, and a radar with Doppler performance is called a coherent or Doppler radar. Weather radars can detect the height and thickness of clouds that have not formed precipitation, as well as the physical properties within the clouds, so as to analyze the distribution, movement and evolution of precipitation.
In 2013, the National Weather Service began upgrading its Doppler radars with dual polarization technology. These “dual-pol” radars send and receive horizontal and vertical pulses (conventional radar only sends out horizontal) which gives forecasters a much clearer, two-dimensional picture of what’s out there, be it rain, hail, smoke, or flying objects.
Doppler radar measures changes in wind speed and direction. It provides information within a radius of about 230 kilometers (143 miles). Conventional radar can only show existing clouds and precipitation. With Doppler radar, meteorologists are able to forecast when and where severe thunderstorms and tornadoes are developing. Doppler radar has made air travel safer. It lets air traffic controllers detect severe local conditions, such as microbursts. Microbursts are powerful winds that originate in thunderstorms. They are among the most dangerous weather phenomena a pilot can encounter. If an aircraft attempts to land or take off through a microburst, the suddenly changing wind conditions can cause the craft to lose lift and crash. In the United States alone, airline crashes because of microbursts have caused more than 600 deaths since 1964.
_
Lidar:
Lidar is an active remote sensing device that uses a laser as the emitting light source and optoelectronic detection technology. Lidar is an advanced detection method combining laser technology and modern photoelectric detection technology. Lidar’s working principle is very similar to radar, pulsed laser constantly scanning the target object, you can get the target object on all the target point data, with this data for imaging processing, you can get accurate three-dimensional stereo image. LIDAR is widely used in the fields of terrain mapping, environmental monitoring, autonomous driving, archaeology and urban planning. LiDAR (Light Detection and Ranging) is an active remote-sensing technique that uses laser pulses to measure atmospheric constituents, vertical profiles, and wind speeds with high precision.
_
Weather Satellite:
Weather satellites are advanced technological marvels that revolutionize meteorological observations from space. These orbiting instruments provide a comprehensive, bird’s-eye view of Earth’s atmosphere, oceans, and land surfaces. By capturing high-resolution images and data, they enable meteorologists to track storm systems, monitor cloud patterns, and measure atmospheric conditions on a global scale.
Weather satellites employ various sensors to collect crucial information, including visible light cameras for cloud imagery, infrared sensors for temperature readings, and microwave instruments for measuring precipitation. This wealth of data enhances weather forecasting accuracy, aids in climate research, and supports early warning systems for severe weather events.
Two main types of weather satellites exist: geostationary and polar-orbiting. Geostationary satellites remain fixed above a specific location, providing continuous coverage of a large area. Polar-orbiting satellites circle the Earth, offering detailed observations of the entire planet over time.
Weather satellites provide real-time data on cloud cover, precipitation, wind speed and temperature to help forecast extreme weather such as hurricanes, typhoons and thunderstorms. Weather satellites can monitor natural disasters such as volcanic activity, forest fires, and floods, as well as monitor various types of environmental pollution. Weather satellites provide soil and vegetation data to provide scientific management programs.
In 2010, the volcano Eyjafjallajokull, in Iceland, erupted. It sent millions of tons of gases and ash into the atmosphere. Weather satellites in orbit above Iceland tracked the ash cloud as it moved across western Europe. Meteorologists were able to warn airlines about the toxic cloud, which darkened the sky and would have made flying dangerous. Hundreds of flights were canceled.
_
Your Eyes:
There’s one very important weather observing instrument we haven’t mentioned yet: the human senses!
Weather instruments are necessary too, but they can never replace human expertise and interpretation. No matter what your weather app, indoor-outdoor weather station records, or access to high-end equipment, never forget to verify it against what you observe and experience in “real life” outside your window and door.
_
In-Situ vs. Remote Sensing:
Each of the above weather instruments uses either the in-situ or remote sensing method of measuring. Translated as “in place,” in-situ measurements are those taken at the point of interest (your local airport or backyard). In contrast, remote sensors collect data about the atmosphere from some distance away.
______
______
Weather Instrument Accuracy:
Consumer weather instruments are not laboratory devices. Every sensor has a specified accuracy tolerance — the range within which its readings are expected to be correct. Understanding these tolerances helps you interpret your readings realistically.
|
Instrument |
Typical Consumer Accuracy |
Best Available |
Notes |
|
Thermometer |
±2°F |
±0.5°F |
Radiation shield required for outdoor accuracy |
|
Hygrometer |
±3% RH |
±2% RH |
Calibrate with salt test for precision use |
|
Barometer |
±0.06 inHg |
±0.03 inHg |
Must be set to local sea-level equivalent |
|
Rain Gauge |
±4% |
±1% |
Placement and debris management critical |
|
Anemometer |
±3 mph |
±2 mph |
Mounting height matters more than sensor accuracy |
|
Wind Vane |
±10 degrees |
±3 degrees |
Cup-type vanes may not register light winds below 2 mph |
______
______
Uses of weather instruments:
Weather forecasting:
Real-time data from barometers, hygrometers, and anemometers feeds into forecasting models that predict conditions hours or days in advance. Long-term datasets from the same instruments help identify climate patterns like El Niño cycles or regional drought trends.
Disaster warning:
Weather instruments can monitor extreme weather changes in real time, such as flood warnings issued by water level monitoring stations when they detect abnormal water levels, and extreme weather such as typhoons and hurricanes detected by weather satellite systems. Weather instruments can help us to take timely measures to respond to disasters and minimize personal and property losses.
Environmental monitoring:
The use of anemometers to monitor the flow rate and flow direction of pollutants in the air, such as: sulfur dioxide, PM2.5, ozone and so on can help the environmental protection department to deal with pollutants rationally and effectively.
Agricultural management:
Weather stations installed on farms provide continuous data regarding temperature, rainfall, solar radiation, and soil conditions. This information supports precision irrigation scheduling, frost protection alerts, and optimal harvest timing, which directly enhances crop yields and minimizes resource waste.
Aviation and navigation:
Meteorological monitoring is the most important guarantee for the safety of navigation and aviation. Aircraft and ships need weather satellite navigation that provide real-time data. It helps them to avoid bad weather.
Urban planning:
When planning and designing a city, the data collected by weather instruments make it easy to choose the right place to live. Avoid natural disaster-prone locations. Meanwhile, transportation hubs are scientifically planned.
______
Use of weather instruments in agriculture / aviation / marine navigation:
Agriculture:
- Thermometer: Monitors air temperature for agricultural meteorological research and crop growth modeling
- Hygrometer (Dry-and-Wet-Bulb Thermometer): Monitors air humidity to guide irrigation and pest and disease control
- Rain Gauge: Records precipitation for irrigation planning
- Sunlight Meter/Light Intensity Recorder: Monitors light intensity and duration, helping farmers understand field lighting conditions and plan planting and harvest times appropriately. Digital light intensity recorders utilize the principle of photodiodes to convert light intensity into electrical signals, enabling automatic and continuous recording. In agriculture, they can be used to monitor light intensity in fields, helping farmers understand lighting conditions and plan planting and harvest times appropriately.
- Anemometer: Assesses the impact of wind on crops (e.g., pollination, risk of lodging) and the timing of pesticide application
Aviation:
- Barometer: A fundamental instrument for flight altitude calibration
- Anemometer/Wind Vane: Used to predict weather changes and ensure flight and navigation safety
- Doppler Radar: Detects precipitation intensity, wind direction, and wind speed; provides hail and rainfall estimates; used for en-route weather warnings
- Weather Balloons (Sounding Instruments): Measure high-altitude atmospheric conditions and provide data for aviation weather forecasting
- Weather Satellites: Provide wide-area cloud imagery and weather system monitoring
Marine Navigation:
- Anemometer/Wind Vane: Also used to assess air pollution dispersion, optimize wind turbine design, and ensure safety during outdoor activities; in marine navigation, they are primarily used to monitor wind speed and direction to ensure safe navigation
- Barometer: Used to predict storms and changes in weather systems; it is a fundamental instrument for shipboard meteorological observations
- Radar: Detects precipitation and weather systems, assisting in navigation decisions
- Thermometer, Hygrometer: Used at marine meteorological observation stations; data is fed into comprehensive meteorological networks
_______
_______
Weather map:
The weather map, also known as a synoptic (summary or overview) chart, is a simple representation of the weather patterns at the Earth’s surface, showing the locations and movements of the different systems. A weather map is a graphical representation that displays weather conditions across a specific geographical area. The depicted weather events can pertain to the past, present, or future forecasts. From a meteorological perspective, a weather map illustrates the current state of the atmosphere over a larger region. A weather map, also known as synoptic weather chart, displays various meteorological features across a particular area at a particular point in time and has various symbols which all have specific meanings. Weather maps show high- and low-pressure systems and fronts. In addition to bars representing different fronts, weather maps usually show isotherms and isobars. Isotherms are lines connecting areas of the same temperature, and isobars connect regions of the same atmospheric pressure. Weather maps also include information about cloudiness, precipitation, and wind speed and direction.
_
Weather maps are invaluable tools for a variety of purposes, including:
-Weather Forecasting: Meteorologists use weather maps to predict future weather patterns, helping us prepare for potential storms, heatwaves, or cold snaps.
-Aviation and Navigation: Pilots and ship captains rely on weather maps to make safe navigation decisions, avoiding adverse weather conditions.
-Agriculture: Farmers use weather maps to plan planting and harvesting schedules and manage irrigation.
-Emergency Management: During severe weather events, emergency services use weather maps to coordinate responses and keep the public informed.
_
Types of Weather Maps
Weather maps come in various types, each designed to highlight specific aspects of meteorological conditions. These specialized maps cater to different needs and fields of study. Here are some common types:
-1. Surface or Ground Weather Maps
Surface weather maps are perhaps the most recognizable type of weather map. They show the current weather conditions at the Earth’s surface. These maps typically show temperature, pressure systems (highs and lows), wind direction and speed, humidity levels, and precipitation. To create a ground map, air pressure readings must be collected from all weather stations, which are measuring stations located on the ground within the map’s coverage area. Based on the location of each weather station, the relevant information is plotted onto the map. Additionally, satellite and radar imagery is employed to ensure precise assessments. In the subsequent step, the highest and lowest air pressure values are identified and marked on the map. “H” represents areas of high pressure, while “L” indicates regions of low pressure. The distribution of these high and low-pressure areas is illustrated on weather maps using isobars, which are lines connecting points of equal air pressure. A popular type of surface weather map is the surface weather analysis, which plots isobars to depict areas of high pressure and low pressure.
-2. High-Altitude or Upper-Air Weather Maps
High-altitude weather maps, also known as upper-air weather maps, focus on weather conditions at various altitudes above the Earth’s surface. These data are collected using radiosondes and then displayed on weather maps. These values are presented as lines indicating equal pressure surface heights, known as isohypses, which exhibit smoother variations compared to isobars. Subsequently, a weather forecast can be generated to depict the expected weather conditions. In addition to meteorologists’ expertise, historical and current atmospheric data are considered, applying physical principles and comparing measured values with model calculations.
_
Weather maps summarize weather info on a geographic frame of reference.
- Present weather – Maps that are created from current (or recent past) weather observations are called Analysis Maps.
- Future weather – Maps produced by Numerical Weather Prediction (NWP) computer codes for the future are Forecast Maps or progs (short for “prognosis”).
Both maps can look similar to each other, so you need to find the Valid Time that is printed on each map to see if it is for the past, present, or future.
Forecasts further into the future are less and less accurate. For this reason, it is wise to get frequent updates to the weather analyses and forecasts to ensure that you have the “freshest” data.
_______
Reading a weather map comes down to understanding four main elements: pressure systems (H and L), isobars (lines of equal pressure), weather fronts (colored lines with shapes), and station models. Together, these elements show you exactly where storms, clear skies, and wind are heading.
-1. Pressure Systems
Look for the big red “H” or blue “L” on the map, which dictate the overall weather pattern.
- H (High Pressure): Associated with heavy, sinking air, which brings fair, clear, and stable weather. Air flows outward clockwise (in the Northern Hemisphere) from a high-pressure zone.
- L (Low Pressure): Associated with light, rising air, which cools and forms clouds. Expect unsettled, stormy, and cloudy weather. Air spirals inward counter-clockwise (in the Northern Hemisphere) toward a low.
-2. Isobars
These are the thin lines connecting areas of equal air pressure.
- Wind Strength: The closer together the isobars are packed, the stronger the pressure change and the higher the wind speed. Widely spaced isobars indicate calm or light winds.
-3. Weather Fronts
Fronts represent the boundary where two different air masses meet, usually signaling a significant change in weather and temperature.
- Cold Fronts: Solid blue lines with triangles pointing in the direction the front is moving. They bring cold air to replace warm air, often resulting in heavy rain, thunderstorms, and a sharp drop in temperature.
- Warm Fronts: Solid red lines with half-circles pointing in the direction of movement. They bring warm air to replace cold air, leading to light, steady rain and gradually rising temperatures.
- Stationary and Occluded Fronts: Alternating red and blue symbols (stationary means the boundary isn’t moving, causing prolonged rain in one spot) or a purple line with both symbols (indicating a cold front has overtaken a warm front).
-4. Station Models
If your map is a close-up surface map, you will see clustered symbols. These are station models that provide a quick snapshot of the exact current weather at a specific location, showing Temperature (usually top-left), Dew Point (bottom-left), Wind Direction and Speed (a line pointing in the direction the wind is blowing, with hash marks for speed), and Cloud Cover (a circle that fills in depending on how overcast the sky is)
_______
How to Read a Surface Weather Map:
Surface weather maps provide a snapshot of various meteorological conditions at ground level. These maps include symbols representing different weather phenomena like rain, snow, and fog. For instance, dots represent rain, while asterisks signify snow. Additionally, surface maps show front lines, indicating the boundaries of different air masses and often the zones of most significant weather changes. These maps also include temperature data, usually in the form of color-coded areas or specific temperature readings at various locations. Understanding how to read temperature data alongside other weather indicators is crucial for a comprehensive view of current weather conditions.
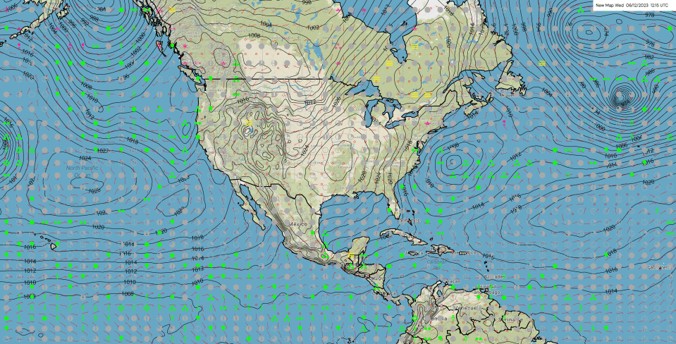
Figure above is an example of a surface weather map:
______
How to Read Wind Speed and Direction on a Weather Map:
Wind speed and direction on a weather map are usually shown using wind barbs.
Wind barbs provide detailed information about wind speed and direction. The staff of the barb indicates the direction from which the wind is blowing. Each full barb represents 10 knots of wind speed, while half barbs represent 5 knots. See figure below.
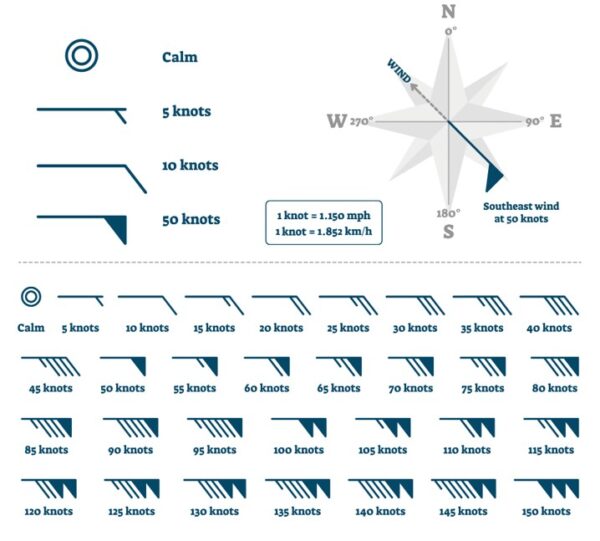
In aviation and marine navigation, understanding wind barbs is critical for safety and efficiency. These symbols also help in identifying weather patterns such as high-pressure systems and cyclones.
______
How to Read Air Pressure on a Weather Map:
Air pressure on a weather map is usually shown using isobars.
Isobars connect points of equal atmospheric pressure and are key in identifying pressure systems. Tightly packed isobars indicate a steep pressure gradient, usually translating into high wind speeds. Conversely, isobars that are far apart suggest mild winds. By tracking the movement of isobars, meteorologists can predict changes in weather conditions, including the approach of storms or the onset of calm weather.
Isobars also help in identifying the centers of high and low-pressure systems. High-pressure systems, generally associated with good weather, are indicated by isobars that form closed circles with higher pressure values towards the center. Low-pressure systems, often bringing clouds and precipitation, show the opposite pattern.
_
Isobars indicate the flow of air around weather systems. You can broadly interpret wind strength and direction from these maps. The general rule is that winds are strongest where the isobars are closest together. Thus, the strongest winds are usually near cold fronts, low pressure systems, tropical cyclones and in westerly airstreams south of Australia. Winds are normally light near high pressure systems where the isobars are widely spaced.
Weather maps as they appear on TV, in a newspaper are called ‘surface charts’ or, more correctly, ‘Mean Sea Level’ (MSL) charts. They show what is happening at a set time where most of us need it – at the Earth’s surface.
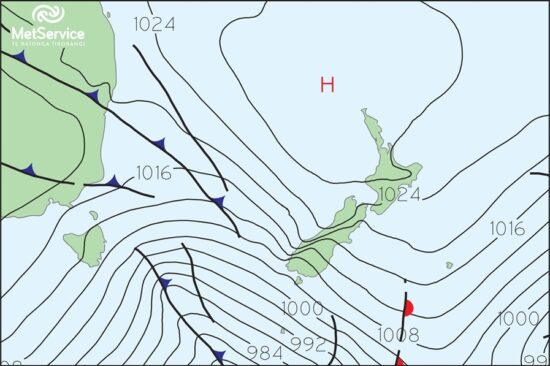
The black lines which curve across in the map above are called isobars (iso = equal, bar = pressure). They join together places with the same mean sea level air pressure (weight per square area of air above). Some have numbers on them showing this value in hectoPascals (hPa).
_
In the Southern Hemisphere the flow is clockwise around areas of low pressure and counterclockwise around areas of high pressure as seen in figure below. In the Northern Hemisphere the flow is the other way around.
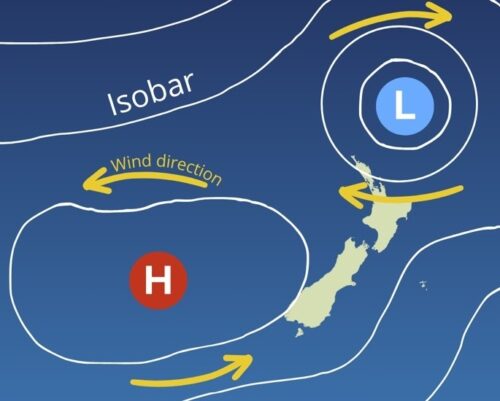
On the pressure charts areas of high pressure are marked with an “H” and areas of low pressure with an “L”. The wind flow around these is shown by the yellow arrows in the figure above.
_______
How To Read Temperature on a Weather Map:
Typically, temperature information is represented using color shading or contour lines. Warmer areas are depicted in shades of red, orange, or yellow, while cooler regions appear in shades of blue, green, or purple. Each color or contour interval corresponds to a specific temperature range.
By comparing these temperature patterns, meteorologists and weather enthusiasts can identify temperature gradients and variations across a geographical area.
Additionally, isotherms, which are lines connecting locations with the same temperature, provide a detailed view of temperature distribution.
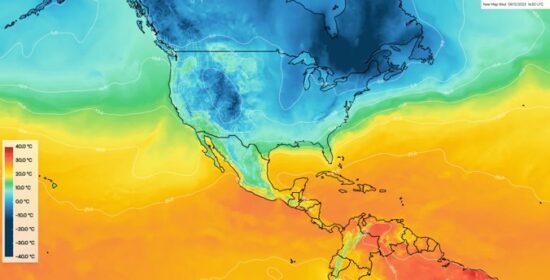
Figure above shows temperature and isotherms over North and Central America.
________
How to Read Fronts on a Weather Map:
Fronts are depicted as lines with specific symbols that indicate their type. A cold front, usually bringing cooler temperatures and possibly storms, is shown with a blue line with triangles pointing in the direction of movement. A warm front, often bringing milder weather, is depicted with a red line with semi-circles.
Understanding fronts is crucial as they are often associated with significant weather changes. For example, the passage of a cold front can bring a sudden drop in temperature and a shift in wind direction.
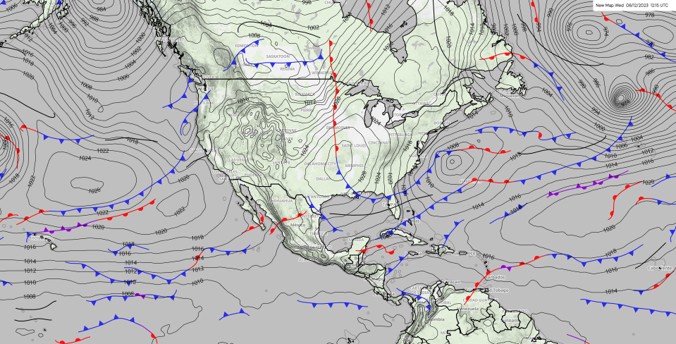
Weather map showing cold fronts in blue and warm fronts in red over North and Central America.
_______
How to Read Cloud Cover on a Weather Map:
Cloud cover on weather maps is indicated by various symbols. A clear sky might be represented by a circle with a single dot in the middle, while a fully shaded circle indicates overcast conditions. Partial shading denotes partly cloudy skies.
Instead of using circles, some weather maps may depict cloud cover using cloud icons or images. A clear sky might be represented by an absence of clouds or a symbol with minimal cloud coverage, while fully shaded cloud icons indicate overcast conditions. Partial shading or the presence of scattered cloud images suggests partly cloudy skies.
Cloud cover data, combined with other weather information, can also help in predicting precipitation and temperature changes.
_______
How To Read Ocean Currents on a Weather Map:
To decipher ocean currents on a weather map, look for color gradients that represent the direction and velocity of water movement in the Earth’s oceans and seas. While some maps use arrows or flow lines, others utilize color variations to convey this information. The color orientation signifies the current’s flow direction, with warmer hues indicating one direction and cooler hues denoting another.
Moreover, the intensity of the color gradient, ranging from gentle transitions to more abrupt shifts, provides insight into the current’s speed — gradual transitions represent slower currents, while sharp changes indicate swifter flows.
Mastering the interpretation of these color-coded representations is essential for comprehending ocean dynamics and their influence on various aspects, from marine navigation to climate patterns.
_______
How to Read a Radar Weather Map:
Radar weather maps are particularly useful for visualizing precipitation. They use color gradients to show the intensity of rainfall, snow, or other forms of precipitation. Light precipitation is usually indicated in lighter colors like green or blue, while heavy precipitation appears in red or purple.
These maps also show the movement of storm systems, which is critical for predicting the timing and impact of bad weather. For instance, a radar map can show the direction a thunderstorm is moving, helping in issuing timely weather warnings.
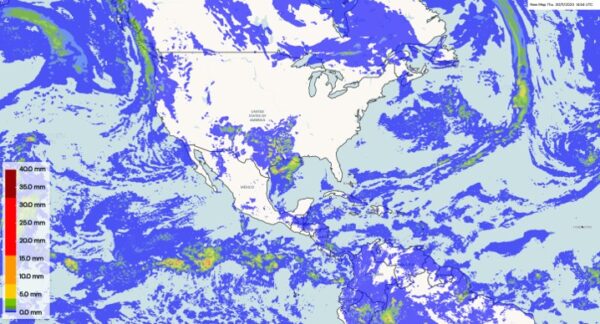
Radar data showing precipitation over North and Central America.
_______
Skew-T log-P diagram:
A skew-T log-P diagram is one of four thermodynamic diagrams commonly used in weather analysis and forecasting. A Skew-T log-P diagram is a thermodynamic chart used in meteorology to plot and analyze the vertical profile of temperature, moisture, and wind in the atmosphere from weather balloon data. The Skew-T Log-P offers an almost instantaneous snapshot of the atmosphere from the surface to about the 100 millibar level. It provides an instant snapshot of atmospheric stability, moisture content, and wind shear.
_
The chart features five main sets of reference lines:
- Isobars: Horizontal lines representing pressure (decreasing as altitude increases).
- Isotherms: Lines of constant temperature, skewed at a 45° angle to the right to prevent overlap.
- Dry Adiabats: Curved lines sloping up and left, showing how an unsaturated air parcel cools as it rises.
- Moist Adiabats: Curved lines bending toward the vertical, representing the slower cooling rate of saturated air.
- Mixing Ratio Lines: Dashed lines sloping up and right that track the absolute water vapor content.
By plotting how temperature and dew point change with height, forecasters can determine severe weather potential (e.g., CAPE), cloud formation, and precipitation types (like snow vs. freezing rain).
_
Below are all the basics lines that make up the Skew-T:
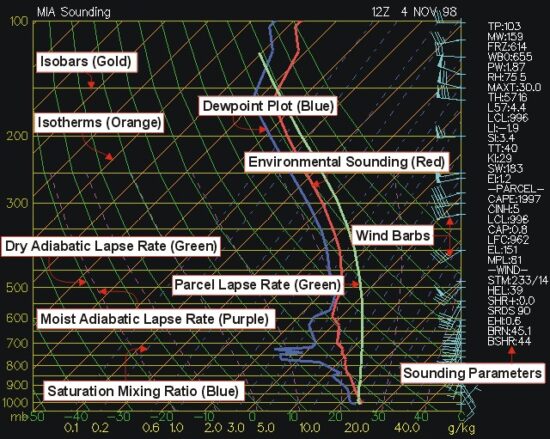
(Isobars) – Lines of equal pressure. They run horizontally from left to right and are labeled on the left side of the diagram. Pressure is given in increments of 100 mb and ranges from 1050 to 100 mb. Notice the spacing between isobars increases in the vertical (thus the name Log P).
(Isotherms) – Lines of equal temperature. They run from the southwest to the northeast (thus the name skew) across the diagram and are SOLID. Increment are given for every 10 degrees in units of Celsius. They are labeled at the bottom of the diagram.
(Saturation mixing ratio lines) – Lines of equal mixing ratio (mass of water vapor divided by mass of dry air — grams per kilogram) These lines run from the southwest to the northeast and are DASHED. They are labeled on the bottom of the diagram.
(Wind barbs) – Wind speed and direction given for each plotted barb. Plotted on the right of the diagram.
(Dry adiabatic lapse rate) – Rate of cooling (10 degrees Celsius per kilometer) of a rising unsaturated parcel of air. These lines slope from the southeast to the northwest and are SOLID. Lines gradually arc to the North with height.
(Moist adiabatic lapse rate) – Rate of cooling (depends on moisture content of air) of a rising saturated parcel of air. These lines slope from the south toward the northwest. The MALR increases with height since cold air has less moisture content that warm air.
(Environmental sounding) – Same as the actual measured temperatures in the atmosphere. This is the jagged line running south to north on the diagram. This line is always to the right of the dewpoint plot.
(Dewpoint plot) – This is the jagged line running south to north. It is the vertical plot of dewpoint temperature. This line is always to the left of the environmental sounding.
(Parcel lapse rate) – The temperature path a parcel would take if raised from the Planetary Boundary Layer. The lapse rate follows the DALR until saturation, then follows the MALR. This line is used to calculate the LI, CAPE, CINH, and other thermodynamic indices.
______
______
Section-5
Chaos theory in meteorology:
Chaotic systems refer to systems whose behavior is highly sensitive to initial conditions, and this sensitivity can manifest as complex and unpredictable patterns. These systems can be found in various real-world applications and have led to the development of the theory of chaos. Chaotic systems are deterministic, meaning they follow specific rules or equations (meaning that when you run it with exactly the same input, the output will always be the same) but their inherent complexity leads to unpredictable behavior over time. Examples of chaotic systems include weather patterns, neural networks, and certain economic models.
_
In the early 1960s, Edward Lorenz, an MIT meteorologist with a keen interest in computer modeling, made what seemed to be a small computational shortcut. While running a simulation on a primitive computer, he entered a rounded number—0.506 instead of the original 0.506127—expecting only a minor variation in the weather model output. What followed was astonishing: the resulting forecast diverged dramatically from the original, suggesting a completely different atmospheric pattern. Rounding a number from 0.506127 to 0.506 changed the resulting weather simulation completely. This principle became known as the butterfly effect: a tiny change like a butterfly flapping its wings can shift a massive weather pattern later. The flap of a butterfly’s wings in Brazil can set off a tornado in Texas.
That moment, both accidental and historic, would lay the foundation for what is now known as chaos theory in weather modeling. Lorenz had stumbled upon a profound scientific truth: that complex systems could be extremely sensitive to initial conditions. This became famously known as the butterfly effect, and it would revolutionize not just meteorology, but also physics, biology, and even economics.
_
Prior to Lorenz, weather was treated like a giant puzzle: difficult, but solvable. The prevailing assumption was that, given powerful enough computers and accurate data, long-range forecasts could eventually become perfectly reliable. Scientists operated under Newtonian determinism—if you know the present with perfect precision, you can predict the future.
Lorenz disrupted this view. He showed that nonlinear systems, like the atmosphere, behave in ways that are not just complicated, but inherently unpredictable. This unpredictability doesn’t stem from randomness but from sensitivity to initial conditions—a defining property of chaotic systems. This realization became the seed of chaos theory in weather modeling, and it challenged one of the core assumptions of science: that predictability increases with better data.
_
Chaos theory is a branch of mathematics and science that studies how systems that follow strict, predictable rules can still produce completely unpredictable, disorderly outcomes. Chaos theory explains why some systems behave unpredictably even when governed by clear rules. It is widely used to understand unpredictable weather, complex systems, and patterns that seem random but are not. By examining how small changes influence outcomes, chaos theory challenges the idea that perfect knowledge always leads to accurate predictions.
Weather is one of the most visible examples of a chaotic system. Temperature, pressure, humidity, wind patterns, ocean currents, and solar radiation interact in complex, nonlinear ways. A slight rise in temperature in one region can intensify convection currents, shift winds, and eventually change the formation of storms thousands of miles away.
Because of deterministic chaos, small inaccuracies in initial data can lead to large errors in forecasts. This is why short-term weather predictions are fairly accurate, while long-term forecasts become less reliable.
For instance, a slight change in ocean temperature or wind flow can alter storm development. These small variations compound over time, making precise long-range forecasting nearly impossible. Even with satellites, supercomputers, and massive datasets, the atmosphere’s inherent sensitivity to initial conditions ensures that perfect long-term forecasting is impossible.
_
Key Features of Chaotic Systems:
Chaotic systems share several defining characteristics:
- Sensitivity to initial conditions
- Nonlinearity
- Interconnected variables and feedback loops
- Apparent randomness despite deterministic rules
These features explain why such systems are difficult to predict yet not entirely unstructured. Patterns can still emerge, even within unpredictable behavior.
_
Why Nonlinear Systems Matter:
Weather is fundamentally nonlinear. This means small changes do not simply add up; they interact, amplify, or cancel out in unpredictable ways. Nonlinear interactions between temperature, wind, humidity, and other variables make forecasting complex — and explain why a seemingly calm day can suddenly turn stormy. Nonlinear interactions mean that variables like heat, moisture, and wind do not just add up cleanly; they amplify small changes. The horizon of predictability for detailed, day-to-day weather is roughly two weeks. Beyond this window, error growth overtakes actual data. Chaos theory also applies beyond weather: stock markets, traffic flow, ecosystems, and even social behavior all show similar patterns of sensitive dependence on initial conditions.
_
Cross-Disciplinary Influence of Chaos Theory:
While Lorenz focused on meteorology, his ideas sparked investigations across a wide spectrum of fields:
- In biology, chaos theory explains erratic heartbeat patterns and brain wave irregularities.
- In ecology, it models population booms and crashes in species.
- In economics, it accounts for the unpredictable fluctuations of financial markets.
- In astrophysics, it helps describe gravitational interactions and orbital resonances.
- In computer science, it contributes to algorithmic randomness and data encryption.
The idea that complex, deterministic systems can behave unpredictably has given rise to entirely new modeling techniques, software simulations, and predictive tools.
________
Edward Lorenz was a meteorologist and mathematician who worked in statistical weather forecasting: the field of creating forecast predictions by taking in data about initial conditions and using it to model variables like temperature, wind speed and pressure. In 1961, he was running one such model, using twelve weather-related variables to represent the initial conditions, and decided to re-run a specific section of it by entering in the conditions from part-way through the model. The subsequent prediction initially looked similar to its first iteration, but then started to differ wildly, until it hardly resembled its predecessor.
_
Lorenz realized that these results had occurred because the conditions of the variables that the computer had been going off in the original recording were saved to six decimal places, whereas the data that he had typed in in the second iteration had only been to three decimal places. So the value representing the airstream, 0.506127, had become 0.506, with a similar simplification occurring in all the other variables as well. The fact that changing values by such a tiny amount could alter the predictions so drastically forms the basis of Chaos Theory, and Lorenz’s subsequent research into this field would lay the foundations for studies in so many sectors of our modern world: from population modelling to planetary orbits. Chaos, after all, is not only fascinating but universal.
_
A good example of chaos in work is the Lorenz System, developed by Lorenz in 1963. It is a non-linear, three dimensional, and deterministic (meaning that when you run it with exactly the same input, the output will always be the same) model for atmospheric convection based on a basic series of differential equations, with σ, ρ and β as the initial conditions. The Lorenz System is an example of a model that can show chaotic behavior. For example, when Lorenz used the values of ρ = 28, σ = 10 and β = 8/3, tiny changes in the initial point of the model caused the path it took to be completely different. In the below example (showing the model when t = 1, 2, and 3, from left to right), the initial point of the yellow and blue lines differs by only 10^-5 on the x-axis, and yet as the t-value increases, their paths start to diverge more and more as seen in figure below.
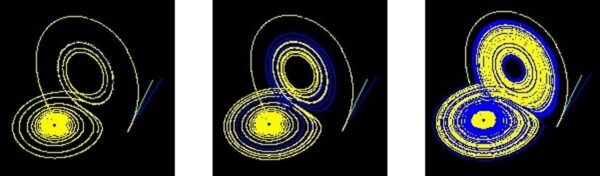
This simple example barely scratches the surface of chaos theory and all its fascinating aspects. Nonetheless, the fact that the Lorenz System, which has chaotic properties, was developed for atmospheric convection, in conjunction with the fact that chaos theory was first explored through the lens of meteorological models, showcases just how integral chaos is to Meteorology and forecast predictions. In other words, it tells us that, when we complain about how unpredictable the weather can be, we should be pointing the finger of blame at chaos.
_
Unless we develop the ability to gain a full understanding of the atmosphere in real-time, analyzing every cloud, every temperature change, every gust of wind as it appears, we will remain unable to feed completely accurate initial conditions into any weather forecast modeling program. And, as chaos theory shows, this can lead to more predictions days in advance being very different from what actually happens. This can lead to a day of rain when a day of sunshine was expected.
On the other hand, it is important to note that, in the short-term, models can actually be quite accurate. After all, from the models showing chaotic properties we can see that, initially, the different paths tend to align quite well. So forecasting models running a single prediction (known as deterministic forecasting) for the near future can work very effectively. Furthermore, the advantage of deterministic forecasting is that it can show predictions for temperature and all the other weather variables in high resolution, since all the computer processing power possessed by those running the models can be focused on creating that one forecast, with no distractions or other models taking up processing space.
However, the obvious disadvantage is that, if the initial conditions fed into the deterministic algorithm are even remotely off (which, as we have already discussed, is almost inevitable), it is almost guaranteed to develop an increasing degree of inaccuracy as it tries to make predictions further and further in advance.
_
Lorenz showed clearly that the uncertainty in the initial condition, however small, will lead to uncertainty in the forecast after a certain, but variable, period of time depending on the initial state of the atmosphere. As a consequence, the numerical weather prediction community began to consider the use of probabilistic methods for forecasting, especially beyond the deterministic limit of one week or so suggested by Lorenz.
Early implementation of probabilistic methods for numerical weather prediction was based on applying small, random perturbations to the atmospheric state variables (temperature, humidity, winds and pressure) in the analysed initial condition. Because the atmosphere is nonlinear, these minute perturbations are then amplified by chaotic processes and each forecast diverges from the others as seen in figure below.
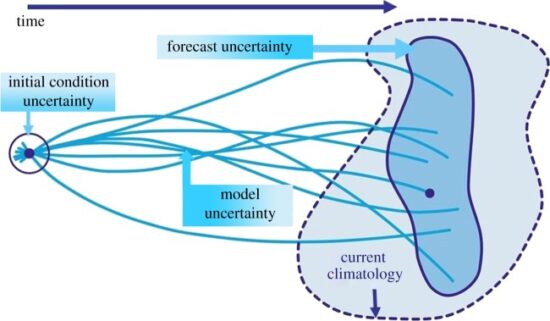
Schematic of a probabilistic weather forecast using initial condition uncertainties. The blue lines show the trajectories of the individual forecasts that diverge from each other owing to uncertainties in the initial conditions and in the representation of sub-grid scale processes in the model. The dashed, lighter blue envelope represents the range of possible states that the real atmosphere could encompass and the solid, dark blue envelope represents the range of states sampled by the model predictions.
_
So how have mathematicians reduced this risk of this happening?
By using another modeling technique called ‘Ensemble forecasting’. This idea, which was pushed by Edward Epstein in the 1960s, and is universally used for long-term predictions today, involves running a predictive weather model multiple times with slightly different starting conditions, and calculating what is most likely to happen based off of the ‘ensemble spread’ of possible outcomes that the model creates. This method is designed to account for the likelihood of errors that may abound as a result of both flaws in the model itself (due to simplifications of atmospheric processes, potential biases, as well as a range of other factors), as well as the potential inaccuracy of the data about the atmospheric conditions that, as we have already discussed, is almost inevitable. Here is an example.
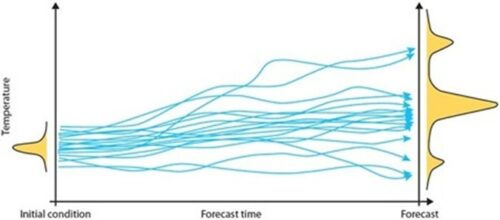
_
According to the Met Office, the variant of MOGREPS (Met Office Global and Regional Ensemble Prediction System) that they use for global predictions, known as MOGREPS-G, runs predictive models on a 6 hour cycle (at 00, 06, 12, and 18). The system works by running a model using the set of data on weather conditions that it has (the control member), then making a series of perturbations (small changes) to this set and runs 17 more iterations using different perturbations. It then combines these 18 forecasts with the forecasts from the previous cycle to achieve an ensemble spread with 36 members.
Once the ensemble spread has been collected, the forecast is then determined by calculating the mean, standard deviation, and spread of these ensemble predictions that are generated. Meteorologists calculate which outcome is most likely to occur using a number of logic-driven assumptions, going off what has happened in previous circumstances when there were similar readings, and in many cases, exchanging data and predictions with other companies responsible for predicting weather forecasts companies that might use entirely different models, algorithms and systems – in order to form the most accurate idea of what the weather will do.
_
Most meteorology centres use a combination of deterministic and ensemble models, with the deterministic models mapping the forecast for the next few days, and the ensemble predictions taking precedence after that, up until the (standard) two week cut-off point that is commonly used. With our current technology and mathematical algorithms, the degree of accuracy beyond two weeks is generally considered to be too small, at less than 50%.
_______
This is how Meteorologists overcome Chaos:
- Centers like the European Centre for Medium-Range Weather Forecasts use ensemble forecasting.
- Supercomputers run dozens of simulations at once.
- Each run starts with tiny variations in the initial data.
- Forecasters read the spread of results to calculate probabilities instead of relying on a single flawed guess.
_______
_______
Section-6
History of weather forecasting:
Since pre-historic periods men and women have looked to the sky and wondered what the weather was going to do – perhaps for planned hunting trip or drying pelts gathered from such a trip. Originally it was assumed that the sun ruled the earth’s weather and it was therefore worshipped as a God. Of course, in many ways, arguably, we now know that premise to be more or less correct. It is worth remembering that during much of the Bronze Age period climatic conditions in the UK and Europe as a whole were much warmer than those we currently experience, allowing expansion and exploration northwards, although this trend was reversed during much of the cooler Iron Age period. As soon as mankind adopted an agrarian lifestyle however, having some understanding of the patterns of the weather became essential for crop cultivation. If the crops failed because of drought or flooding, then the villagers would starve.
_
Weather has always played an important role in people’s lives, and attempts to predict weather changes were made early on. For a very long time, forecasts were based on observations of the skies both during the day and at night. From the 17th century onwards, scientists were able to measure factors related to weather such as pressure and temperature. This helped them understand the atmosphere and its processes better, and they began to collect weather observation data systematically. By the end of the nineteenth century, several European countries and the United States had established the first weather services.
_______
Ancient forecasting:
Ancient weather forecasting relied on observing natural patterns, animal behavior, and celestial movements long before modern tools were invented.
Atmospheric and Sky Observations:
- Cloud patterns: Dark, towering clouds signalled storms, while wispy “mares’ tails” indicated rain within three days.
- Optical phenomena: Rings or halos around the sun and moon served as early warnings for approaching rain or snow.
- Sky colors: A red sunrise often warned of incoming rain, whereas a red sunset pointed to clear, calm weather.
Bio-Indicators (Flora and Fauna):
- Animal behavior: Unusual movements or frantic activity from insects like dragonflies, ants, and termites, or changes in livestock and bird habits, indicated shifts in humidity and pressure before a storm.
- Plant reactions: Certain trees and grasses, such as the Pipal or specific local flora, showed visible changes in leaf orientation or moisture absorption ahead of rainfall.
Astrological and Calendar Methods:
- Planetary alignments: Civilizations like the Babylonians and ancient Indian astronomers tracked planetary positions (such as Venus, Mars, and Jupiter) and lunar constellations (Nakshatras) to forecast monsoons and major seasonal floods.
- Almanacs and Panchangs: Traditional practitioners used indigenous calendars and astronomical tables (Bhoum and Antariksh methods) to compute long-range seasonal expectations based on generational records. Bhouma derived from Bhumi meaning Earth. Rainfall can be predicted fairly accurately by looking at the nature surrounding us. Kanani et al., (2002) reviewed the various techniques of rainfall prediction based on observations taken by farmers. The word Antariksha means sky. Thus, this method deals with observations to be made of the sky. Bhadali described ten ‘chieftains’ (variables) responsible for the development of ‘ethereal embryo’ of rains. (i) Wind, (ii) clouds, (iii) lightning, (iv) colour of sky, (v) rumbling, (vi) thunder, (vii) dew, (viii) snow, (ix) rainbow and (x) occurrence of orb around the moon and sun.
_
The biological indicators of monsoon have also been well documented and are extensively used by local experts. Kanani et al. (1995) documented various tree species that have been used as indicators of monsoon by local communities. For example, the plant Cassia fistula flowers in abundance 45 days before the onset of monsoon. Pisharoty (1993) reported that the tree Amaltas or golden shower tree (Cassia fistula) is a unique indicator of rain. It bears bunches of golden yellow flowers in abundance about 45 days before the onset of monsoon. Kanani et al., (2005) found that there was a difference of -3 to 7 days between actual date of onset of monsoon and that predicted at Junagadh based on flowering of Amaltas during 1996-2003. Appearance of good foliage of Darbha grass, Pipal tree (Ficus religiosa) indicate adequate monsoon. But good foliage of Bael (Aegle marmelos), Khejro (Prosopis cineraria) indicate drought condition.
_
Observations on the behavior of specific birds and animals have also been used as indicators of rain, as reported by Savalia et al., (1991) and Golakia (1992). Sighting chatura (Dragon fly) means that monsoon is over. A Sparrow bathing in dust indicates good rain in coming season. If a chameleon climbs a tree and assumes black-white-red colors, immediate rain is sure to follow. If crows cry during night, severe drought is indicated. Kanani et al., (2002) enlists the behavior of birds and animals indicating rainfall pattern. Mishra (1998) found that bio indicators are those living beings/biotic agents which change their behaviour with any change in the surrounding environment / weather.
______
Early Forecasting:
It is not known when people first started to observe the skies, but at around 650 BC, the Babylonians produced the first short-range weather forecasts, based on their observations of the stars and clouds. The Chinese also recognised weather patterns, and by 300 BC astronomers had developed a calendar which divided the year into 24 festivals, each associated with a different weather phenomenon. Generally, weather was attributed to the vagaries of the gods, as the wide range of weather gods in various cultures, for example the Egyptian sun god Ra and Thor, the Norse god of thunder and lightning, proves. Many ancient civilisations developed rites such as rain dances and animal sacrifices in order to propitiate the weather gods.
_
Two centuries later, Aristotle wrote Meteorologica around 340 B.C., the first systematic attempt to explain weather through natural causes rather than the actions of gods. He proposed that the atmosphere was driven by two types of evaporation: a moist one that produced rain and a dry one that generated wind, thunder, and lightning. He even argued that earthquakes came from dry exhalation trapped underground. His framework was wrong in many specifics, but it introduced a crucial idea: weather follows physical rules that can be studied and, eventually, predicted. That text dominated Western thinking about the atmosphere for nearly 2,000 years. Many of his observations were — in retrospect — surprisingly accurate. For example, he believed that heat could cause water to evaporate. But he also jumped to quite a few wrong conclusions, such as that winds form “as the Earth exhales”, which were rectified from the Renaissance onwards.
Throughout the Middle Ages and beyond, the Church was the only official institution that was allowed to explain the causes of weather, and Aristotle’s Meteorologica was established as Christian dogma. Besides, weather observations were passed on in the form of rhymes, which are now known as weather lore. Many of these proverbs are based on very good observations and are accurate, as contemporary meteorologists have discovered.
_____
Instruments Change Everything:
For millennia, forecasting relied entirely on human senses and folk wisdom. That changed in the 1600s with two inventions. Galileo contributed early work on measuring the weight of air (published in 1638), and in 1644, Evangelista Torricelli built the first mercury barometer. Torricelli filled a glass tube with mercury, inverted it, and watched the column settle at a height supported by the pressure of the surrounding air. His famous insight: “We live submerged at the bottom of an ocean of the element air, which by unquestioned experiments is known to have weight.”
This was transformative. For the first time, people could measure an invisible atmospheric property, air pressure, and track its changes. Just four years later, in 1648, Blaise Pascal demonstrated that barometric pressure drops with altitude, confirming that the barometer was genuinely measuring the atmosphere and not some quirk of the apparatus. With instruments like the barometer and thermometer, weather observation shifted from subjective description to quantitative measurement. You could now record conditions as numbers, compare them across locations, and start building a real science. By the end of the Renaissance, scientists realised that it would be much easier to observe weather changes if they had instruments to measure fundamental quantities in the atmosphere such as temperature, pressure and moisture.
_
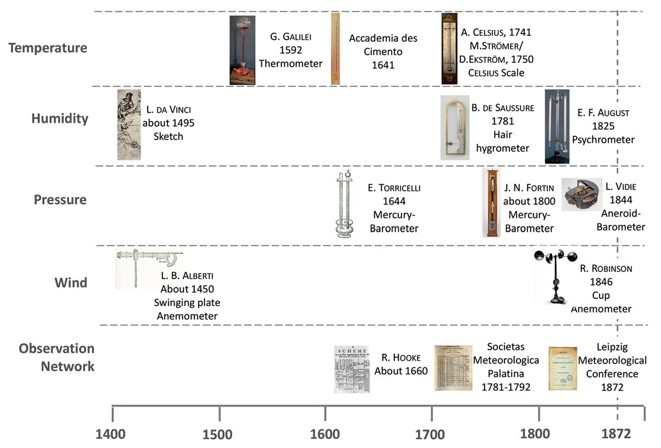
Figure above shows Chronology of the development of meteorological measuring instruments (it is indicated when these instruments could be considered functional in today’s sense) and measuring programs. The miniaturized illustrations are taken from Körber (1987) and Foken (2021).
_
The Telegraph and the First Forecasts:
Instruments could measure the weather, but they couldn’t communicate it fast enough to matter. A barometer reading from a city 200 miles away was useless if it arrived by horse three days later. The electric telegraph solved this. In 1849, the Smithsonian Institution began collecting wind and weather observations via telegraph from stations across the United States, compiling the data into weather maps. For the first time, forecasters could see a snapshot of conditions across a wide region in near-real time.
This capability made public forecasting possible. In Britain, Vice-Admiral Robert FitzRoy (best known as captain of the HMS Beagle during Darwin’s voyage) wrote the first public weather forecast, published for July 31, 1861. He established a regular public forecast service the following month through what would become the Met Office. FitzRoy’s forecasts were based on telegraph reports from coastal stations and his own understanding of storm patterns. They were crude by modern standards, but they represented a genuine turning point: weather prediction was no longer a private curiosity. It was a public service.
_
Gradually, scientists began to understand that weather is influenced by large-scale atmospheric processes and that wind and storms for example follow certain patterns. One of the first to study storms was the scientist and politician Benjamin Franklin (1706-1790). His most famous scientific achievement is his work on electricity and lightning in particular, but in fact he was very interested in weather and studied it throughout most of his life. For example, Franklin discovered that storms generally travel from west to east. Many of Franklin’s observations paved the way to a better understanding of climate and the atmosphere, but Franklin was still a natural philosopher at heart, and he was not inclined to clutter his conjectures with a lot of data or mathematics.
______
The Leipzig Meteorological Conference, 1872
One hundred and fifty years ago, a meteorological conference was held in Leipzig as part of the anniversary meeting of the Society of German Natural Scientists and Physicians (Gesellschaft Deutscher Naturforscher und Ärzte), founded in Leipzig in 1822. This meeting, intended as a preparatory meeting for the 1st International Meteorological Congress held in Vienna a year later, ultimately laid the foundation for today’s World Meteorological Organization. The organizers of the Leipzig Conference (was held on 14–16 August 1872) were the German Carl Christians Bruhns (1830–1881), the Austrian Carl Jelinek (1822–1876) and the Swiss Heinrich von Wild (1833–1902). The discussions at the conference were conducted on the basis of a catalogue of 26 questions on the most pressing issues of the use of measuring instruments, observation periods, and data exchange that were sent together with the invitation. The main concern here was to enable consistency between individual states.
On the 40th anniversary of the founding of the World Meteorological Organization (WMO) in 1990, the importance of this conference was acknowledged: “The achievements of the Leipzig Conference were twofold. It brought together most of the world’s foremost meteorologists who were able, in large measure, to reach agreement on standardized methods of observation and analysis, including the use of a single set of symbols. It also prepared the way for holding, in Vienna in the following year, the First International Meteorological Congress” (Ashford etal., 1990).
_______
Predicting the weather was still pigeonholed as a pipe dream and any serious scientist would engage in studying weather phenomena only in their spare time, if at all. All conjectures and theories on weather were based solely on observations and it was not until the early 20th century that mathematics and physics became part of meteorology. However, by the mid-eighteenth century, governments in various European countries and in the United States realised that accurate weather forecasts can considerably help to save money and even lives. Consequently, the first weather services were established.
________
Establishing Weather Services:
One of the first weather observation networks, which operated from 1654 to 1670, was established by the Tuscan nobleman Ferdinand II. More than 100 years later, the Palatine meteorological society (Societas Meteorologica Palatina) installed a first global weather archive. For fifteen years (1780-1795), weather stations, spread across Northern America, Europe and Russia, collected meteorological data three times per day, using standardised equipment. The society did not produce any forecasts; one of the main obstacles for this was that the data had to be sent to the society’s main office by boat and post coaches, which took weeks.
_
The invention of the electrical telegraph in 1837 by Samuel Morse facilitated the production of weather forecasts, as data and any other weather observations now could easily and swiftly be transmitted to another country and even to another continent. Observation wards began to appear all over Europe and Northern America, but it was not until the Crimean War (1853-1856) that people realised the benefits of weather forecasts. The fleet of the Ottoman Empire was surprised by a low-pressure system and, as a result, lost several ships. The French Emperor Napoleon III later ordered that the weather for that day should be analysed; he learned that the storm could have been predicted and that warnings could have been transmitted by telegraph. Hence, the loss of the ships could have been prevented.
_
Meteorologists had begun to map data from various observation stations, such as temperature and humidity, onto weather charts (see figure below).
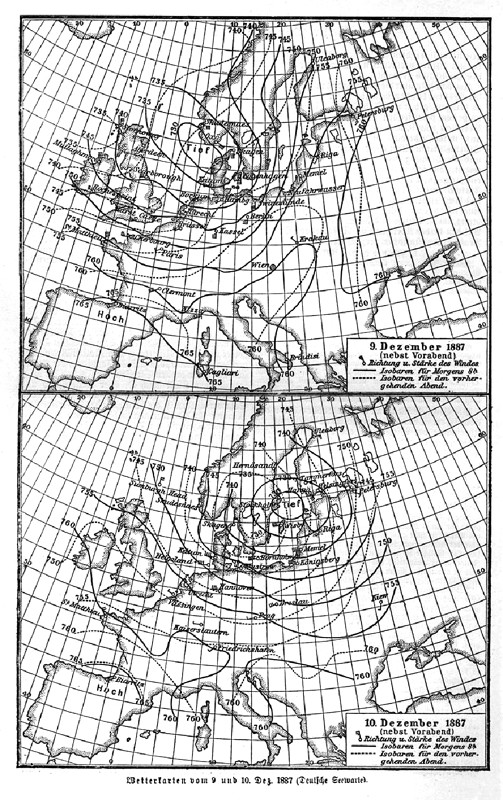
Figure above shows Weather maps for Europe, 09 and 10 December 1887.
These weather maps enabled the scientists to detect and study storm systems and wind patterns as well as comparing the current meteorological situation to past ones, which ultimately led to the production of forecasts. This method, based on the analysis and comparison of many standardised observations taken simultaneously, is called synoptic weather forecasting. It is still used today by weather services both as a starting point for and as an addition to numerical models.
Several European governments and later also the US government realised that timely storm warnings could prevent ship losses. Consequently, storm-warning systems were installed. The British Meteorological Department issued regular gale warnings from 1861 onwards; the first US storm-warning system began to operate ten years later, dwarfing the European services with its size and funds. These institutions went on to produce general weather forecasts.
_______
In the 1920s, weather maps became much more detailed due to the invention of the radiosonde: a small lightweight box containing measurement equipment and a radio transmitter. It is attached to a hydrogen-filled weather balloon that can ascend to up to 30 km before bursting. The radiosonde transmits humidity, pressure, temperature, and wind speed measurements to a ground station. Of course, radiosondes and weather balloons have been improved substantially over the last 80 years, but even the early models allowed meteorologists to observe weather conditions in high altitudes.
Modern weather services depend on observations transmitted both by radiosondes and by satellites. The first weather satellite, TIROS 1 (Television and Infrared Observation Satellite) was launched in 1960. Satellites collect data, similarly to radiosondes, but they have the great advantage that they can cover areas difficult to access such as oceans and deserts. Today, both polar orbiting satellites (at an altitude of 800-900 km; they revolve around the Earth following the degrees of longitude, passing over both poles) and geostationary satellites (at an altitude of 35,800 km directly above the equator; they travel in time with the Earth’s rotation, thus constantly observing the same area) are used.
Weather radar was discovered accidentally during World War II when military radar operators noticed that atmospheric precipitation (rain, snow, and storms) created unwanted “clutter” or echoes on their screens, masking potential enemy aircraft. Operators initially viewed weather returns as interference. Soon after, scientists and radar operators realized these signals corresponded to storms and rainfall. Militaries and weather bureaus began using surplus radar hardware (such as SCR-584 sets) to track storms and map precipitation zones systematically. Later advancements introduced Doppler capabilities, allowing meteorologists to measure not just the location of precipitation, but also its velocity and wind speeds moving toward or away from the radar. Modern systems utilize horizontal and vertical electromagnetic (dual polarization) pulses to determine the exact size, shape, and type of precipitation (rain, hail, or snow).
Still, what improved weather forecasting much more than new observation tools, was implementing a new forecasting method called numerical weather prediction.
________
Numerical Weather Prediction:
Both the financial significance of weather forecasts and the necessity of knowing more about atmospheric processes were understood fairly soon after the first gale warnings were published, but very few people realised that mathematics could be used to describe these processes and produce more accurate forecasts than synoptic meteorology ever could. In the early 20th century, scientists, in particular Vilhelm Bjerknes and Lewis Fry Richardson, pioneered numerical weather forecasting, which is based on applying physical laws to the atmosphere and solving mathematical equations associated to these laws. The discovery of chaos theory and not least the development of computers greatly improved the quality of forecasts. Today, meteorologists constantly refine the various forecasting models designed by the world’s leading weather services.
_
Finding the Maths:
The first mathematician who thought of applying mathematics to weather forecasting was the Norwegian Vilhelm Bjerknes (1862-1951). Already at a young age, Bjerknes engaged in mathematics as he assisted his father with his research in hydrodynamics. He then studied mathematics and physics at the University of Christiania (nowadays Oslo). In 1898 he formulated his circulation theorem: in a nutshell, it explains the evolution and the subsequent decay of circulations in fluids. Possibly even more importantly, the theorem also marks “the move of Vilhelm Bjerknes into meteorology”. Combining his circulation theorem with hydrodynamics and thermodynamics, Bjerknes discovered that, given initial atmospheric conditions, it is possible to compute the future state of the atmosphere using mathematical formulae.
As he put it himself:
We must apply the equations of theoretical physics not to ideal cases only, but to the actual existing atmospheric conditions as they are revealed by modern observations. …From [these] conditions … we must learn to compute those that will follow.
During a visit to the United States in 1905, he presented his theories. The Carnegie Foundation was so impressed by his ideas that it funded Bjerknes’s research for the next 36 years. Bjerknes founded the Bergen Geophysical Institute, also known as the Bergen School, which would make several important contributions to modern meteorology. Together with his son Jacob, who became a famous meteorologist himself, and meteorologists Tor Bergeron and Halvor Solberg, he discovered that weather patterns are closely associated with so-called fronts, i.e. transition zones between warm and cold air masses, and described the life cycle of mid-latitude cyclones. Most of Bjerknes’s important results were published in On the Dynamics of the Circular Vortex with Applications to the Atmosphere and to Atmospheric Vortex Wave Motion in 1921.
_
Bjerknes’ equations were very complicated and not very practical for predicting the weather as they required immense computational power, a fact of which he was aware himself. Nevertheless, he firmly believed that one day, meteorology would be a proper science and weather forecasts based on solving mathematical equations would be feasible:
The first attempt to use mathematics in order to predict the weather was made by the British mathematician Lewis Fry Richardson (1881-1953), who simplified Bjerknes’ equations so that solving them became more feasible. Richardson, who had studied a number of sciences at both Newcastle University and the University of Cambridge, worked in the British Meteorological Office from 1913 until 1916. He also worked for the National Peat Industries for some time, and in order to solve differential equations modelling the flow of water in peat, he invented his method for finite differences, which produces highly accurate results. Basically, this method allows finding approximate solutions to differential equations. A differential equation with a smooth variable is converted into a function (or an approximation thereof) that relates the changes of the variable and given steps in time and/or space, meaning that the changes are calculated at discrete points rather than at infinitely many points. Then the derivatives in the differential equation are replaced by finite difference approximations. So in the place of the differential equation, you get many equations which can be solved using arithmetic.
_
Finite difference methods are widely used nowadays, but in Richardson’s days, other mathematicians considered the method to be “approximate mathematics”. Nevertheless, when Richardson came across problems of the dynamics of the atmosphere at his work at the Meteorological Office, he decided to solve them using his method. He remodelled the fundamental equations describing atmospheric processes such that it was possible to solve them numerically. By dividing the surface of the Earth into thousands of grid squares, and the atmosphere into several horizontal layers, he obtained a large number of grid boxes, connected to one another by mathematical equations. Fundamentally, Richardson applied Bjerknes’ vision of calculating the future state of the atmosphere using observations of its current state to the grid and added to it the idea that there is a connection between the grid boxes.
_
Richardson imagined a “forecast factory” where thousands of human computers would be seated on galleries along the walls of a huge hall. Each computer would be responsible for calculating the changes in the atmosphere for discrete points in one grid box. In the centre of the room, there was to be a pulpit with a “conductor” who would make sure that the computers all worked at uniform speed, in time with each other. The calculations would be collected as soon as they were finished in order to be transmitted to a radio station. Richardson also included a research department in charge of refining the models. This forecast factory is “remarkably similar to descriptions of modern multiple-processor supercomputers used in weather forecasting today”. In Richardson’s days, however, all the computations had to be done manually, and he estimated that his factory would need 64,000 human computers to master the mammoth task of calculating the weather in time with the weather actually happening.
_
Richardson’s theories were not put into practice again until the mid-1940s, when a team of scientists at the Institute for Advanced Study in Princeton developed the world’s first computers. Meanwhile, the groundbreaking research of meteorologists such as Jacob Bjerknes (1897-1975) and Carl-Gustaf Rossby (1898-1957) furthered scientists’ knowledge of the atmosphere and helped pave the way for the eventual triumph of numerical weather forecasting. The work of Vilhelm Bjerknes and Richardson had divided the meteorological world into two camps: one camp defended the old method of comparing the current state of the atmosphere with past observations; the other camp campaigned for the use of physics in weather forecasting.
A turning point was the 6th of June 1944: D-Day. For the invasion of Normandy to be a success, the commanders of the Allied forces wanted certain weather conditions (clear enough skies, relatively calm winds). Their requirements for the tide and the moon phase restrained the time span in which to undertake the invasion to early June; the exact day should be determined on the basis of weather forecasts. The commanders had employed advocators of the two opposing schools of thought in weather forecasting: the Scottish meteorologist James Stagg, a disciple of the Bergen School, and the American Irving Krick, whose reputation as a forecaster mainly stemmed from his talent for selling himself. Throughout May 1944, the weather had been calm, and Krick, having studied old weather maps, predicted that the conditions would not change. Meanwhile, James Stagg saw heavy storms coming in from the Atlantic. The only day with conditions good enough for the invasion was 6th June. The commanders decided to trust James Stagg’s forecast, thereby demonstrating a great deal of trust in science.
D-Day not only changed world history, it also highlighted the importance of weather forecasts. Soon after the Second World War, American scientists used the world’s first computers to predict the weather. Other groundbreaking research results, be it the formulation of chaos theory, be it the invention of computers, significantly changed weather forecasting. Thus, numerical weather prediction began to conquer the world.
________
Chaos and Computers:
John von Neumann was one of the leading mathematicians of the twentieth century. He made important contributions in several areas: mathematical logic, functional analysis, abstract algebra, quantum physics, game theory, and the development and application of computers. In the mid-1930s von Neumann became interested in turbulent fluid flows. He saw that progress in hydrodynamics would be greatly accelerated if a means for solving complex equations numerically were available. It was clear that very fast automatic computing machinery was required. According to Thompson (1983), von Neumann regarded weather prediction by numerical means as “the most complex, interactive, and highly nonlinear problem that had ever been conceived of—one that would challenge the capabilities of the fastest computing devices for many years.” Indeed, weather forecasting has remained a grand challenge for computing ever since.
_
Charney became one of the leading scientists in von Neumann’s Meteorology Project at the Institute for Advanced Study in Princeton. The team developed their own computer, but ended up using the ENIAC (Electronic Numerical Integrator and Computer), which belonged to the U.S. Army, for their first forecast because their computer was not yet ready. In 1950, the ENIAC successfully produced a 24-hour forecast. This took about 24 hours, but the computer developed by von Neumann’s team was much faster (this computer produced its first forecast in 1952), and from 1955 onwards, numerical forecasts generated by computers were issued on a regular basis. At first, experienced human forecasters were sceptical about the quality of these forecasts, which admittedly were not as good as forecasts made by humans, but the rapid development of computers and hence their speed dramatically improved forecast quality.
_
The prerequisite for computer-generated forecasts was to simplify the full primitive equations that govern the atmosphere, as the early computers were unable to deal with all the equations included in Richardson’s model. In 1948, Charney developed the quasi-geostrophic approximation, which reduces several equations of atmospheric motions to only two equations in two unknown variables. These equations are much easier to solve and could be handled by the early computers. Geostrophic winds are hypothetical winds for which the balance between the pressure-gradient force and the Coriolis effect is exact. In Charney’s approximation, winds are assumed to be almost geostrophic.
Furthermore, this approximation filters out all but the slow long-wave motions that are important in meteorology, so that you do not have to solve the primitive equations for acoustic and gravity waves as Richardson did 30 years earlier. Although the computers were fed with simplified equations only, the limited computer power demanded a barotropic (i.e. single-layer) model of the atmosphere. Further research, both in meteorology and in computer science, finally allowed the application of baroclinic (i.e. multi-layer) models. In 1963, a six-layer model based on the primitive equations was used for producing a forecast. Since then, as computer power increased, the models have constantly been refined (meaning that more layers, a finer grid, more equations, topography and landscape characteristics were included). This dramatically increased both the forecast accuracy and quality.
_
Today, the world’s leading meteorological centres use the most powerful computers on the planet; the new computer at the British Met Office for example is capable of 125 trillion calculations per second. Meteorologists were thrilled by the possibilities that seemed to open up due the use of computers in weather forecasting, and were convinced that it would only be a matter of time before man could not only accurately predict, but also control the weather. The discovery that the atmosphere is chaotic, by MIT researcher Edward Lorenz (1917-2008) in 1961, came as a serious blow to all these high-flying ideas. As opposed to other meteorologists at the time, Lorenz did not predict the weather, but investigated how predictable it is, in other words, if there are periodic patterns (the existence of patterns would have supported the belief of some old-school meteorologists that weather forecasting based on the study of past weather events yields accurate results). For this he ran a shortened forecasting model on his computer, and to his great surprise, inputting data that differed from previously entered values only in the fourth decimal place, significantly changed the weather the computer predicted. Lorenz reasoned that the dynamical equations that describe the atmosphere are exceedingly sensitive to initial conditions. Dynamical equations are deterministic; meaning that given initial conditions, they determine how the process they describe will evolve in the future. But, in the case of the atmosphere (and many other systems as well, chaotic behaviour can be found in every branch of science), you need to enter the exact same data as initial conditions in order to get the same results if you run the model several times. Even seemingly minuscule differences in the initial conditions result in highly different outcomes. A very simplified example for chaotic behaviour is the trajectory of a paper aeroplane: Imagine you throw a paper aeroplane in a similar manner and in the same direction say ten times. Every time, the trajectory of the plane will be different, because you will never be able to throw the plane in the exact same manner twice: the force you exert or the way you hold the plane in your hand when throwing it will differ ever so slightly from throw to throw, resulting in very different, unpredictable flights. Chaotic behaviour is commonly known as the “butterfly effect”, a term coined due to the title of a talk Lorenz gave in 1972: Predictability: Does the Flap of a Butterfly’s Wings in Brazil Set Off a Tornado in Texas? Meteorologists had presumed that small weather changes in some specified places would affect the weather in other places, but after Lorenz’s discovery, they had to accept that it did not matter if a butterfly flapped its wings in Brazil, or Bulgaria, or Bangladesh, the result might still be a tornado in Texas (or somewhere else for that matter). This, combined with the fact that observations of the atmosphere are usually slightly erroneous, meant that long-range forecasts would not be possible, as the small errors would build up very quickly and change the outcome considerably. Lorenz believed that weather could not be forecast accurately for more than about two weeks. Modern forecast models allow for the chaotic nature of the atmosphere by a process called ensemble forecasting, meaning that the model is run several times, each time with slightly different initial conditions. The results are then averaged out to give a forecast.
______
Only fifty years ago, weather forecasting was an art, derived from the inspired interpretation of data from a loose array of land-based observing stations, balloons, and aircraft. Since then, it has evolved substantially, based on an array of satellite and other observations and sophisticated computer models simulating the atmosphere and sometimes additional elements of the Earth’s climate system. All this has been made possible by advances in satellite technology, a sweeping acceleration in worldwide communications, and overwhelming increases in computing power.
______
The First TV Forecasters:
The idea of personalised weather forecasting on BBC Television was first raised at an executive lunch in 1953. The BBC’s then Director-General, Sir Ian Jacob, noted that “a young but highly professional meteorologist who was in the party” had made the point that it would be better if, instead of just weather maps and charts, the forecaster himself appeared on screen. Within a year, the anonymous young man’s idea had become a reality … with the help of “an easel and treatment to walls for background” at a cost of £50. On January 11, 1954, George Cowling of the Met Office became the first person to present a weather forecast on British television. The broadcast was live and lasted for five whole minutes.
_______
Current Research:
To get to the point, most of today’s research in meteorology is devoted to improving current forecasting models. This involves the use of enhanced observation and measurement techniques as well as refining the mathematical models. Several ways to improve forecast quality are already known in theory, but they cannot be implemented due to a lack of computer power. The fastest computers in civilian use are already used by the leading weather services, meaning that many weather services, especially in developing countries, have to resort to much slower computers. Since the 1960s, when issuing numerical weather forecasts calculated by computers on a regular basis begun, forecast accuracy has been accompanied by the development of faster computers, and it seems that this will be the case for the foreseeable future.
_
One of the easiest ways to increase the quality of weather predictions is to increase the orders of the numerical approximations to partial differential equations. Most schemes used in current models are of second order, but using third-order schemes would greatly improve forecast accuracy. In addition, both data collection and data assimilation are constantly improved. Thereby, the initial conditions entered into forecasting models represent the actual state of the atmosphere more accurately, which leads to better forecasts.
_
More detailed and more accurate mathematical methods as well as increased computer power will allow meteorologists to increase the resolution of their grids. A finer resolution will in turn allow them to take local weather phenomena such as thunderstorms as well as the effects caused by topographic features such as mountains and lakes into account. Ultimately, this will result in very detailed forecasts — so meteorologists hope — for very small specific regions. Most models include as many topographical features as possible, but there is a new grid model using horizontal planes cutting through mountains, permitting a more accurate representation of the equilibrium of the atmospheric forces in the proximity of mountains. Admittedly, increasing the grid resolution involves the risk that errors in the initial data are multiplied when more grid points are used, so mathematical models will have to take this into account.
_
Apart from increasing the grid resolution, meteorologists also work towards increasing the time span for which forecasts can be made. The two weeks limit conjectured by Lorenz still stands; currently the achievable limit is considered to be about ten days. In February 2010, the ECMWF successfully produced accurate ten-day forecasts for the first time ever. The accuracy of a medium-range forecast is measured in terms of the anomaly correlation coefficient (ACC), which has to be above 60% in order for a forecast to be considered accurate. The February 2010 forecasts of the ECMWF were consistently above this limit.
_______
_______
Section-7
Introduction to Weather Forecasting:
It is one of the most common topics of conversation, it has influenced people’s lives for thousands of years, and predicting it requires the most powerful computers on the planet: the weather. Most ancient cultures include weather gods, and weather catastrophes have an important role in creation myths of many cultures, for example the Deluge described in the Bible. Observing the skies and drawing the correct conclusions from these observations was crucial to people’s survival. Nowadays, we are more independent of weather conditions due to central heating, air conditioners, greenhouses and so forth, but weather forecasts are more accurate than they ever were. Forecasts, both for the next couple of hours and for the next couple of days, are issued daily. Apart from helping people decide when they should invite their neighbours for a barbecue, weather forecasts provide vital information for a wide range of occupational categories such as farmers, pilots, sailors and soldiers. Furthermore, thanks to forecasts, people are less likely to be surprised by severe weather; and people suffering from hay fever for example can time their outdoor activities according to pollen flight forecasts. The great success of the weather channel in U.S. television and the fact that weather reports often have a higher audience rate than the preceding news broadcasts, illustrate that forecasting has become a highly competitive business.
_
Weather forecasting is the application of science and technology to predict the state of the atmosphere in a particular location. Weather forecasts are made by collecting quantitative data about the current state of the atmosphere by using scientific understanding of atmospheric processes to project how the atmosphere will change. Weather forecasting is the process of making predictions of the future based on past and present data and analysis of trends. The weather forecasting is the single most important practical reason for the existence of meteorology as a science. Weather forecasting offers multi-faceted benefits to government, civil society, defence forces, industrial organizations, agricultural institutions and mass media.
_
At its core, weather forecasting is the process of predicting atmospheric conditions at a specific location and time. It combines observation, data modeling, and analysis to estimate future weather patterns such as temperature, rainfall, and wind behavior. Meteorologists, the scientists responsible for these predictions, analyze atmospheric data gathered by satellites, aircraft, and ground sensors. Their work underpins everything from local rain forecasts to global climate projections. While daily forecasts help individuals plan activities, long-range predictions support sectors like agriculture, energy, and logistics in managing risk. The scope of meteorology science extends far beyond telling whether it might rain tomorrow. It provides a crucial framework for understanding climate behavior, identifying trends, and improving resilience to natural hazards.
_
Accurate weather prediction starts with comprehensive data collection. Every day, thousands of weather stations and ocean buoys transmit information about variables such as air pressure, humidity, and temperature. These measurements, combined with satellite imagery, create a detailed snapshot of Earth’s atmosphere at any moment. The next step involves analyzing this data through numerical weather prediction models, massive mathematical systems that simulate atmospheric movement. Supercomputers run these models continuously, comparing current readings with historical patterns to estimate how weather systems will evolve. Once the models generate outputs, meteorologists evaluate different scenarios, test their consistency, and refine results. For example, tracking a tropical storm involves monitoring sea surface temperatures, wind shear, and atmospheric pressure changes. Each update helps forecasters anticipate the storm’s possible path and intensity, ensuring that communities receive timely alerts. Though automated systems power much of today’s forecasting tech, human expertise remains vital. Meteorologists interpret raw data, recognize anomalies, and account for local factors that models may overlook, such as coastal moisture patterns or topographical influences.
_
Weather forecasting is the science of predicting atmospheric conditions at a specific time and place. From daily temperature forecasts to severe storm warnings, modern forecasting combines observation, physics, and advanced computer models to provide accurate predictions. Understanding how forecasts are made helps explain why they are sometimes highly accurate—and other times uncertain. Modern weather forecasting is no longer based solely on observing clouds or atmospheric conditions. It combines numerical weather prediction (NWP), AI meteorological models and the expertise of professional forecasters. For short- to medium-range forecasts covering one to 14 days, forecasters usually compare outputs from multiple numerical models before making final assessments. For the prediction of evolving weather within three hours, they rely more on multi-source observational data from radars, satellites, high-density automatic weather stations and wind profilers, with data updated at minute- or even second-level intervals. Unlike traditional numerical models, which simulate the atmosphere by solving complex physical equations on three-dimensional grid points, AI models learn patterns from vast amounts of historical weather data. Once trained, they can generate forecasts in minutes instead of hours of calculations.
________
The synoptic method of forecasting consists of the simultaneous collection of weather observations, and the plotting and analysis of these data on geographical maps. An experienced analyst, having studied several of these maps in chronological succession, can follow the movement and intensification of weather systems and forecast their positions. This forecasting technique requires the regular and frequent use of large networks of data. The synoptic forecasts are limited because they are almost exclusively based upon surface observations. The stratosphere, a layer of air generally located above levels from 9 to 13 km (5.5 to 8 mi) and characterized by temperatures remaining constant or increasing with elevation, acts as a cap on much of the world’s weather. A trackable instrument suspended beneath a rubber balloon (the radiosonde) is deployable from a network of stations. The tracking of the balloon allows for wind measurements to be taken at various elevations throughout its ascent. A network of these upper-air stations around the world reports observations frequently. Satellite measurements and aircraft observations supplement the radiosonde network and are utilized to improve the analysis and tracking of weather systems.
The basic laws of hydrodynamics and thermodynamics can be used to define the current state of the atmosphere, and to compute its future state. This concept marked the birth of the dynamic method of forecasting, though its practical application was realized only after 1950, when sufficiently powerful computers became available to produce the necessary calculations efficiently. The first conceptual model of the life cycle of a surface cyclone showed that cyclonic storms typically formed along fronts, that is, boundaries between cold and warm air masses. The model showed that precipitation is associated with active cold and warm fronts, and that this precipitation wraps around the cyclone as it intensifies. Though subsequent work demonstrated that fronts are not crucial to cyclogenesis, the Norwegian frontal cyclone model is still used in weather map analyses.
Though numerical forecasts still continue to improve, statistical forecast techniques, once used exclusively with observational data available at the time of the forecast, are also used in conjunction with numerical output to predict the weather. Statistical methods, based upon a historical comparison of actual weather conditions with large samples of output from the same numerical model, routinely play a role in the prediction of surface temperatures and precipitation probabilities.
The recognition that small, barely detectable differences in the initial analysis of a forecast model often lead to very large errors in a 12–48-h forecast led to the development of ensemble forecasting. This method uses results from several numerical forecasts to produce the statistical mean and standard deviation of the forecasts. Success with ensemble forecasting suggests it can be a useful tool in enhancing prediction skill and in assessing the atmosphere’s predictability.
The best weather forecasts result from application of the synoptic method to the latest numerical and statistical information. The forecaster has an ever-increasing number of valuable tools with which to work. Numerical forecast models are capable of explicitly resolving mesoscale weather systems. Geostationary satellites allow for continuous tracking of such dangerous weather systems as hurricanes. The increased routine use of Doppler radar, automated commercial aircraft observations, and use of data derived from wind and temperature profiler soundings has added capability to tracking and forecasting mesoscale weather disturbances. Very high-frequency and ultrahigh-frequency Doppler radars may be used to provide detailed wind soundings. These wind profilers, if located sufficiently close to one another, allow for the hourly tracking of mesoscale disturbances aloft. Ground- and satellite-based microwave radiometric measurements are being used to construct temperature and moisture soundings of the atmosphere. The assimilation of such data at varying times in the numerical model forecast cycle offers the promise of improved prediction and improved utilization of data and products by forecasters, assisted historically by increasingly powerful interactive computer systems. Medium-range forecasts, ranging up to two weeks, may be improved from knowledge of forecast skill in relationship to the form of the planetary-scale atmospheric circulation.
________
The World Meteorological Organization (WMO) is the specialized United Nations agency coordinating global weather, climate, and water forecasting standards worldwide. World Meteorological Organization (WMO) coordinates national networks and official data sharing across 193 member states.
World Weather Information Service is official portal hosting official forecasts from national agencies globally.
Major National & Regional Agencies:
India: India Meteorological Department (IMD) handles national forecasting, warnings, and specialized regional bulletins.
United States: National Weather Service (NWS) under NOAA provides nationwide public warnings and data.
United Kingdom: Met Office delivers official national severe weather warnings and climate research.
Europe: European Centre for Medium-Range Weather Forecasts (ECMWF) produces leading global numerical weather prediction models.
Australia: Bureau of Meteorology (BOM) manages national weather, oceanographic, and water services.
Japan: Japan Meteorological Agency (JMA) issues advisories, earthquake reports, and regional typhoons warnings.
Global private entities include The Weather Company and AccuWeather.
__
Modern forecasting depends on a sophisticated web of tools that gather, process, and visualize vast environmental datasets. Key components include:
- Satellites: Orbiting above Earth, they capture cloud movements, ocean temperatures, and atmospheric moisture content.
- Doppler Radar: Measures the velocity and direction of precipitation, crucial for tracking storms and identifying severe weather such as tornadoes.
- Supercomputers: Process trillions of calculations per second, enabling detailed simulations of temperature, pressure, and wind dynamics.
- Artificial Intelligence Models: Recent innovations in forecasting tech use machine learning to identify subtle patterns, helping refine predictions and reduce errors.
In addition, Internet of Things (IoT) devices, such as connected sensors on vehicles or smartphones, supplement traditional networks by providing real-time, localized weather data.
Cloud computing platforms allow for faster model sharing among research institutions, while visualization software presents results through interactive charts and maps accessible to the public.
Together, these technologies turn raw atmospheric data into actionable insights that guide industries, emergency services, and everyday decision-making.
________
________
Overview of Weather Forecasting:
All it takes to create weather is air and solar heating. Then things get complicated. Some of the sun’s energy is reflected by clouds; some heats land masses and oceans. Air warmed in the tropics becomes less dense, rises, and heads toward the Poles. Along the way it cools, its freight of moisture condensing into clouds and falling as precipitation. Earth’s rotation causes the air currents to swerve right in the Northern Hemisphere and left in the Southern. Mountain ranges, ocean currents, and the high-altitude jet streams meandering around the globe at 100 to 200 miles per hour or more all shape the broad circulation pattern. Add local variations in temperature, humidity, and pressure, and the result is the weather we feel on the cheek or read in the clouds.
_
Much of the physics involved has been understood for decades, even centuries. Yet those forces combine in so many ways, obeying so many variables, that weather is like a summer cumulus: Its stately progress across the sky seems entirely predictable, but each wisp and tentacle seems to have a life of its own, erratic and seemingly random. To predict what the weather will be, you need to know what it is right now—what meteorologists call current/initial conditions. This is one of meteorology’s toughest tasks. Each day the NWS takes in 192,000 observations from surface stations, 2,700 observations from ships, 18,000 from weather buoys, 115,000 from aircraft, about 250,000 from balloons, and 140 million from satellites. Other data, in countless bytes, arrive from instrument networks abroad. Yet all this isn’t enough.
_
The computer models that are the mainstay of current forecasting require even more data, in tidier form: readings from points on a uniform grid extending around the globe and up into the atmosphere, updated every hour or, better, every minute. That’s unattainable in the real world. Satellites have trouble seeing through thick clouds and can’t map winds in detail. Weather stations, balloons, aircraft, and ships aren’t evenly spaced around the globe, and in many areas—vast swaths of poorer continents such as Africa—ground readings are sparse.
To fill out those observations and create a perfect starting point, meteorologists take their best recent picture of the atmosphere and project it forward in time. The result is a “forecast” of the present, which helps fill the data gaps, completing a snapshot of the current weather at every point on the imaginary global grid. It’s generated with the same computer tools that allow meteorologists to look into the futurean approach called numerical modeling.
_
The time machine is a computer model of the atmosphere, built not from air and water vapor but from data and equations. The equations describe the key processes that govern weather, such as airflow, evaporation, Earth’s rotation, and the release of heat as water condenses or freezes. When meteorologists plug in data on atmospheric conditions, then run the equations, the model predicts how the atmosphere will evolve. It lets forecasters ask: If this is what the atmosphere is doing now, what will it be doing in one minute? And then again one minute after that? You keep taking these baby steps forward in time, solving and re-solving the equations. At each step, the model computes weather conditions at all points on that imaginary global grid. The process lets meteorologists generate a full picture of current conditions, then carry it forward in time to create a forecast. Some models push as far as 16 days into the future, though by that point the accuracy is so diluted that about all they can say is whether the temperature will be above or below the normal monthly average.
_
Yet even the most sophisticated computer models drastically simplify the real atmosphere. Most track conditions at points tens of miles apart, even though actual weather can vary widely within only a couple of miles (three kilometers)—the size of a thunderstorm. The models also have biases: Some do better with hurricanes, while others are better at predicting winter weather, such as ice storms. Forecasters try to compensate by consulting different models, like patients getting second opinions. All that means extra number crunching.
_
Regular PCs or the laptop we use for our day-to-day work aren’t really suited to work on the humongous amount of weather data generated from variegated instruments. Most weather agencies these days use supercomputers with amazing computational prowess. NOAA’s twin WCOSS2 supercomputers (deployed in 2022) can each handle around 12 petaflops, that’s 12 quadrillion floating-point operations per second (1 quadrillion = 10^15). One runs the active forecast, the other handles development and research. These supercomputers have now become crucial to generating global forecasts.
_
Supercomputers are programmed to use mathematical models based on past weather patterns and the geography of that particular region. Mathematical models are in the form of equations that describe key processes regulating weather, such as Earth’s rotation, wind speed, and direction, precipitation, evaporation, etc. When these data points are fed from various measuring instruments and sensors to the supercomputers, they run a set of complicated equations, depending on how it’s being modelled by the meteorologist, and generates a forecast.
The models used for weather forecasting aren’t one-size-fits-all solutions; some are good at predicting hurricanes, while others are good with general temperature and humidity prediction. This is why computers don’t really have the last word. The output from them is converted into user-friendly graphs and charts, which can be then interpreted by meteorologists in the weather agency to make a more comprehensive and informed forecast.
_
Something called the butterfly effect adds to the burden. In 1972 Ed Lorenz, a meteorologist at MIT, used the atmosphere to illustrate chaos theory—the idea that tiny fluctuations can, over time, have outsize effects. He suggested that the gentlest breeze from a butterfly closing its wings on one side of the planet could cause a storm on the other. It’s an exaggeration, with a measure of truth: Factors so small that they get lost—in measurement gaps or errors, or in the models’ shortcuts—can make a major difference in the weather. A small wind shift, for example, might send a storm veering miles from its predicted course. In winter a difference of a fraction of a degree can make all the difference in the world as to whether you get all rain, or all snow, or freezing rain, or sleet. That small difference has a huge impact on millions of people.
_
To address the butterfly effect, forecasters rely on a strategy called ensemble forecasting. Starting with one basic set of initial conditions, they run multiple forecasts—as many as 50 at the European Centre for Medium-Range Weather Forecasts, the world leader in ensemble forecasting. Each begins with a slightly different “perturbation”—a change of a mile an hour in wind, a degree in temperature, a percentage point in humidity. The forecast becomes statistical: In, say, 43 of the 50 computer runs snow develops, while in seven it rains. That’s why so many forecasts use words such as “possible” or “likely,” and speak of the percentage probability of precipitation.
_
Computers don’t have the last word. After the models have their say, their output is converted to user-friendly graphics and, in the U.S., sent to the Hydrometeorological Prediction Center, on the fourth floor of a nondescript building in Camp Springs, Maryland. There flesh-and-blood meteorologists second-guess the machines. Today, numerical predictions in the zero to two-day time frame is essentially perfect. If the forecast says 12 inches (30.5 centimeters) of snow, the actual amount will be in the 10- to 14-inch (28- to 33-centimeter) range.
_
Weather forecasts vary depending on the timescale and purpose:
- Nowcasting: Focuses on real-time updates, covering a few hours ahead. It’s particularly useful for aviation and outdoor events.
- Short-range forecasts: Extend up to three days and form the foundation of most daily reports broadcast online or via mobile apps.
- Medium-range forecasts: Project conditions up to two weeks ahead, combining several model runs to improve accuracy.
- Long-range and seasonal forecasts: Offer insights months in advance, supporting agriculture, water management, and disaster preparedness.
- Specialized forecasts: Serve specific sectors. For instance, marine forecasts help ships avoid rough seas, while agricultural forecasts guide planting schedules.
Advances in meteorology science have made each of these categories more reliable, ensuring that forecasts are tailored to both time sensitivity and regional context.
_
Subordinate Forecasting Methods:
Persistence Method:
- Assumes current conditions will continue
- Works best for short-term forecasts
- Example: A clear day is likely to remain clear
Climatology Method:
- Uses historical weather averages
- Based on long-term patterns
- Example: Expecting warm weather in summer
Analog Method:
- Compares current conditions to past similar situations
- Uses historical outcomes to predict future weather
_
Applications of Weather Forecasting:
Weather forecasting impacts many areas of daily life.
-1. Public Safety
- Severe weather warnings (storms, hurricanes, tornadoes)
- Evacuation planning
-2. Transportation
- Aviation route planning
- Road safety during extreme weather
-3. Agriculture
- Crop planning and irrigation
- Frost and drought predictions
-4. Energy
- Predicting energy demand
- Managing renewable energy sources
_
Forecast accuracy has improved dramatically thanks to better data quality and more advanced modeling. Fifty years ago, predictions beyond three days were often uncertain. Now, five- to seven-day forecasts are relatively dependable, with error margins steadily decreasing.
However, absolute precision remains elusive due to the chaotic nature of Earth’s atmosphere. Small changes in initial conditions, like temperature or humidity, can cascade into major variations in weather outcomes, a concept known as the “butterfly effect.”
Despite advanced technology, forecasting has limitations and several factors influence accuracy:
- Incomplete or imperfect data
- Rapid atmospheric changes
- Small errors that grow over time
- Complexity of weather systems
- Density and quality of observation networks
- Model resolution, which determines how finely atmospheric layers are represented
- Processing power of supercomputers and machine learning systems.
This is why forecasts are often updated frequently. Emerging forecasting tech now leverages artificial intelligence to enhance predictive performance. AI systems can analyze historical trends across multiple regions, identify correlations, and adjust forecast models dynamically. This hybrid human-and-machine approach is helping meteorology achieve its most precise forecasts to date.
_______
_______
Evolving forecast services:
Weather forecasting begins with observing the current state of the atmosphere. From that starting point, forecasters can then predict upcoming changes to the weather in the minutes, hours, days and weeks to come. Sensors on land, sea, in the air and orbiting in space measure a range of weather conditions and provide billions of observations from around the globe that help paint the most complete picture of our planet as possible. Converting the billions of data points collected every day around the globe into reliable forecasts requires an incredible supercomputing capacity to process highly-detailed computer models.
Weather forecasts are becoming more detailed, more accurate and are extending further out in time — providing the information needed to make sound decisions to protect life and property. Technological advances, such as apps, are making weather information more accessible and immediately alerting those in harm’s way.
Before a sun, cloud or rain icon is posted on a website or a text is sent to a mobile phone ahead of dangerous weather, a complex process takes place. It involves the collection and processing of data that yields an understandable and actionable forecast.
As the quantity and quality of observations have improved, as computer modeling has become more detailed, as supercomputing has become more powerful, and as researchers study the mysteries of our weather and climate — so, too, have forecasts improved and will continue to improve.
Hurricanes once surprised people, such as the Hurricane of 1938 that hit Long Island, New York, with no warning. Today, NOAA’s National Hurricane Center is able to issue five-day forecasts for hurricanes such as Katrina and Sandy thanks to better observations, atmospheric computer modeling and the use of satellites that are a forecaster’s “eye in the sky.”
Tornadoes cloaked by the darkness of night or embedded within heavy rain are now revealed by National Weather Service Doppler radar and by its ability to tell the difference between precipitation and debris that’s lofted in the air by a funnel that has reached the ground.
Every advancement in weather forecasting has led to safer travel on roads, in the air, at sea; businesses that can improve safety, productivity, profit; emergency managers that direct residents away from harm; a nation that is more ready, responsive and resilient to natural disasters.
Still, scientists are diligently working to address remaining forecast challenges, such as improving forecasts of rapidly strengthening or weakening hurricanes and extending the lead time for tornado and flood warnings.
_______
_______
Weather forecasting process:
Meteorologists take weather information—some of it highly technical—from many different sources and turn it into a digestible story that people can use to make decisions about their lives. The information and tools meteorologists draw upon to tell the story generally come from three sources: weather observations, computer weather models and meteorological knowledge and experience.
_
Observations:
‘Observations’ are the readings of the weather that we take—not only quantities like air pressure, temperature and rainfall at the surface, but measurements in the upper atmosphere from weather balloons and aircraft, and also data from weather radars and satellites. Together, these observations of many different elements that make up the weather paint a picture of how it has been recently, and how it is right now. This information is critical—to forecast the weather into the future, we need to know where to start from!
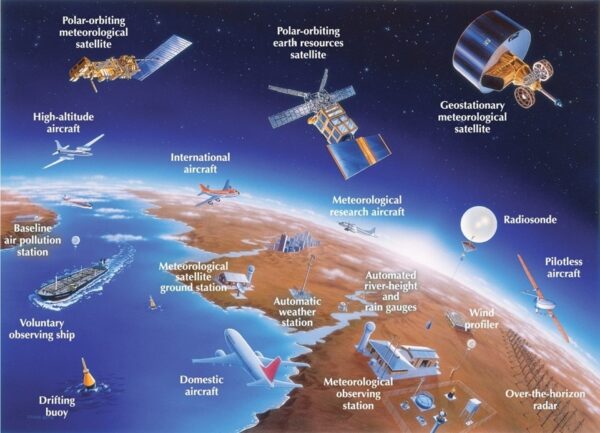
Meteorological observations are recorded by a complex array of equipment at different levels, from under the sea to far above the Earth in space as seen in figure above.
_
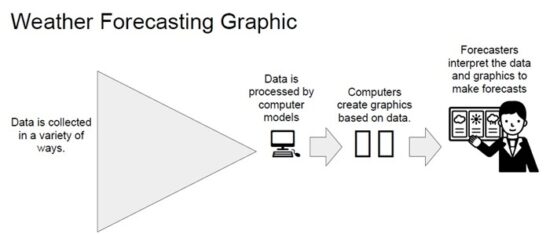
Figure above shows how weather forecasting works. Weather data is collected from weather stations, and also weather satellites, doppler radar, weather balloons, and other tools. It is then compiled and analyzed by powerful computers that identify patterns. Those computers then use models to predict how the patterns found will affect the weather. Accurate weather prediction is only possible in the short term.
___
Figure below shows weather forecasting process:
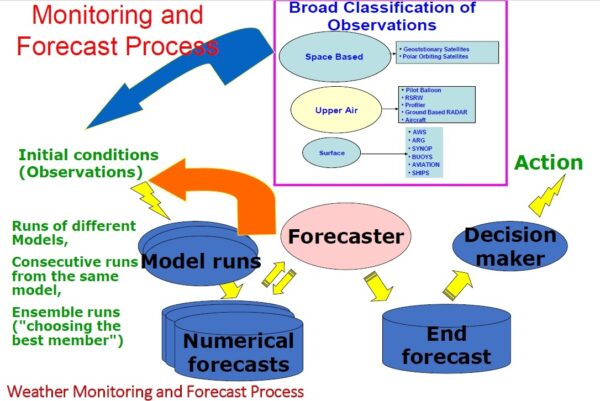
The weather forecasting process involves several key steps, including observations, data analysis, numerical modelling, and communication.
- Data Collection:
Meteorologists collect data from various sources to understand current atmospheric conditions. This data includes information on temperature, humidity, air pressure, wind speed and direction, cloud cover, and precipitation. Sources of data include satellites, weather stations, buoys, radar systems, and weather balloons.
- Transmission of Weather Data:
Weather observations which are condensed into coded figures, symbols and numerals are transmitted via radiophone, teletype, facsimile machine or telephone to designated collection centers for further transmission to the central forecasting station. Weather satellite pictures are transmitted to ground receiving stations while radar observations are transmitted to forecasting centers through a local communication system.
- Observation and Analysis:
The collected data is meticulously examined and analysed to assess the current state of the atmosphere. Meteorologists scrutinise patterns and trends in the data to gain insights into weather phenomena such as temperature variations, pressure systems, and wind patterns.
- Numerical Weather Prediction (NWP):
Meteorologists employ sophisticated computer models known as Numerical Weather Prediction (NWP) models to forecast future weather conditions. These models simulate the behaviour of the atmosphere using complex mathematical equations based on principles of physics and fluid dynamics.
- Computer weather models:
Computer weather models, or technically, ‘numerical weather prediction’ models, are the main tools used to forecast the weather. In a nutshell, they take all of the mathematical equations that explain the physics of the atmosphere and calculate them at billions of points within the atmosphere around the Earth. The weather models require enormous computing power to complete their calculations in a reasonable amount of time, meaning they use some of the most powerful supercomputers in the world. The models take the past and current weather observations of the atmosphere and ocean as the starting point, and plug them into the mathematical equations that calculate the weather into the future.
- Weather models simulate the atmosphere using fundamental physical laws:
-Newton’s laws of motion
-Conservation of mass in fluid dynamics
-Thermodynamics and Fluid dynamics
These are expressed as the primitive equations, solved on a 3 D grid covering the globe. Supercomputers (e.g., 8.4 petaflop systems at the U.S. National Weather Service) run these models continuously.
- Model Initialisation:
To start the forecasting process, the NWP models are initialised with current observational data. This provides a baseline for the models to predict how the atmosphere will evolve over time.
- Model Integration:
The initialised models then undergo extensive calculations to simulate the complex interactions within the atmosphere. The atmosphere is divided into a grid, and equations are solved for each grid to model processes such as temperature changes, air movement, moisture transport, and cloud formation.
- Mathematics and Model Resolution
-The atmosphere is divided into thousands of grid cells (discretization).
-Finer grids improve accuracy but require more computing power.
-Turbulence, heat transfer, and moisture processes must be represented accurately.
- Running the Simulation:
The current global observations are fed into the supercomputers as a starting point. The computer then divides the atmosphere into a 3D grid—like a massive, layered chessboard covering the globe. For each grid point (which can be as small as 3km square for high resolution models), it calculates what will happen based on the physics equations, projecting forward in short time steps (e.g., a few minutes). This process creates a numerical weather prediction (NWP), the backbone of all modern forecasts.
-Global Models: These cover the entire Earth. Famous ones include the American GFS (Global Forecast System), the European ECMWF, and the UK Met Office’s UM. They provide the large scale picture—where jet streams, high pressure systems, and major storm tracks will be.
-Regional/High Resolution Models: These, like the HRRR (High Resolution Rapid Refresh), take the global model data and “zoom in” on a specific area (like the continental U.S.). With finer grids, they can simulate thunderstorms, fog, and complex terrain effects in much greater detail.
- Forecast Output:
The NWP models generate forecasts for various weather parameters, including temperature, precipitation, wind speed and direction, and cloud cover. These forecasts are produced for different time intervals, ranging from short-term forecasts covering a few hours to long-term forecasts extending several days or even weeks.
- Verification and Adjustment:
Meteorologists verify the accuracy of the model forecasts by comparing them with observed weather conditions. Any discrepancies are noted, and adjustments may be made to the forecasts based on expert judgement and additional data analysis.
- Interpretation and Communication:
Meteorologists interpret the forecast data in the context of local geography, climate, and weather patterns. They use their expertise to generate weather forecasts and warnings tailored to specific regions and audiences. This information is communicated through various channels, including television, radio, websites, mobile apps, and social media platforms.
- Dissemination:
Weather forecasts are disseminated to the public and various sectors such as agriculture, aviation, and emergency management to help them make informed decisions. Timely and accurate weather information is essential for planning activities, mitigating risks, and ensuring public safety.
- Continuous Monitoring:
Meteorologists continuously monitor changing weather conditions, updating forecasts as new data becomes available. This ongoing monitoring allows for real-time adjustments to forecasts and ensures that the public receives the most up-to-date information to guide their actions.
- Forecast Accuracy and Limits
-Modern 5-day forecasts are as accurate as 3-day forecasts in 1990.
-Modern 3-day forecasts routinely achieve ~90% accuracy.
-Accuracy declines significantly beyond 7–10 days due to atmospheric chaos.
____
Analysis of Weather Maps, satellite pictures and radar reports:
Current weather maps are analyzed as follows:
SURFACE (MSL) CHART: The data plotted on this weather map are analyzed isobarically. This means the same atmospheric pressure at different places are inter-connected with a line taking into consideration the direction of the wind. Through this analysis, weather systems or the so-called centers of action such as high and low pressure areas, tropical cyclones, cold and warm fronts, intertropical convergence zone, can be located and delineated.
UPPER AIR CHARTS: The data plotted on this weather map are analyzed using streamline analysis. Lines are drawn to illustrate the flow of the wind. With this kind of analysis, anticyclones or high pressure areas and cyclones or low pressure areas can be delineated.
NUMERICAL WEATHER PREDICTION MODEL OUTPUT: The computer-plotted weather maps are analyzed manually so that weather systems like cyclones and anticyclones, troughs, etc. are located.
MONITOR WEATHER CHARTS: Plotted data on the cross-section, rainfall and 24-hour pressure change charts are analyzed to determine the movement of wind waves, rainfall distribution and the behavior of the atmospheric pressure.
Compare the current weather maps with the previous 24 – 72 hour weather maps level by level to determine the development and movement of weather systems that may affect the forecast area.
Examine the latest weather satellite picture, noting the cloud formations in relation to the weather systems on the current weather maps.
Compare the latest weather satellite picture with the previous satellite pictures (up to 48 hours) noting the development and movement of weather systems that may affect the country.
Examine the latest computer output of the numerical weather prediction model noting the 24-hour, 48-hour and 72-hour objective forecast of the weather systems that may affect the forecast area.
Analyze the latest radar reports and other minor forecasting tools.
______
The forecast process is roughly the same regardless of the type of weather. Scientists thoroughly review current observations using technology such as radar, satellite and data from an assortment of ground-based and airborne instruments to get a complete picture of current conditions. Forecasters often rely on computer programs to create what’s called an “analysis,” which is simply a graphical representation of current conditions. Once this assessment is complete and the analysis is created, forecasters use a wide variety of numerical models, statistical and conceptual models, and years of local experience to determine how the current conditions will change with time. Numerical modeling is fully ingrained in the forecast process, and forecasters review the output of these models daily. Often, the models yield different results, and in these circumstances, forecasters will determine which models perform best for the given situation or seek a blended solution.
Ensemble Forecasting: The atmosphere is a chaotic system, meaning tiny, unmeasurable variations can drastically alter the trajectory of a storm or weather pattern. To account for this uncertainty, supercomputers run the same model multiple times, slightly tweaking the initial starting data each time. This process, called ensemble forecasting, helps scientists see the most likely weather scenario and measure the probability of extreme events.
One of the key considerations associated with any forecast is the element of uncertainty. The chaotic nature of the earth-atmosphere system and incomplete sampling of its complicated physical processes mean that forecasts become more uncertain at longer time ranges. This uncertainty is why the human component remains a vital piece in the forecast process; as once the forecast is complete, effectively communicating the forecast message becomes as important as the details of the forecast itself. This includes communicating which parts of the forecast are “uncertain” or what might be the “worst-case scenario” if the forecast changes.
________
________
Transformative Advancements in Weather Forecasting:
The accuracy and timeliness of modern forecasts owe much to groundbreaking innovations in technology. Some of the key advancements include:
-1. High-Performance Supercomputers
High-performance Supercomputers make it possible to develop weather models with high resolution that provide in-depth understanding of weather patterns. Organizations such as NOAA in the United States and the UK Met Office use these systems to analyze large amounts of data and enhance the accuracy of their forecasts.
-2. Artificial Intelligence (AI) and Machine Learning
AI and machine learning technologies have revolutionized the field by:
- Enhancing short-term predictions, especially for rapidly changing conditions.
- Identifying biases in numerical models and improving their accuracy.
- Delivering highly localized forecasts critical for sectors like agriculture and renewable energy.
-3. Next-Generation Satellites
Modern satellites come with sensors that give us up-to-the-minute detailed images of the Earth’s surface. NOAAs GOES 16 and Copernicus satellites from Europe play a vital role in monitoring extreme weather conditions and studying climate patterns over time.
-4. IoT Integration
Internet of Things (IoT) technology improves weather forecasting by collecting hyper-localized, real-time environmental data from smart sensors deployed directly in specific fields, cities, or remote areas. The rise in gadgets and advanced tech has broadened the scope of gathering weather data significantly. The use of smartphones and home weather systems along with devices provides important localized information.
-5. Crowdsourced Weather Data
Imagine millions of personal weather stations, not owned by meteorologists, but by everyday people, forming a vast data-gathering network. This is the concept of crowdsourced weather data, and it’s poised to make a big impact.
- Filling the Gaps: Traditional weather stations are often sparse, especially in rural or remote areas. Your smartphone, with its built-in barometer, thermometer, and GPS, can contribute valuable data from places where no official observation exists. Some cars can even act as mobile weather sensors!
- Real-time Updates: Crowdsourced data offers real-time updates – a sudden pressure drop reported by hundreds of phones in one area could signal a tornado forming far faster than official stations could detect.
- Street-Level Detail: Imagine a storm moving through a city. Crowdsourced data could paint a picture of hyper-local conditions – rainfall varying drastically between neighborhoods, wind gusts strongest on certain streets. This level of detail enhances warnings and response efforts.
How it Works: Apps and specialized devices can gather data from your phone or personal weather station and feed it anonymously into large datasets. This data is then integrated into forecast models, adding valuable information that wouldn’t otherwise be available.
-6. Enhanced Numerical Weather Prediction (NWP) Models
Numerical Weather Prediction models have seen continuous advancements, incorporating more sophisticated physical parameterizations, improved boundary conditions, and increased computational power. These improvements allow for more realistic simulations of atmospheric processes and better prediction of weather patterns. The economic impact of climate-related disasters has escalated significantly in recent years. In 2024, the United States experienced a record 27 weather and climate disasters, each causing losses exceeding $1 billion, totaling approximately $182.7 billion in damages. This marked the second highest number of such events in a single year since records began in 1980. These extreme changes show that previous weather forecasting was inaccurate.
-7. Quantum Computing and Simulation
Another way to improve weather forecasting accuracy is to use quantum computing and simulation. These technologies can help solve complex and nonlinear weather problems, that are beyond the capabilities of conventional computers, and provide more accurate and detailed forecasts. For example, Microsoft is developing a quantum computing and simulation platform, that can help improve the understanding and prediction of weather phenomena, such as hurricanes, tornadoes, and El Niño, by using quantum algorithms and techniques. Quantum computing and simulation can also help explore and model the effects of climate change, and provide insights and solutions for mitigation and adaptation.
-8. Climate Model Integration
Given the alterations in weather patterns due to climate change, it is essential to merge long-range climate projections with forecasting methods. These models predict shifts to assist communities in adjusting to changing environmental circumstances.
_______
_______
Probability of Precipitation:
A Probability of Precipitation (PoP) is a formal measure of the likelihood of precipitation that is often published from weather forecasting models, although its definition varies. In U.S. weather forecasting, PoP is the probability that greater than 1/100th of an inch of precipitation will fall in a single spot, averaged over the forecast area. For instance, if there is a 100 percent probability of rain covering one side of a city and a zero percent probability of rain on the other side of the city, the PoP would be 50 percent. A 50 percent chance of a rainstorm covering the entire city would also lead to a PoP of 50 percent. The mathematical definition of PoP is defined as PoP = C × A × 100, where C is the confidence that precipitation will occur somewhere in the forecast area, and A is the percent of the area that will receive measurable precipitation, if it occurs at all.
For example, a forecaster may be 40 percent confident that precipitation will occur and that, should rain happen to occur, it will happen over 80 percent of the area. This results in a PoP of 32 percent → 0.4 × 0.8 × 100 = 32.
___
The probability of precipitation (PoP) in an ensemble forecast is calculated as the percentage of individual computer model simulations (ensemble members) that predict measurable rain or snow at a specific location. If an ensemble has 20 total members and 6 of them show rain for a certain spot, the probability of precipitation is 30% (6 ÷ 20).
What does a 30% chance of rain mean?
If you look at your favourite weather app, you are likely to find that one of the things it offers is a chance of rain expressed as a percentage, but what does a 30% chance of rain actually mean?
We all know that weather forecasting is not an exact science. Chaos theory was discovered by meteorologist Ed Lorenz in the 1950s, working on early attempts to model the weather using computers, before most people had even heard of computers! Lorenz discovered that if he stopped his computer model and restarted it with very slightly different numbers — he simply rounded off the numbers to three significant places to save typing in the full detail — he got completely different answers a few days into his forecast. Lorenz realised this meant that there would always be a limit to how far ahead we could forecast the weather, because however good our observing systems, we could never know all the exact details of the starting conditions.
Today’s forecast models run on immense supercomputers, exploiting billions of observations every day (mainly from satellites), give incredible detail in forecasts but are still constrained by chaos theory. For large-scale weather patterns the solutions typically start to diverge after a few days, but for fine local detail, including how much rainfall, they can diverge within a few hours into the forecast in some circumstances.
_
To address the challenge of chaos theory, forecasters run their models many times from very slightly different starting conditions in what are called ensemble forecasts. Ensembles provide a way to estimate the confidence in a particular forecast, and to estimate how likely something is to happen — like the chance of rain. If all the forecasts in an ensemble are similar then the forecaster can be confident and the chance of rain may be 90% or more (or 10% or less, giving high confidence for no rain!). But another day the forecasts may all diverge rapidly, giving less confidence and meaning that the best that the forecaster can say is that there is, for example, a 30% chance of rain.
_
Now, we come back to the same question — what does 30% chance of rain actually mean? Some people have interpreted it to mean that it will rain 30% of the time, others that it will affect 30% of the area. If we think back to how the number is generated, using an ensemble, we see it isn’t really either of those, but more like 30% of forecast simulations suggest it will rain. Another way to express it, rather clumsily, is that it will rain on 30% of days like today — days when the starting point of the forecast is almost exactly the same as it is today.
In practice, even that interpretation is simplistic and there are many ways that the chance of rain can be calculated from model output, and not all forecasters or app developers will use the same approach. A model or ensemble may output whether or not it is raining “on the hour” or “during the past hour”. During showers or intermittent rain, the latter will give higher probabilities.
_
How much rain do you need for an ensemble member to count towards the chance of rain? Most forecast providers choose a small amount, such as 0.2mm in an hour, but it is also possible to calculate the chances of heavier rain which may be more important for many users. For example, what is the chance of a flash flood producing heavy rain? That sort of rain is usually produced by convective showers or thunderstorms. Today’s high-resolution forecast models and ensembles, such as those operated by the Met Office, are capable of explicitly resolving the convective air motions in thunderstorms, but the precise mechanisms for triggering storms are much less predictable. Storms will often be predicted in the right general area but not with the exact right locations or timings. Advanced post-processing systems such as that used by the Met Office, will look not just at the 18 forecasts in the ensemble, but also look at a “neighbourhood” of model grid-boxes around the site of interest for any showers occurring nearby, to get a better estimate of the chance of rain. Going even a step further, for high-impact thunderstorms, users may be more interested in the chance of storms anywhere in the area around them, not just at one location, so we can calculate the chance of storms occurring within, say, 25km, which will be much higher than the chance of getting one overhead.
_
In terms of how the chance of rain is calculated, it is finally worth mentioning that some providers will calibrate the probabilities which come directly out of the ensembles using past observations. For example, if we look back at all the times when the ensemble forecast a 50% chance of rain and find that it only actually rained on 30% of those occasions, then future forecasts will be adjusted so that an ensemble probability of 50% is presented in the app as a 30% chance.
In summary, there are a number of interpretations of “chance of rain”, but unless a forecast specifically says it is for heavy rain or within a distance, it can be assumed that it is the chance of any rain in the hour at the location.
_
One other factor to think about is that most apps will give a chance, or probability, of rain for each hour of the day. These probabilities need to be considered independently of each other, and they tell you little about the probability of rain occurring over a longer period. For example, four consecutive hours with a 25% chance of rain does NOT add up to a 100% chance in four hours! In fact, the chance in four hours could be anywhere from 25%, perhaps if 10 out of 40 ensemble members predict a rain system to spread far enough north to affect the location, to 100% if all 40 members expect a cold front to pass over the site but with different timings.
It is likely that in the future some providers may also offer chances of rain “at some point during the day”, especially for longer range forecasts. Meanwhile, you might be able to help understand the risk better by looking at other parts of the forecast to understand what types of weather systems are producing the rain. For example, if you are using the Met Office app, have a look at the Maps section to see whether the model is predicting scattered showers or a frontal band of rain.
_______
_______
General weather cues:
(1) Signs of an approaching storm
-Cap or lens clouds
-Solid layer of cirrus on horizon
-Halo around sun or moon
-Clouds lowering and thickening
-Winds backing (e.g., SW→ S →SE) and increasing with time
-Puffy cumulus forming (moisture is being lifted)
-Falling surface pressures
(2) Signs of a warm front
-Dull leaden sky
-Gradual increase in precipitation
-Steady light to moderate precipitation
-Slow fall of a barometer (altimeter slowly rises)
-Passage usually unremarkable
-Type of precipitation may change (i.e., snow to rain)
-Pressure may fall more slowly
-Temperatures may rise, but often not, in the mountains
-Wind directions may vary dramatically with elevation (surface pressure gradient versus free air winds at 850 and 700mb levels—about 5000 and 9000 ft., respectively)
(3) Signs of a cold front
-Continuing pressure falls
-Increasing precipitation
-Front often accompanied by heavy precipitation, and precipitation may be in bands of shower parallel to the front
-Hail, lightning and strong winds may occur with the front, with possibly dramatic changes in wind speed and direction (e.g., changing from east to west winds); be aware of different wind loading patterns from pressure gradient driven winds common near passes versus free winds more likely at higher ridgelines.
-Rapid rise in pressure (altimeter lowers) when front passes
-Temperatures usually begin to fall, but not always—temperatures may actually rise with a cold frontal passage when cold continental air is being replaced by cooler air following the cold front
-Marked decrease in precipitation immediately after front
-Showery (off and on) precipitation after front
(4) More storms?
-Pressure stops rising or begins to fall
-Increasingly steady precipitation (showers with a following trough have been overrun by increasing moisture ahead of the next front)
-Solid deck of high clouds visible through breaks
(5) Improving weather!
-Pressure rises for more than 12 hours
-Showers tapering off
-Or sharp maximum in showers followed by rapid decrease
-Temperatures drop to -10°C (14°F) or lower (strong cold dry northerly flow moving in aloft and at surface)
-Only wispy clouds or no clouds visible through breaks
-Watch out for surface hoar developing overnight if skies continue fair; be aware of surface crusts forming on sun-exposed terrain if temperatures warm. Note that dramatic changes in snow structure may develop on sun-exposed versus sun-shaded terrain.
(6) Continued fair weather
-Cloud free sky
-Wispy cirrus from north or northwest
-Steady or gradually rising pressure for several days
-Low clouds burning off every day to clear skies
-Watch out for developing surface hoar during clear nights; try to track where this weak layer may be destroyed or buried intact. Significant small-scale variations in snow pack stability are often the result of uneven and localized survival and ensuing burial of surface hoar.
_______
_______
Categories of weather forecasting:
Harvard economist John Kenneth Galbraith famously stated, “There are two kinds of forecasters: those who don’t know, and those who don’t know they don’t know.” This view encapsulates his perspective on forecasting, suggesting that all forecasters can be categorized into these two distinct groups. He highlights a fundamental truth about forecasting: many individuals might unwittingly overlook their limitations in predicting future outcomes. Galbraith’s assertion emphasizes the importance of awareness in forecasting capability.
When it comes to the methods of forecasting, they can broadly be divided into two categories: quantitative and qualitative. Quantitative forecasting utilizes numerical data and statistical models to predict future events, while qualitative forecasting relies on expert judgment and subjective assessments. Businesses often choose between these methods based on their specific needs; quantitative methods offer structured insights through data, whereas qualitative methods provide deeper context and understanding based on expert opinions.
Ultimately, forecasting involves estimating uncertain future events and varies results based on different assumptions.
_
Weather forecasting is the scientific process of predicting future atmospheric conditions using data, physics, and computer models. Key components include data collection via global sensors, mathematical computer simulations, and expert human analysis. Weather forecasting can be categorized by time range, method, and model type, including short-range, medium-range, long-range, deterministic, probabilistic, and nowcasting approaches.
_
Forecasting by Time Range:
- Short-range forecasts: Cover 1 to 7 days and are commonly used by mariners, aviation professionals, and irrigation engineers. They rely on observation, analysis, and extrapolation to predict near-future atmospheric conditions
- Medium-range forecasts: Typically span 8 to 14 days, providing guidance for planning activities and resource management.
- Long-range forecasts: Extend beyond two weeks and are often used for seasonal planning, agriculture, and energy demand estimation
- Nowcasting: Focuses on very short-term predictions, usually up to 6 hours, and is critical for immediate weather events like thunderstorms or heavy rainfall
_
There are different types of forecasts based on how far into the future they look:
Type Time Range Uses
Nowcasting 0–2 hours Local storms, rain, immediate warnings
Short-term 1–3 days Daily weather, travel plans
Medium-term 4–7 days Week planning
Long-term 8–14 days Events, farming
Seasonal 1–6 months Crop planning, climate patterns like El Niño
Each type uses different models and has different accuracy.
_
Forecasting by Method:
- Deterministic forecasting: Predicts a specific weather event at a precise location and time, such as a hurricane landfall or tornado touchdown
- Probabilistic forecasting: Estimates the likelihood of weather events occurring in a region over a period, useful for assessing storm risks or precipitation probabilities
- Climatology method: Uses historical weather averages to predict conditions for a specific day, effective when weather patterns are stable
- Analog method: Compares current atmospheric conditions to similar past events to forecast outcomes, though small differences can affect accuracy
- Persistence and trend methods: Assume that current weather conditions will continue or follow a trend, often used for short-term predictions
_
Forecasting by Model Type:
Weather forecast models are classified into three primary types: global models, mesoscale models, and microscale models.
-1. Global Models: Cover the entire globe and deliver large-scale forecasts. Notable examples include the Global Forecast System (GFS) and the European Centre for Medium-Range Weather Forecasts (ECMWF).
-2. Mesoscale Models: These provide forecasts for smaller regions and include models like the North American Mesoscale (NAM) and High-Resolution Rapid Refresh (HRRR).
-3. Microscale Models: Focus on very localized weather phenomena.
_
Rainfall Categories observed within 24 hours:
Range Categories
<1mm Trace
5mm Light Rain
5-20mm Moderate Rain
20-50mm Heavy Rain
>50 mm Very Heavy
Some Key Words used in Weather Forecast:
Mostly Cloudy: Amount of clouds covering 60% to 100% of the sky
Partly Cloudy: Amount of clouds covering 30% to 60% of the sky
Few Clouds: Amount of clouds covering 0% to 30% of the sky
_______
_______
Weather forecasting is done for different temporal scales which has different uses and have different parameters for accuracy. So on the basis of different time scales, there are four types of weather forecasting.
Long range weather forecast:
Long range forecast as the name suggests is done for a longer temporal range. These are not forecasts in true sense but are given in the form of statements or estimates for the period ranging from a fortnight, month, season or even a year. As these are given in the form of statements and is for a longer period, the level of accuracy is definitely lesser compared to the shorter ranges of weather forecasting. Such forecasts give due consideration to the departures of temperature and pressure and other atmospheric conditions from normal atmospheric conditions for a particular season or period of time. These departures are seen from an average of past observations regarding the different elements of weather or atmospheric conditions. Long-range forecasts extend beyond seven days and can cover periods of several weeks, months, or even seasons. These forecasts rely on statistical methods and large-scale climatological patterns, such as El Niño and La Niña, to make predictions about general weather trends, rather than specific conditions. For example, long range forecasts are given for a season, like for predicting the success or failure of monsoons in case of India.
Medium range weather forecast:
Medium range weather forecasting is given for the time interval ranging between 3 days to 7 days. These have greater accuracy compared to long range weather forecast but have lesser accuracy in comparison to short range weather forecasts. Like long range weather forecasts they are also given considering the mean weather conditions for the extended period based on past and present weather conditions. This is important for various weather sensitive activities such as farming operations, flood forecasting, water resource management, sports, transport etc. Medium-range forecasts were impossible before the advent of satellites remote sensing for climatological purposes. Medium-range forecasts provide predictions for periods of three to seven days. These forecasts employ global NWP models, such as the European Centre for Medium-Range Weather Forecasts (ECMWF) and the United States’ Global Forecast System (GFS), which cover the entire Earth and are updated regularly. India Meteorological Department (IMD) has operational mandate to provide day to day forecasts on short to medium range for various user specific application such as, public weather services, aviation, agriculture, hydrology, disaster management etc.
Short range weather forecast:
Short range forecast is made for the time period ranging from 1 day to 3 days. The purpose of short-range weather forecasting today is to provide various users with the information on anticipated weather conditions for forthcoming two or three days. It covers areas of a few million square kilometers. The prime objective is to take necessary precautions beforehand so as to reduce the inconvenience or damage caused by adverse weather conditions. Short-range weather forecasts rely on a combination of observed weather data (from ground stations, radar, and satellites), along with weather prediction models, and the expertise from meteorologists. Short range weather forecasting has a high level of accuracy compared to the two types discussed above and is based on maps, weather charts, satellite imageries or any change in atmospheric conditions over a particular location. Meteorologists use numerical weather prediction (NWP) models, which simulate the Earth’s atmosphere based on the laws of physics and initial observations, to generate these forecasts. About 80-90% accuracy is seen in forecasts that is done for smaller duration, say 12 hours. These have greater application in day-to-day activities, for example in aviation, transport, tourism, sports, health, adventure activities and for managing the disasters. This is because such forecasts are weather specific and predict specific weather phenomenon like fog, thunderstorms, cyclones, dust storms, hailstorms etc. and the information is transmitted in the form of weather report through both print (newspapers) and electronic media (radio or television channels) to the people.
Nowcast:
Nowcast is a weather forecast for a very short duration and comprises of detailed description of the current weather along with forecasts obtained by extrapolation usually for a few hours, say about 0-6 hours. Through nowcast, it becomes possible to forecast even the minute details of individual storms with reasonable accuracy. In this case, the forecast is done for a relatively small area like a city and minute weather details are covered with the help of radar, satellite images and observational data. It is predominantly given as a prewarning against any extreme weather event like, cyclone, thunderstorms and tornados which has the possibility of causing flash floods, lightning strikes and destructive winds. One important feature of nowcast is that, it provides location-specific forecasts of storms right from initiation, its growth and movement to final dissipation. This location specific information helps the local people to cope with any such extreme weather events. Nowcasting primarily relies on real-time observations, such as radar and satellite data, to track and anticipate the development of weather phenomena, such as storms, fog, and showers. Nowcasting by extrapolation excels in delivering high-resolution forecasts of weather phenomena for the immediate (2 hour) future. This forecast is an extrapolation in time of known weather parameters, including those obtained by means of remote sensing, using techniques that take into account a possible evolution of the air mass. This type of forecast therefore includes details that cannot be solved by numerical weather prediction (NWP) models running over longer forecast periods. Advancements in data assimilation systems enable Numerical Weather Prediction (NWP) to outperform nowcast extrapolation thereafter. The use of NWP with data assimilation forms the basis of Very Short Range Forecasting (VSRF) up to 12 hours. Nowcast is helpful in three ways. Firstly, it prevents casualties of the population vulnerable to these extreme weather events. Secondly, it helps to minimize the loss of property either public or private in an event of any such weather related disaster. Thirdly, it also prevents the loss in economy by improving the savings for sectors that could be directly affected by weather. Besides being used for disaster management, nowcast is also used for aviation purposes. Here weather related information is given for both terminals, that is, the source and the destination as well as en-route environmental conditions are also provided. Nowcast also provides information for marine safety, water and power management, off- shore oil drilling, construction industry and leisure industry.
__
Weather forecasts are essential for daily planning, agriculture, aviation, maritime navigation, and hazard management. They help protect lives and property, optimize resource use, and guide decision-making in industries sensitive to weather conditions. By understanding these types and methods, one can appreciate the complexity of weather prediction and the tools meteorologists use to provide accurate forecasts.
______
______
Short-range forecasting and long-range forecasting:
Short-range forecasting:
When people wait under a shelter for a downpour to end, they are making a very-short-range weather forecast. They are assuming, based on past experience, that such hard rain usually does not last very long. In short-term predictions the challenge for the forecaster is to improve on what the layperson can do. For years the type of situation represented in the above example proved particularly vexing for forecasters, but since the mid-1980s they have been developing a method called nowcasting to meet precisely this sort of challenge. In this method, radar and satellite observations of local atmospheric conditions are processed and displayed rapidly by computers to project weather several hours in advance. The U.S. National Oceanic and Atmospheric Administration operates a facility known as PROFS (Program for Regional Observing and Forecasting Services) in Boulder, Colo., specially equipped for nowcasting.
_
Meteorologists can make somewhat longer-term forecasts (those for 6, 12, 24, or even 48 hours) with considerable skill because they are able to measure and predict atmospheric conditions for large areas by computer. Using models that apply their accumulated expert knowledge quickly, accurately, and in a statistically valid form, meteorologists are now capable of making forecasts objectively. As a consequence, the same results are produced time after time from the same data inputs, with all analysis accomplished mathematically. Unlike the prognostications of the past made with subjective methods, objective forecasts are consistent and can be studied, reevaluated, and improved.
_
Another technique for objective short-range forecasting is called MOS (for Model Output Statistics). Model Output Statistics (MOS) is a post-processing technique developed by meteorological agencies like the National Weather Service that applies statistical equations to raw numerical weather prediction (NWP) computer model output. MOS corrects for known local geographical biases and grid-resolution limitations. This method involves the use of data relating to past weather phenomena and developments to extrapolate the values of certain weather elements, usually for a specific location and time period. It overcomes the weaknesses of numerical models by developing statistical relations between model forecasts and observed weather. These relations are then used to translate the model forecasts directly to specific weather forecasts. For example, a numerical model might not predict the occurrence of surface winds at all, and whatever winds it did predict might always be too strong. MOS relations can automatically correct for errors in wind speed and produce quite accurate forecasts of wind occurrence at a specific point, such as Heathrow Airport near London. As long as numerical weather prediction models are imperfect, there may be many uses for the MOS technique.
_
Short-range weather forecasts generally tend to lose accuracy as forecasters attempt to look farther ahead in time. Predictive skill is greatest for periods of about 12 hours and is still quite substantial for 48-hour predictions. An increasingly important group of short-range forecasts are economically motivated. Their reliability is determined in the marketplace by the economic gains they produce (or the losses they avert).
_
Weather warnings are a special kind of short-range forecast; the protection of human life is the forecaster’s greatest challenge and source of pride. Weather warnings are issued by government and military organizations throughout the world for all kinds of threatening weather events: tropical storms variously called hurricanes, typhoons, or tropical cyclones, depending on location; great oceanic gales outside the tropics spanning hundreds of kilometres and at times packing winds comparable to those of tropical storms; and, on land, flash floods, high winds, fog, blizzards, ice, and snowstorms.
_
A particular effort is made to warn of hail, lightning, and wind gusts associated with severe thunderstorms, sometimes called severe local storms (SELS) or simply severe weather. Forecasts and warnings also are made for tornadoes, those intense, rotating windstorms that represent the most violent end of the weather scale. Destruction of property and the risk of injury and death are extremely high in the path of a tornado, especially in the case of the largest systems (sometimes called maxi-tornadoes).
Because tornadoes are so uniquely life-threatening and because they are so common in various regions of the United States, the National Weather Service operates a National Severe Storms Forecasting Center (NSSFC) in Kansas City, Mo., where SELS forecasters survey the atmosphere for the conditions that can spawn tornadoes or severe thunderstorms. This group of SELS forecasters, assembled in 1952, monitors temperature and water vapour in an effort to identify the warm, moist regions where thunderstorms may form and studies maps of pressure and winds to find regions where the storms may organize into mesoscale structures. The group also monitors jet streams and dry air aloft that can combine to distort ordinary thunderstorms into rare rotating ones with tilted chimneys of upward rushing air that, because of the tilt, are unimpeded by heavy falling rain. These high-speed updrafts can quickly transport vast quantities of moisture to the cold upper regions of the storms, thereby promoting the formation of large hailstones. The hail and rain drag down air from aloft to complete a circuit of violent, cooperating updrafts and downdrafts.
By correctly anticipating such conditions, SELS forecasters are able to provide time for the mobilization of special observing networks and personnel. If the storms actually develop, specific warnings are issued based on direct observations. This two-step process consists of the tornado or severe thunderstorm watch, which is the forecast prepared by the SELS forecaster, and the warning, which is usually released by a local observing facility. The watch may be issued when the skies are clear, and it usually covers a number of counties. It alerts the affected area to the threat but does not attempt to pinpoint which communities will be affected.
By contrast, the warning is very specific to a locality and calls for immediate action. Radar of various types can be used to detect the large hailstones, the heavy load of raindrops, the relatively clear region of rapid updraft, and even the rotation in a tornado. These indicators, or an actual sighting, often trigger the tornado warning. In effect, a warning is a specific statement that danger is imminent, whereas a watch is a forecast that warnings may be necessary later in a given region.
____
Long-range forecasting:
Extended-range, or long-range, weather forecasting has had a different history and a different approach from short- or medium-range forecasting. In most cases, it has not applied the synoptic method of going forward in time from a specific initial map. Instead, long-range forecasters have tended to use the climatological approach, often concerning themselves with the broad weather picture over a period of time rather than attempting to forecast day-to-day details.
_
There is good reason to believe that the limit of day-to-day forecasts based on the “initial map” approach is about two weeks. Most long-range forecasts thus attempt to predict the departures from normal conditions for a given month or season. Such departures are called anomalies. A forecast might state that “spring temperatures in Minneapolis have a 65 percent probability of being above normal.” It would likely be based on a forecast anomaly map, which shows temperature anomaly patterns. The maps do not attempt to predict the weather for a particular day, but rather forecast trends (i.e., warmer than normal) for an extended amount of time, such as a season (i.e., spring).
_
The U.S. Weather Bureau began making experimental long-range forecasts just before the beginning of World War II, and its successor, the National Weather Service, continues to express such predictions in probabilistic terms, making it clear that they are subject to uncertainty. Verification shows that forecasts of temperature anomalies are more reliable than those of precipitation, that monthly forecasts are better than seasonal ones, and that winter months are predicted somewhat more accurately than other seasons.
_
Prior to the 1980s the technique commonly used in long-range forecasting relied heavily on the analog method, in which groups of weather situations (maps) from previous years were compared to those of the current year to determine similarities with the atmosphere’s present patterns (or “habits”). An association was then made between what had happened subsequently in those “similar” years and what was going to happen in the current year. Most of the techniques were quite subjective, and there were often disagreements of interpretation and consequently uneven quality and marginal reliability.
Persistence (warm summers follow warm springs) or anti-persistence (cold springs follow warm winters) also were used, even though, strictly speaking, most forecasters consider persistence forecasts “no-skill” forecasts. Yet, they too have had limited success.
_
In the last quarter of the 20th century the approach of and prospects for long-range weather forecasting changed significantly. Stimulated by the work of Jerome Namias, who headed the U.S. Weather Bureau’s Long-Range Forecast Division for 30 years, scientists began to look at ocean-surface temperature anomalies as a potential cause for the temperature anomalies of the atmosphere in succeeding seasons and at distant locations. At the same time, other American meteorologists, most notably John M. Wallace, showed how certain repetitive patterns of atmospheric flow were related to each other in different parts of the world. With satellite-based observations available, investigators began to study the El Niño phenomenon. Atmospheric scientists also revived the work of Gilbert Walker, an early 20th-century British climatologist who had studied the Southern Oscillation, the aforementioned up-and-down fluctuation of atmospheric pressure in the Southern Hemisphere. Walker had investigated related air circulations (later called the Walker Circulation) that resulted from abnormally high pressures in Australia and low pressures in Argentina or vice versa.
Note:
The Walker Circulation is a conceptual model of east-west atmospheric circulation of air across the tropical oceans, most notably the Pacific Ocean, driven by surface temperature and pressure gradient.
_
All of this led to new knowledge about how the occurrence of abnormally warm or cold ocean waters and of abnormally high or low atmospheric pressures could be interrelated in vast global connections. Knowledge about these links—El Niño/Southern Oscillation (ENSO)—and about the behaviour of parts of these vast systems enables forecasters to make better long-range predictions, at least in part, because the ENSO features change slowly and somewhat regularly. This approach of studying interconnections between the atmosphere and the ocean may represent the beginning of a revolutionary stage in long-range forecasting.
_
Since the mid-1980s, interest has grown in applying numerical weather prediction models to long-range forecasting. In this case, the concern is not with the details of weather predicted 20 or 30 days in advance but rather with objectively predicted anomalies. The reliability of long-range forecasts, like that of short- and medium-range projections, has improved substantially in recent years. Yet, many significant problems remain unsolved, posing interesting challenges for all those engaged in the field.
______
______
Specialist weather forecasting:
A specialist weather forecast is a targeted meteorological prediction tailored for specific industries, such as aviation, marine navigation, or agriculture, rather than the general public. It focuses on specialized atmospheric variables and localized impacts required for high-risk or operations-dependent decision-making.
Common Types of Specialist Forecasts:
Forecast Type Target Audience Primary Focus Variables
Aviation Pilots & Air Traffic Visibility, wind shear, cloud base
Marine Sailors & Fishermen Wave periodicity, gale warnings, tides
Agriculture Farmers Evapotranspiration, frost, rainfall volume
National meteorological agencies use advanced computer models to generate high-resolution updates for these unique operational need.
_
There are a number of sectors with their own specific needs for weather forecasts and specialist services are provided to these users as given below:
Air traffic:
Because the aviation industry is especially sensitive to the weather, accurate weather forecasting is essential. Fog or exceptionally low ceilings can prevent many aircraft from landing and taking off. Turbulence and icing are also significant in-flight hazards. Thunderstorms are a problem for all aircraft because of severe turbulence due to their updrafts and outflow boundaries, icing due to the heavy precipitation, as well as large hail, strong winds, and lightning, all of which can cause severe damage to an aircraft in flight. Volcanic ash is also a significant problem for aviation, as aircraft can lose engine power within ash clouds. On a day-to-day basis airliners are routed to take advantage of the jet stream tailwind to improve fuel efficiency. Aircrews are briefed prior to takeoff on the conditions to expect en route and at their destination. Additionally, airports often change which runway is being used to take advantage of a headwind. This reduces the distance required for takeoff and eliminates potential crosswinds.
_
Marine:
Commercial and recreational use of waterways can be limited significantly by wind direction and speed, wave periodicity and heights, tides, and precipitation. These factors can each influence the safety of marine transit. Consequently, a variety of codes have been established to efficiently transmit detailed marine weather forecasts to vessel pilots via radio, for example the MAFOR (marine forecast). Typical weather forecasts can be received at sea through the use of RTTY, Navtex and Radiofax.
_
Agriculture:
Farmers rely on weather forecasts to decide what work to do on any particular day. For example, drying hay is only feasible in dry weather. Prolonged periods of dryness can ruin cotton, wheat, and corn crops. While corn crops can be ruined by drought, their dried remains can be used as a cattle feed substitute in the form of silage. Frosts and freezes play havoc with crops both during the spring and fall. For example, peach trees in full bloom can have their potential peach crop decimated by a spring freeze. Orange groves can suffer significant damage during frosts and freezes, regardless of their timing.
_
Forestry:
Forecasting of wind, precipitation and humidity is essential for preventing and controlling wildfires. Indices such as the Canadian Forest fire weather index, the American Haines Index (dropped from 2025), and the Australian Fire Danger Rating System, have been developed to predict the areas more at risk of fire from natural or human causes. Conditions for the development of harmful insects can also be predicted by forecasting the weather.
_
Utility companies:
An air handling unit is used for the heating and cooling of air in a central location. Electricity and gas companies rely on weather forecasts to anticipate demand, which can be strongly affected by the weather. They use the quantity termed the degree day to determine how strong a use there will be (heating degree day) or cooling (cooling degree day). These quantities are based on a daily average temperature of 65 °F (18 °C). Cooler temperatures force heating degree days (one per degree Fahrenheit), while warmer temperatures force cooling degree days. In winter, severe cold weather can cause a surge in demand as people turn up their heating. Similarly, in summer a surge in demand can be linked with the increased use of air conditioning systems in hot weather. By anticipating a surge in demand, utility companies can purchase additional supplies of power or natural gas before the price increases, or in some circumstances, supplies are restricted through the use of brownouts and blackouts.
_
Other commercial companies:
Increasingly, private companies pay for weather forecasts tailored to their needs so that they can increase their profits or avoid large losses. For example, supermarket chains may change the stocks on their shelves in anticipation of different consumer spending habits in different weather conditions. Weather forecasts can be used to invest in the commodity market, such as futures in oranges, corn, soybeans, and oil.
_
Military applications:
Military meteorology is meteorology applied to military purposes, by armed forces or other agencies. It is one of the most common fields of employment for meteorologists. World War II brought great advances in meteorology as large-scale military land, sea, and air campaigns were highly dependent on weather, particularly forecasts provided by the Royal Navy, Met Office and USAAF for the Normandy landing and strategic bombing. Military meteorologists currently operate with a wide variety of military units, from aircraft carriers to special forces. Observing the weather is used for not only wartime efforts, but day to day operations, training, equipment testing, and humanitarian missions.
______
______
Main methods of Weather Forecasting:
Weather forecasting basically consists of two steps. The first step is to have an accurate assessment of the present/initial state of the atmosphere. This helps in identifying the different weather systems and their horizontal and vertical state. As we know, there are a variety of phenomena occurring in the atmosphere having different space and time scales. The characteristic sizes of these motions vary from a fraction to centimeter to several thousands of kilometers, with time scales of a fraction of a second to several weeks. Each of the various scales of motions has a varying degree of influence upon all the others and it is important to properly observe, analyze and account them in atmospheric studies and weather forecasting. As weather has no political boundary, one needs weather data from a fairly large region; the area from which data required increases with the duration of forecast made, since weather systems from one part of a region may travel and affect the weather condition over a far off region in course of time. The second step in weather forecasting is to utilise a suitable technique to predict the future state of the atmosphere.
_
There are several different methods that can be used to create a forecast. The method a forecaster chooses depends upon the experience of the forecaster, the amount of information available to the forecaster, the level of difficulty that the forecast situation presents, and the degree of accuracy or confidence needed in the forecast.
The first of these methods is the Persistence Method; the simplest way of producing a forecast. The persistence method assumes that the conditions at the time of the forecast will not change. For example, if it is sunny and 87 degrees today, the persistence method predicts that it will be sunny and 87 degrees tomorrow. If two inches of rain fell today, the persistence method would predict two inches of rain for tomorrow.
The persistence method works well when weather patterns change very little and features on the weather maps move very slowly. It also works well in places like southern California, where summertime weather conditions vary little from day to day. However, if weather conditions change significantly from day to day, the persistence method usually breaks down and is not the best forecasting method to use. Various methods were developed and used by meteorologists for weather forecasting. The most important methods in vogue currently are the conventional Synoptic, and Numerical Weather Prediction (NWP) methods. The former method is human subjective and the latter is objective and deterministic.
_____
Conventional Synoptic Method:
Synoptic weather forecasting is a method that uses simultaneous weather observations across large regions to predict future atmospheric conditions. The word “synoptic” means “seen together at a common point in time”. Meteorologists plot data onto synoptic weather maps (or synoptic charts) to visualize large-scale patterns. In this approach, surface and upper-air weather charts depicting the state of the atmosphere (current weather) are prepared. Isobars means lines connecting areas of equal atmospheric pressure. Tightly spaced lines mean strong winds; widely spaced lines mean gentle breezes. High-Pressure Systems are marked with an ‘H’, these areas bring clear skies and calm, stable weather. Low-Pressure Systems are marked with an ‘L’, these areas bring rising air, clouds, storms, and precipitation. Weather Fronts are boundaries separating different air masses. Cold fronts bring abrupt drops in temperature and heavy rain, while warm fronts bring steady, lighter moisture. Comparison and Extrapolation is done to compare current patterns with historical models to see how pressure systems and fronts move and change over time. Based on past experience and other forecasting tools like satellite imagery and radar pictures, forecasters come to a conclusion on the expected weather over a region. Though these forecasts are often subjective, as they depend on the expertise and skill of the forecasters, this approach is very useful for short-range forecasting, since the radar and satellite observation of clouds and precipitation are more susceptible to human interpretation because these systems do not directly look at water droplets or snowflakes; instead, they measure reflected radiation and energy wavelengths that meteorologists must translate into actual weather events. The synoptic method of weather forecasting is primarily used for short-range forecasting covering a time period of 24 to 48 hours (up to 3 days). The inadequate human understanding of the various complex atmospheric processes leading to the weather development itself is one of the major problems associated with this method.
_____
Climatology Method:
The Climatology Method is a simple way of producing a forecast. This method involves averaging weather statistics accumulated over many years to make the forecast. For example, if you were using the climatology method to predict the weather for New York City on July 4th, you would go through all the weather data that has been recorded for every July 4th and take an average. If you were making a forecast for temperature and precipitation, then you would use this recorded weather data to compute the averages for temperature and precipitation. If these averages were 87 degrees with 0.18 inches of rain, then the weather forecast for New York City on July 4th, using the climatology method, would call for a high temperature of 87 degrees with 0.18 inches of rain. The climatology method only works well when the weather pattern is similar to that expected for the chosen time of year. If the pattern is quite unusual for the given time of year, the climatology method will often fail. This method lacks the ability to account for short-term weather fluctuations and is less effective for predicting unusual or extreme weather events.
______
Analog Method:
The Analog Method is a slightly more complicated method of producing a forecast. It involves examining today’s forecast scenario and remembering a day in the past when the weather scenario looked very similar (an analog). The forecaster would predict that the weather in this forecast will behave the same as it did in the past.
For example, suppose today is very warm, but a cold front is approaching your area. You remember similar weather conditions one last week, also a warm day with cold front approaching. You also remember how heavy thunderstorms developed in the afternoon as the cold front pushed through the area. Therefore, using the analog method, you would predict that this cold front will also produce thunderstorms in the afternoon. This method requires extensive historical weather data and relies on subjective judgment in selecting relevant analogs.
The analog method is difficult to use because it is virtually impossible to find a perfect analog. Various weather features rarely align themselves in the same locations they were in the previous time. Even small differences between the current time and the analog can lead to very different results. However, as time passes and more weather data is archived, the chances of finding a “good match” analog for the current weather situation should improve, and so should analog forecasts.
_____
Numerical Weather Prediction modeling:
Numerical Weather Prediction (NWP) modeling is the most widely used and accurate method for weather forecasting. NWP involves solving a set of mathematical equations that represent the fundamental laws of physics governing the atmosphere. By assimilating vast amounts of observational data, NWP models simulate the behavior of the atmosphere, allowing forecasters to generate detailed forecasts for various weather variables.
Numerical Weather Prediction (NWP) uses the power of computers to make a forecast. Complex computer programs, also known as forecast models, run on supercomputers and provide predictions on many atmospheric variables such as temperature, pressure, wind, and rainfall. A forecaster examines how the features predicted by the computer will interact to produce the day’s weather.
_
Figure below shows Types of Forecasting models.
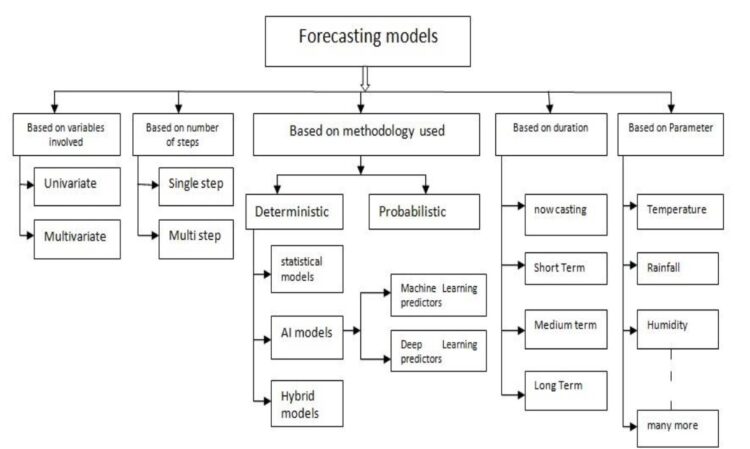
_
The NWP method is flawed in that the equations used by the models to simulate the atmosphere are not precise. This leads to some error in the predictions. In addition, the are many gaps in the initial data since we do not receive many weather observations from areas in the mountains or over the ocean. If the initial state is not completely known, the computer’s prediction of how that initial state will evolve will not be entirely accurate.
Despite these flaws, the NWP method is probably the best at forecasting the day-to-day weather changes. Very few people, however, have access to the computer data. In addition, the beginning forecaster does not have the knowledge to interpret the computer forecast, so the simpler forecasting methods, such as the trends or analogue method, are recommended for the beginner.
The first successful numerical weather prediction forecasts were generated in the early 1950s, and the method had become a valuable contributor to the forecasting problem by the 1970s. Subsequent developments in computer power, the use of satellite observations, and meteorological science have made numerical weather prediction or NWP by far the most successful approach to weather forecasting, with useful skill to 5 days ahead on average (sometimes much more) and forecasts for the first day often accurate in their detail down to weather features of a few tens of kilometres across.
Using the NWP method, a wider variety of conditions can be predicted than by means of the statistical or synoptic methods. Using NWP method, a short-range forecast is generally not prepared for the whole atmosphere but only for a local area of interest. For this purpose, we generally use a limited area model (LAM) or regional model. This produces a very detailed forecast at very small spatial scale (generally of the order of 100 km or less). For medium-range forecasts, global models treating the whole atmosphere, from the Earth’s surface to a height of about 30 km, are used. For long-range forecasts or seasonal prediction also, numerical models are used extensively. These models, called atmospheric general circulation models, have a spatial resolution (250–500 km) that is lower than that required for short-range forecasts but sufficient enough to resolve and reproduce main climatic features. For short-range and medium-range forecasts, accurate observations of the initial atmospheric state are crucial. For seasonal prediction, the initial conditions are not as crucial as the boundary conditions. The general circulation models are integrated for the whole season with observed values of sea surface temperatures as boundary conditions.
Ensemble Forecasting:
Although a NWP forecast model will predict weather features evolving realistically into the distant future, the errors in a forecast will inevitably grow with time due to the chaotic nature of the atmosphere and the inexactness of the initial observations. The detail that can be given in a forecast therefore decreases with time as these errors increase. These become a point when the errors are so large that the forecast has no correlation with the actual state of the atmosphere. So looking at a single forecast gives no indication of how likely that forecast is to be correct. Ensemble forecasting entails the production of many forecasts in order to reflect the uncertainty into the initial state of the atmosphere (due to the errors in the observations and insufficient sampling). The uncertainty in the forecast can then be assessed by the range of different forecasts produced.
______
Statistical methods:
Statistical methods of weather forecasting use historical data and mathematical relationships to predict future atmospheric conditions. Statistical forecast models are routinely used to enhance the results of dynamical (NWP) forecasts at operational weather forecasting centers throughout the world, and are essential as guidance products to aid weather forecasters. Statistical methods are used along with the numerical weather prediction. This method often supplements the numerical method.
In this approach, various statistical methods like regression, contingency tables, probability analysis, and the discriminant analysis are used to prepare the forecast the future value of a parameter. Historical meteorological data for 30–50 years are used to develop the statistical relationships between the predictand (meteorological parameter to be forecasted) and the predictors (related meteorological parameters). For short-range forecasts of heavy rain, for example, parameters like vertical velocity, or low-level convergence, moisture content, stability parameters, etc., are used as the predictors. The statistical model is then validated using some data for an independent period to assess the skill. Once the model is found to have some useful skill, then that model is introduced for the operational forecasts. The statistical approach is used successfully for all scales of forecasts from short-range to long-range.
_
A statistical approach is used, taking a number of discrete periodic cycles, based on training the model using a required sample of real data that is specific to that area. The mathematical method is based on training the model, and it adjusts the model’s parameters to reduce forecast error by comparing predicted values to actual immediate values. This method is effective and most trustworthy for forecasting temperatures over the short and medium term.
The statistical approach has the drawback that as forecasting time increases, forecasting error also does so. Despite this drawback, the approach is relatively easy to use, cheap, and flexible in terms of the modeling stages it can support. Rather of using a predetermined mathematical model, this approach is focused on patterns. The statistical method is further divided into two subdivisions:
(i) Time Series methods
(ii) Artificial Neural Network models.
_
Time Series Method:
Time series weather forecasting uses historical sequential atmospheric data to predict future weather conditions like temperature, humidity, and rainfall. Time series models are widely used in weather forecasting to analyze historical weather data and predict future conditions. Weather data, such as temperature, humidity, wind speed, and precipitation, are typically recorded at regular intervals, making them ideal for time series analysis. Here’s how time series models can be applied in weather forecasting:
-1. Short-Term Temperature Forecasting
- Using ARIMA models: Autoregressive Integrated Moving Average (ARIMA) models can be applied to predict future temperatures based on past temperature patterns. These models can capture trends, seasonality, and short-term fluctuations in temperature data.
-2. Seasonal Weather Patterns
- Handling seasonal variations: Time series models like SARIMA (Seasonal ARIMA) are particularly effective in accounting for seasonal patterns in weather data. For instance, they can predict recurring weather phenomena such as summer heatwaves or winter cold spells by factoring in the seasonality in past data.
-3. Precipitation and Rainfall Forecasting
- Predicting rainfall amounts: Time series models can help forecast the probability and intensity of precipitation based on historical rainfall patterns. This can be useful for predicting rain or drought conditions, helping farmers, urban planners, and water resource managers make informed decisions.
-4. Wind Speed and Direction Prediction
- Forecasting wind conditions: Time series models can be used to predict wind speed and direction, which is essential for aviation, marine navigation, and renewable energy (e.g., wind farms). By analyzing previous wind data, forecasters can anticipate periods of strong winds or calm conditions.
-5. Extreme Weather Event Prediction
- Detecting anomalies: Time series models, especially those using outlier detection methods, can help identify unusual weather patterns or early warning signs of extreme events like hurricanes, storms, or heatwaves. For instance, forecasting systems may use time series models to predict storm surge levels.
-6. Climate Change Impact
- Long-term forecasting: Time series models can help in predicting long-term changes in climate variables, such as global temperature rises or changes in precipitation patterns, by analyzing trends over decades. This can assist in studying the impacts of climate change and making policy decisions accordingly.
-7. Humidity and Dew Point Prediction
- Tracking moisture trends: Time series models are used to predict humidity and dew point levels, which are important for forecasting fog, frost, or other weather conditions that depend on moisture levels in the atmosphere.
-8. Multivariate Time Series Analysis
- Considering multiple factors: In weather forecasting, variables like temperature, pressure, and humidity often interact with one another. Multivariate time series models can analyze these variables simultaneously, capturing the interdependencies and improving overall forecast accuracy.
-9. Wave Height and Sea Conditions
- Forecasting ocean weather: For marine applications, time series models can predict sea surface temperatures, wave heights, and ocean currents, which are critical for shipping, fishing, and coastal management.
-10. Real-Time Forecasting and Updates
- Continuous updates: Time series models can be updated in real-time as new data becomes available. This is particularly useful in dynamic situations like storm tracking, where updated forecasts are needed frequently to improve accuracy as new information about the storm’s progression becomes available.
-11. Spatial-Temporal Models for Localized Forecasting
- Capturing both time and location effects: Time series models can be integrated with spatial data (e.g., geographic coordinates) to forecast localized weather conditions for specific regions, which is important for microclimate prediction and regional weather forecasting.
_
Applications of Specific Time Series Models in Weather Forecasting:
- ARIMA: For short-term temperature or pressure forecasting.
- SARIMA: For weather conditions with clear seasonal patterns (e.g., monsoons or winter snowstorms).
- Exponential Smoothing (ETS): For capturing trends in continuous variables like temperature or humidity.
- Vector Autoregression (VAR): For multivariate analysis involving multiple interrelated weather variables.
- State-Space Models: For dynamic real-time weather forecasting with continuous updates.
In summary, time series models are invaluable for improving the accuracy and reliability of weather forecasts, from short-term predictions to long-term climate studies. These models help meteorologists make informed decisions and communicate potential weather risks to the public.
__
Artificial neural networks:
One of the analysis paradigms, the artificial neural network, is loosely based on the extensive research on the parallel structure of the brain. The nonlinear and complex classification (or prediction) problem is handled by artificial neural networks (ANN). ANN can perform complex and nonlinear modelling without already knowing how input and variables are related to one another. An ANN is trained to understand the relationship between input data and temperature output based on historical temperature measurement data collected over a long period of time. Strong fault tolerance, real-time operation, adaptability, and cost-effectiveness are among the strengths of ANN (To learn the relationship of any mathematical formulation between inputs and outputs). Feedback (ELMAN, Recurrent), Feed-forward (BPN, MLP, RBFN), Probability Neural Network (PNN), Support Vector Machine (SVM), ADALINE, and other ANN methods are a few examples. The drawbacks of the ANN approach include sluggish convergence, falling into local minima, and difficulty in confirming the topology of a network or system. In spite of these drawbacks, the ANN method performs better than the time series method across all time scales.
_
Statistical plus NWP:
For short-range and medium-range forecasts, a statistical approach is often used in conjunction with the NWP method as a way of adding value to NWP forecasts and anchoring them in reality as represented by historical observational data. The basic purpose of the statistical technique is to quantify relationships between weather elements of interest and other meteorological variables, which can be readily forecast. There are two formulation methods used in the statistical interpretation of NWP. They are the perfect prognostic method (PPM) and model output statistics (MOS), it being the source of the data set used in their development that distinguishes them. In the PPM, statistical relationships are established between the weather element (to be forecasted) observed at time t and observed predictors (analyzed) at time t. In the MOS, instead of observed (analyzed) predictors, model forecast values are used as the predictors. The strength of PPM is stronger because it uses only observed data concurrent in time. Statistical relationships are established through multiple linear regression or nonlinear artificial neural network techniques.
______
Other methods:
Point forecasting:
Point forecasting uses analysis of historical time series and establishes a correlation between a present observation and a future occurrence. This may be of the same variable or a completely different one.
Many point forecasting rules rely on animal or plant sensitivity to subtle changes in the atmosphere that presage a coming change in the weather; others use changes in cloud or wind patterns that humans can observe directly. However, few point forecasting approaches are universally applicable in time or in space, so they have largely been superseded.
Pattern forecasting:
From the time that observations could be exchanged in real-time following the invention of the electric telegraph in 1840, weather forecasting agencies were created to collect observations and create maps of them for specific times. Pattern forecasting was particularly successful in middle latitudes, where travelling depressions could be clearly identified in pressure observations and tracked daily. In addition, the recognition of structures within these pressure patterns, such as warm and cold fronts, further enhanced the value of using pattern forecasting. Subsequent exploration of the upper air and the recognition that jet streams were both highly coherent in time and provided a guide to the evolution of surface depressions led to the full flowering of the synoptic forecasting method in the mid-20th century.
______
Traditional Weather Forecasting Methods to AI methods to hybrid methods:
Traditional weather prediction methods rely on numerical models that simulate atmospheric processes based on physical principles. While these models provide valuable insights, they can be computationally intensive and may struggle to capture the complexity of real-world weather phenomena. Additionally, historical data analysis serves as a fundamental component of traditional forecasting, leveraging past observations to identify patterns and trends in weather behavior (Abhishek et al., 2012).
Figure below depicts traditional weather forecasting methods, involving numerical models and historical data analysis.
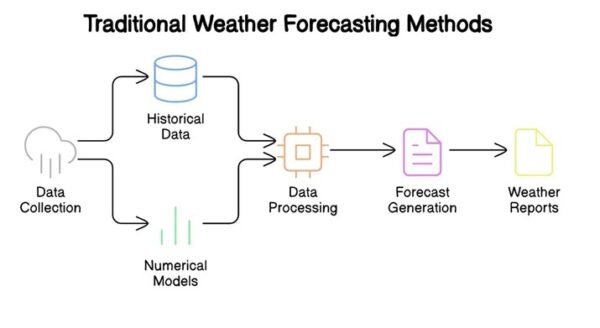
_
The Emergence of Machine Learning in Weather Forecasting:
In recent years, machine learning has emerged as a powerful complement to traditional forecasting methods. ML algorithms, including regression, classification, and neural networks, are adept at extracting intricate patterns from vast datasets encompassing historical weather observations, satellite imagery, and atmospheric data. By leveraging these algorithms, weather forecasters can enhance prediction accuracy and scalability, enabling more reliable forecasts over longer time horizons (Biswas et al., 2014).
Figure below illustrates the integration of machine learning techniques in weather forecasting, leveraging vast datasets to improve prediction accuracy.
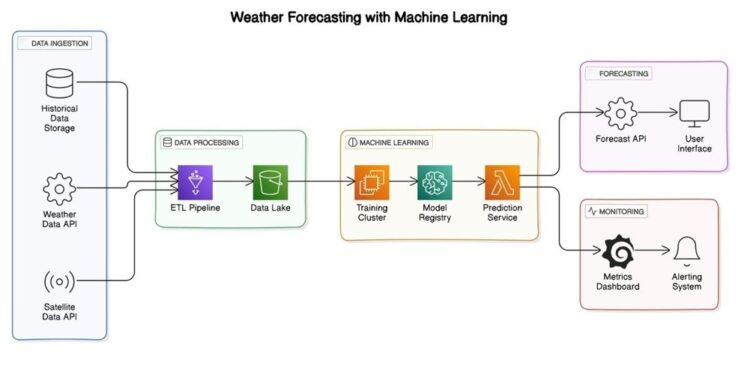
These diagrams visually depict the contrast between traditional forecasting methods and the integration of machine learning techniques, underscoring the transformative potential of ML in revolutionizing weather prediction.
__
Due to the inclusion of processes that are both expensive and complex, the conventional weather forecasting techniques that rely on satellite imagery and weather stations are expensive (Pemberton, J. C., & Greenwald, L. G. 2002). Machine learning is used to produce weather forecasts that are affordable, quick, convenient, accurate, and real-time. The use of a significant amount of historical weather data was involved in a few recent studies on weather forecasting, including machine learning techniques (Scher, S., & Messori, G. 2018). The models being used for training determine how accurate the forecasts will be. Therefore, using extremely precise data to train any machine learning model becomes crucial. The information obtained from various sources is not always reliable. Pre-processing the data becomes necessary as a result. The removal of unnecessary columns that are unrelated to the model’s forecast, the elimination of zero values, the merging of similar columns, and other preprocessing steps are all included in the preparation of the data (Lai et.al. 2004).
Machine learning is typically resilient to inconveniences and doesn’t depend on additional physical factors for expectation. As a result, AI has greatly improved opportunities for advancing climate estimation (Dewitte, S. et.al. 2021). Climate estimation was a difficult problem to solve before the development of technology. With less accuracy, climate forecasters relied on satellite data and environmental information models. With the use of the Internet of Things in recent years, climate forecasting and research have unimaginably improved in terms of accuracy and consistency. In the past ten years, experts have given a great deal of thought to using the intensity of AI-related strategies to provide a superior and effective arrangement of this information-request test, which contains derivations from existence (Ly, H. et. al. 2019).
__
Initial attempts to use artificial intelligence began in the 2010s. Huawei’s Pangu-Weather model, Google’s GraphCast, WindBorne’s WeatherMesh model, Nvidia’s FourCastNet and Earth-2, Jua’s EPT-family models, and the European Centre for Medium-Range Weather Forecasts’ Artificial Intelligence/Integrated Forecasting System, or AIFS all appeared in 2022–2023. In 2024, AIFS started to publish real-time forecasts, showing specific skill at predicting hurricane tracks, but lower-performing on the intensity changes of such storms relative to physics-based models. Such models use no physics-based atmosphere modeling or large language models. Instead, they learn purely from data such as the ECMWF re-analysis ERA5. These models typically require far less compute than physics-based models.
Microsoft’s Aurora system offers global 10-day weather and 5-day air pollution (CO2, NO, NO2, SO2, O3, and particulates) forecasts with claimed accuracy similar to physics-based models, but at orders-of-magnitude lower cost. Aurora was trained on more than a million hours of data from six weather/climate models.
In 2024, a group of researchers at Google’s DeepMind AI research laboratories published a paper in Nature to describe their machine-learning model, called GenCast, that is expected to produce more accurate forecasts than the best traditional weather forecasting systems.
In a study conducted using the AIFS, Lang et al. (2024) presented 30-day ensemble simulations of the Madden–Julian oscillation.
_______
Hybrid Methods of Forecasting:
The hybrid approach combines several methodologies to forecast wind speed and power precisely over a range of time scales. The goal of the hybrid technique is to benefit from each method’s strengths and achieve the best forecasting accuracy possible. Combinations can take the following forms:
- Statistical and physical (NWP) methods (time series)
- Physical method along with statistical method (ANN)
- Novel and statistical method
- Novel method and a physical method
- Evolutionary Computation (EC) + Fuzzy
- Wavelet transform + Fuzzy
- ANN + Fuzzy
- EC+ANN
- Fuzzy + time series
- NWP + time series
- ANN + time series
- NMP + AI/ML
The benefits of hybrid approaches include avoiding overtraining and excessive computation costs, minimizing forecasting error to reach the best forecasting accuracy, avoiding the local minima problem, and accelerating convergence. One drawback of the hybrid method is that there are situations in which it performs worse than the single method.
_______
_______
Weather models:
All weather forecasts involve inputting data in the form of observations-readings from weather balloons, buoys, satellites, and other instruments-into models that predict future states of the atmosphere. Model outputs are then transformed into useful products such as daily weather forecasts, storm warnings, and fire hazard assessments. Current forecasting methods are based on NWP, a mathematical framework that models the future of the atmosphere by treating it as a fluid that interacts with water bodies, land, and the biosphere. Models using this approach include the European Centre for Medium-Range Weather Forecasts’ (ECMWF) Integrated Forecasting System (IFS) model (widely considered the gold standard in modern weather forecasting), the National Center for Atmospheric Research’s Weather Research and Forecasting model, and NOAA’s Global Forecasting System.
_
Weather models are used to help predict the weather. They involve mathematical equations based on physics that characterises how air moves around and how heat and moisture are exchanged between the atmosphere and the Earth’s surface. The equations are written in a language that computers can understand, known as computer code. For example, the core of many weather models is written in the Fortran computer language due it its computational efficiency i.e. the computer code can produce forecasts much faster than other computer languages.
_
The equations in a weather model are complex and depend on location and time. To solve these mathematically for a time in the future (i.e. to use the equations to predict the weather), we must provide the equations with information about the current state of the atmosphere and Earth’s surface. This information is gained from weather observations recorded by ground sensors, weather balloons, buoys, ships, and remote sensing instruments such as satellites. Weather observations such as pressure, wind, temperature and moisture and fed to the model in a process known as data assimilation. In order to produce useful weather forecasts, we must provide the model with a starting point, called the initial state, that is as accurate as possible. The Navier-Stokes equations are a set of mathematical formulas that describe how fluids—both liquids and gases—move. Navier-Stokes equations and Boyle’s Law which describes the inverse relationship between the pressure and volume of a gas are used in the models.
_
In the weather model, the atmosphere is divided into a three-dimensional grid as shown on the figure below. At each grid point, the equations are stepped forward in time. The outputs from the equations at each grid point, and over many future time steps, specify the predicted weather at future times over an area covered by the grid points. Models use systems of differential equations based on the laws of physics, fluid motion, and chemistry, and use a coordinate system which divides the planet into a 3D grid. Winds, heat transfer, radiation, relative humidity, and surface hydrology are calculated within each grid and evaluate interactions with neighboring points. A mathematical technique called discretization is integral to modeling an enormous and complex physical phenomenon like weather. Scientists partition Earth’s atmosphere into thousands of three-dimensional cubes as seen in figure below.
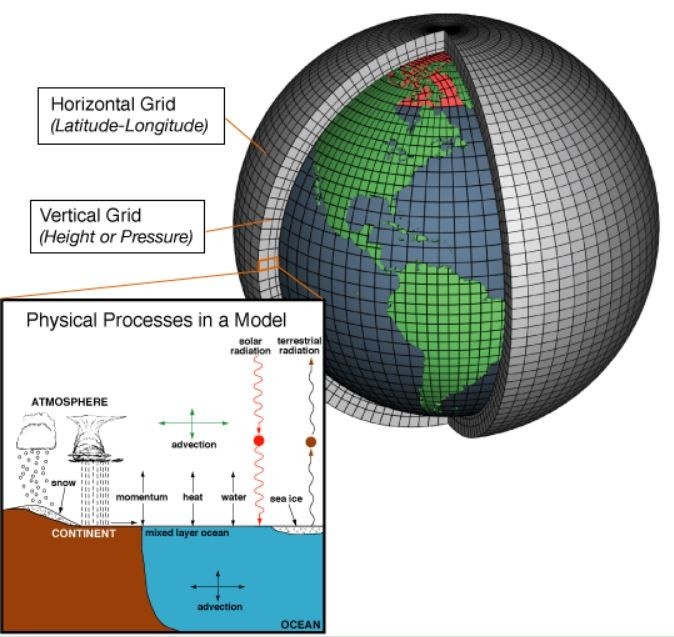
Figure above is a schematic diagram of a dynamical weather model. To obtain weather forecasts, a numerical weather model divides the Earth’s atmosphere into a three-dimensional grid. For each grid point, relevant atmospheric parameters (such as temperature, humidity, wind speed, and pressure) are calculated at various altitudes and at fixed time intervals.
_
In each discrete portion, scientists track variables like temperature and pressure to gain a comprehensive view of weather around the world. It is crucial to track all discrete portions, even those in the atmosphere and in the ocean, because the behavior within one portion impacts all of its neighbors. Critically, data on turbulence—which is responsible for the redistribution of heat, moisture, and momentum—and similar modes of energy transfer must be captured in the portions adjacent to Earth’s surface.
Improvements in weather forecast models stem from finer discretizations (i.e., smaller cubes, and lots of them) of Earth’s atmosphere. The language of mathematics is critical for developing finer discretizations and implementing them in numerical weather prediction models.
Data are incorporated into models on a streaming basis; this is called data assimilation. Missing observations can be approximated using statistical techniques. A variety of new and improved instruments increase accuracy in assessing the current state of the weather system. All numerical models of the atmosphere are based on the same physical laws like the conservation of mass, momentum and energy. But they differ in the concrete mathematical formulation and in the numerical solution procedures of the set of equations.
_
Numerical weather prediction (NWP) models describe the essential physical processes in the atmosphere, at the surface and in the soil and take their impact on the temporal evolution of the model variables like pressure, temperature, wind, water vapour, clouds and precipitation into account. Many physical processes in the atmosphere or at the surface like the formation of clouds or the interaction between solar radiation and cloud droplets take place on very small spatial scales which cannot be resolved explicitly by the NWP models. The impact of these unresolved processes on the model variables has to be included approximately via so-called parameterization schemes.
_
To solve the complex set of model equations on computers different numerical methods can be employed. In grid point models the temporal evolution of the model variables are calculated in a three-dimensional spatial grid which covers the atmosphere from the surface up to a given model top, e.g. at 75 km above the ground. A very important characteristic of the model grid is the grid spacing, i.e. the horizontal distance of neighbouring grid points. The smaller the grid spacing, the more detailed atmospheric structures can be resolved by the numerical prediction model. The vertical distance of grid points, called layer depth, varies between a few meters close to the surface to several hundred meters at higher altitude.
_
A global forecast model is a weather forecasting model which initializes and forecasts the weather throughout the Earth’s troposphere. It is a computer program that produces meteorological information for future times at given locations and altitudes. Within any modern model is a set of equations, known as the primitive equations, used to predict the future state of the atmosphere. These equations—along with the ideal gas law—are used to evolve the density, pressure, and potential temperature scalar fields and the flow velocity vector field of the atmosphere through time. Additional transport equations for pollutants and other aerosols are included in some primitive-equation high-resolution models as well. The equations used are nonlinear partial differential equations which are impossible to solve exactly through analytical methods, with the exception of a few idealized cases. Therefore, numerical methods obtain approximate solutions. Different models use different solution methods: some global models and almost all regional models use finite difference methods for all three spatial dimensions, while other global models and a few regional models use spectral methods for the horizontal dimensions and finite-difference methods in the vertical.
_
The motion of air in the atmosphere is extremely complicated. From large-scale synoptic motion we see high and low pressure systems at the surface and ridges and troughs in the air aloft. Embedded in synoptic motion is mesoscale motion from which we see sea breezes, drylines, and squall lines, etc. Even smaller than mesoscale is microscale, which is typically too small to be depicted on weather maps. This scale includes things like fair weather cumulus clouds (small clouds) that are here one minute and gone the next.
_
All weather is caused by atmospheric motions that can be described by mathematical equations. From these equations, we can calculate future motions. Numerical weather prediction is the use of computers to model the atmosphere and predict how atmospheric motions change both horizontally and vertically with time.
There are two basic sizes of models: global (covering the entire Earth) and regional (covering part of the Earth). Each of these models utilizes a grid system where forecast points are laid out in a grid over the area they cover. The distance between centers of these grids, called grid points, vary with scale and design of the model.
The more grid points there are in any model, the finer the resulting detail in the forecast. However, as the number of grid points increases, so does the need for more computing power.
For example, a forecast for 6 x 6 grid (36 forecast points) needs four times the computing time as a 3 x 3 grid (9 forecast points) even though the actual physical area remains the same as seen in figure below. Forecast precision improves at the cost of four times the number of calculations used to produce a forecast for the same physical area.
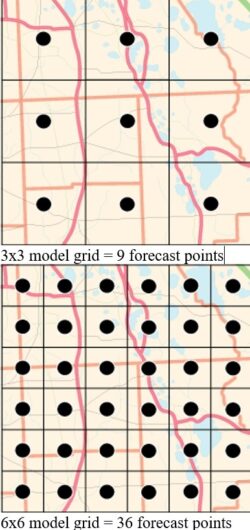
_
Regardless of the grid size, all models must know the initial condition to begin computations in order to make a forecast. A variety of weather data is input into the model from radiosondes, weather satellites, surface observations over land and sea, as well as information from commercial aircraft in a process called initialization (1 in image below).
Upon the input of this initial data, the computer will use mathematical equations to calculate a future state of the atmosphere in a “time step”. Depending upon the type of model and aerial coverage, a time step interval can be as short as a few seconds or as long as several minutes. (2 in image below). The resulting state of the atmosphere calculated at the end of the time step (3 in image below) then becomes the new initialization input for a repeat of calculations (4 in image below) for the next time step. This gives the new time step result (5 in image below).
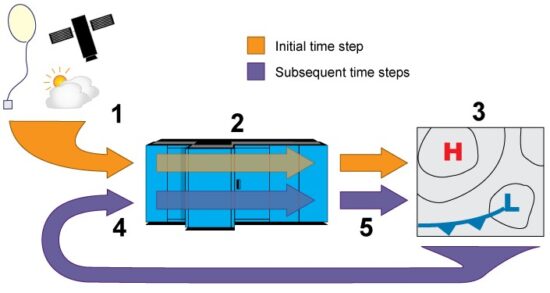
This process, where the result of the previous time step becomes the initial input for the next time step, repeats itself until the end of the model run.
The length of the time step greatly affects model accuracy. Smaller time step intervals produce more accurate forecasts as there is less variation in output at the end of each computation. But the cost is that smaller time steps require more computations. Conversely, large time step intervals require less computation time but introduce larger variations in output.
Therefore, a trade-off exists between time step interval lengths and grid sizes verses computational power. In the future, as computing power increases, we will be able to have smaller time step intervals and smaller grid sizes leading to more accurate forecasts.
For now, this is why weather models are generally accurate out four days or so. Beyond about day 4, differences from one model run to the next begin to show increasing variations in forecasts.
The weather models have continually improved in accuracy and will continue to do so in the future. As computers become faster, the grids will become smaller for better horizontal and vertical resolution. Also, the math used in the calculations will improve as more data become available to provide better initialization.
_
Supercomputers are used for the trillions upon trillions of computations needed to produce weather models. For example, the Global Forecast System model needs over 10 quadrillion (10 with 16 zeros) calculations for a complete model run forecast that takes two hours to complete the process. This model runs four times daily.
The NCEP Environmental Modeling Center produces several models with varying time scales and grid sizes. The Global Forecast Systems suite of models covers the largest scale, and there are several regional models, such as the North American Mesoscale Forecast Systems (NAM) and Rapid Refresh (RAP).
_
Met Éireann scientists are involved in the development of a configuration of the ALADIN-HIRLAM Numerical Weather Prediction system, called HARMONIE-AROME. HARMONIE-AROME is a limited area model which means that it solves the model’s equations over a selected area of the globe – in this case the model’s domain covers Ireland, the UK and part of northern France. Because of its limited area, the model is only used for short-range forecasts up to a few days ahead. For longer forecasts, we use the European Center for Medium-Range Weather Forecasts (ECMWF) model which covers the entire globe. The horizontal grid spacing in the HARMONIE-AROME model, run by Met Éireann, is currently 2.5 km compared to approximately 9 km in the ECMWF model. The higher resolution HARMONIE-AROME model tends to be able to forecast small weather features such as thunderstorms, better than coarser resolution global models, and is therefore more useful for forecasting high impact weather.
______
______
What is Weather Model Resolution?
Spatial Resolution:
The distance between the grid points determines the model’s spatial resolution; larger grid spacings result in coarser resolutions. Typically, when referring to the resolution of a weather model, we consider the spacing of grid points at the Equator, where the Earth’s circumference is largest. The grid size varies with latitude, generally decreasing towards the poles due to the convergence of meridians.
Currently, a 1 km spatial resolution is considered very high. With a high spatial resolution of 1 km or less, many local and dynamic effects which are not captured by models with larger grid cells can be mapped, greatly refining and thus improving weather forecasts at the local level. When we refer to “1 km,” “6 km,” or “10 km” resolution, it actually means km² for the grid cell area. When transitioning from a model with a 1 km² grid, such as EURO1k, to a model with a 6 km² grid, such as ICON EU, or a 10 km² grid, such as ECMWF, the resolution decreases exponentially by factors of 36 and 100, respectively.
Temporal Resolution:
A high temporal resolution, on the other hand, means that changes in weather are detected by the model over short time intervals – such as every 20 minutes for the high-resolution EURO1k model. For comparison, the global weather model ECMWF has a temporal resolution of 6 hours. Again, higher resolution allows us to physically model the changes to the atmospheric circulation at shorter timescales, producing more reliable forecasts.
_______
Why are there different models?
Meteorologists use many different models for weather forecasting, often depending on what exactly they are hoping to forecast. A local model run over a specific region provides very different information than a global model that spans the Earth. Each weather model involves choices about what data to include, what mathematical equations will create the best simulations of atmospheric phenomena, and how to prioritize what types of forecasts are most important. No model can forecast every weather event with high accuracy. Instead, meteorologists make choices about what they want to predict and design the model to have high accuracy for that kind of result.
_
Models vary in several ways:
- Resolution: Higher-resolution models capture finer details but cover smaller areas and shorter timeframes.
- Physics and Parameterization: Each model handles clouds, precipitation, and terrain differently, affecting accuracy in specific conditions
- Update Frequency: Some models, like HRRR, update hourly, while global models may update 1–2 times per day
- Ensemble Systems: Many models run multiple simulations with slightly varied initial conditions to estimate forecast confidence and uncertainty, such as ECMWF’s ensemble system
_
Types of Weather Models:
Weather forecast models can be categorized into three main types: global models, mesoscale models, and microscale models.
-1. Global Models
Global weather forecast models cover the entire globe and provide forecasts on a large-scale basis. These models use a grid system to divide the Earth’s surface into numerous points for analysis and prediction. Two well-known global weather models are the Global Forecast System (GFS) and the European Center for Medium-Range Weather Forecasts (ECMWF) model. Major global weather models provide forecasts ranging from 10 days to 16 days ahead for medium-range predictions, and up to several months for seasonal outlooks.
GFS
The Global Forecast System (GFS) is a global numerical weather prediction model developed by the National Weather Service (NWS) in the United States. It utilizes a complex system of mathematical equations to simulate atmospheric conditions worldwide. The GFS model provides forecasts for a wide range of weather phenomena, including temperature, precipitation, wind, and atmospheric pressure. The GFS updates four times per day and forecasts out to sixteen days.
ECMWF
The European Center for Medium-Range Weather Forecasts (ECMWF) model is another global numerical weather prediction model that is highly regarded for its accuracy. It employs advanced data assimilation techniques and sophisticated numerical algorithms to simulate atmospheric processes. The ECMWF model provides high-resolution forecasts for various meteorological variables, enabling forecasters to make more precise predictions. The ECMWF updates twice a day and generates a 10-day forecast, but is higher resolution than the GFS and has, historically, generated more accurate forecasts.
-2. Mesoscale Models
Mesoscale numerical weather prediction models focus on specific regions such as entire nations and provide forecasts at a higher resolution compared to global models. These models are particularly useful for predicting localized weather phenomena and severe weather events. A mesoscale weather model typically covers a short-to-medium-range forecast period spanning from 12 hours to 84 hours (about 3.5 days) ahead.
NAM
The North American Mesoscale Forecast System (NAM) is a mesoscale weather forecast model developed by the National Centers for Environmental Prediction (NCEP) in the United States. It offers high-resolution forecasts for North America, including detailed predictions of temperature, wind, precipitation, and atmospheric instability. The NAM model plays a vital role in predicting severe thunderstorms, winter storms, and other mesoscale weather features. NAM is a short-range regional model that covers all of North America and generates forecasts 61 hours out.
HRRR
The High-Resolution Rapid Refresh (HRRR) model is another mesoscale model widely used in weather forecasting. It provides short-term forecasts with very high temporal and spatial resolution, making it valuable for predicting rapidly evolving weather phenomena, such as thunderstorms, convective systems, and fog. The HRRR model leverages advanced assimilation techniques and radar data to enhance its forecast accuracy.
-3. Microscale Models
Unlike larger-scale weather forecast models that cover larger regions like countries or continents, microscale models zoom in on small areas, such as cities or neighborhoods. Microscale models take into account the unique characteristics of the local terrain, land use, and urban features that can significantly influence the weather patterns within a small area. These models utilize high-resolution data and complex algorithms to simulate atmospheric processes at a fine scale, capturing details such as local wind patterns, temperature variations, and the effects of urban heat islands. A microscale weather model typically forecasts short time periods ranging from a few seconds up to 24 to 48 hours ahead.
_______
Why do different models predict different outcomes?
First, forecast models differ in how they collect the current weather conditions across the globe. Even with a sophisticated measurement network including satellites, radars, weather balloons, ground-based weather stations, planes and ships, forecast models must make assumptions to fill in the gaps between actual weather observations, in places like oceans, large forests, deserts, etc.
Second, forecast models differ in the math and physics equations that they use to move from the current condition of the atmosphere and turn that into a weather prediction. Small changes in these equations can lead to rather substantial differences in forecasts.
And third, forecast models have different levels of detail (resolution) and can struggle to properly account for steep terrain like the mountains where we ski and ride. This is where a local forecaster can help because they can adjust the model forecasts based on their experience of seeing when the model does a good job versus times when the model is less accurate.
To achieve a “perfect” weather forecast that exactly reproduces the actual weather, modelers would need every current condition for every point on the face of the earth. In addition, they would need a model whose construction could take all of these readings and produce the exact weather forecast for each of those points. Since modelers work from an incomplete initial dataset (presently, it’s impossible to measure every location on the earth simultaneously), they have developed a variety of techniques to APPROXIMATE the forecast. These techniques yield very good results, but they are not perfect. These factors contribute to divergent predictions among weather forecast models, highlighting the need for forecasters to consider ensemble forecasting and analyze multiple model outputs to gain a comprehensive understanding of the possible weather scenarios.
All of these factors play a role in creating different forecast outcomes even though the models are starting with mostly the same information about the current state of the atmosphere. In a nutshell, besides physics and maths, there are lot of assumptions and approximations in every model.
_
Choosing the Right Tool:
Each model has its sweet spot. Here’s a quick cheat sheet:
|
Model |
Best For |
Region |
|
ECMWF |
Accuracy, storm tracks |
Europe, global mid-latitudes |
|
GFS |
Quick updates, tropical systems |
Americas, tropics |
|
ICON |
Mountain effects, European precision |
Central Europe |
|
UKMO |
Maritime weather, frontal systems |
UK, North Atlantic |
|
JMA |
Typhoons, monsoon cycles |
East Asia |
|
COSMO |
Convection, terrain-driven events |
Alps, Central Europe |
|
ICON-EU |
High-resolution short-range forecasts, alpine effects |
Europe |
_
Which forecast model is the most accurate?
Below is a chart showing the accuracy scores for 5-day forecasts for the northern hemisphere from several of the commonly used forecast models over the past 23 years. The ranking from most skilful to least skilful is based on the one-year average accuracy of five-day forecasts. A higher number means that the model is more accurate. All four of these models cover the globe. While any model can more accurately predict a single storm, the European model has been and continues to be the most accurate.
-1. European Model (ECM = 0.920)
-2. British Model (UKM = 0.902)
-3. American Model (GFS = 0.888)
-4. Canadian Model (CMC = 0.883)
___
Statistician George Box once said “All models are wrong but some are useful”. Every weather model has its strengths and weaknesses. Over time weather forecasters gain extensive knowledge on the pros and cons of different weather models for different weather regimes. Forecaster experience and knowledge is vital for producing weather forecasts and issuing warnings of severe weather. The science behind weather forecasting will continue to evolve and improve as models and computer technology become more advanced. Here we have predominantly discussed short and medium range weather models. Similar code and equations are used in monthly, seasonal, decadal and climate models but they vary in complexity, involve different components of the Earth system and use different assumptions and methods of initialisation.
_______
_______
Reading and Interpreting Forecast:
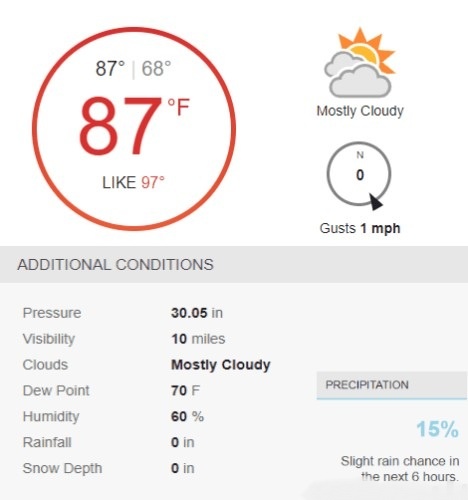
Understanding the layout of a weather forecast is akin to reading a map. Visual cues are invaluable in quickly grasping forecasted conditions. Weather symbols give a general overview of the day so it’s important to decipher weather symbols. Familiarize yourself with key components like temperature, precipitation, wind speed, humidity, and atmospheric pressure:
- Temperature: The forecasted high and low temperatures indicate the expected range of temperature for the day.
- Precipitation: This element denotes the chance of rain, snow, or other forms of precipitation, often expressed as a percentage. Probability of precipitation (PoP) indicates the likelihood that precipitation will occur at an exact forecast location. A higher percentage indicates a greater chance of rain, snow, or any other form of precipitation occurring within the forecasted time frame. Additionally, forecasts may include additional details such as the expected duration of the precipitation event.
- Wind Speed and Direction: Look for information on wind speed and direction to determine how breezy or gusty it will be.
- Humidity: Humidity levels indicate the amount of moisture present in the air, influencing how comfortable or sticky it might feel.
- Atmospheric Pressure: Atmospheric pressure provides insights into potential weather patterns, such as high or low-pressure systems. High pressure often means dry weather with sunshine. Low pressure often means clouds and precipitation.
______
Be on the Lookout for Severe Weather:
In addition to reading and interpreting weather forecasts, it is important that community and business leaders know the signs of incoming severe weather. Below are typical forecast descriptions and elements for dangerous weather events commonly experienced in the United States.
-1. Severe Thunderstorms:
These convective events are characterized by intense thunder and lightning, strong winds, heavy rain, and sometimes hail. Weather forecasts for severe thunderstorms may include the following information:
- Thunderstorm Outlook: Forecasts may provide an outlook indicating the likelihood of severe thunderstorms in a specific area. This outlook could be categorized as “Slight Risk,” “Enhanced Risk,” “Moderate Risk,” or “High Risk,” depending on the severity and coverage of the storms.
- Severe Thunderstorm Watch: A watch will be issued when conditions are favorable for the development of severe thunderstorms in and close to the watch area.
- Severe Thunderstorm Warning: A Severe Thunderstorm Warning will be issued when a severe thunderstorm is detected or imminent. A severe thunderstorm produces winds of 58 mph or greater and/or hail of 1 inch in diameter or greater.
- Timing and Duration: Forecasts often provide an estimated time frame for when severe thunderstorms are expected to occur. This information helps people prepare and take necessary precautions.
- Wind Speeds: The forecast may include details about the expected wind speeds associated with the severe thunderstorms. Higher wind speeds increase the risk of downed trees, power outages, and property damage.
- Hail Potential: Since severe thunderstorms can produce hail, forecasts may indicate the size and potential impact of hailstones. Larger hailstones pose a higher risk of property damage and can be dangerous for individuals caught outside.
- Heavy Rainfall: Forecasts may include information about the expected rainfall rates during severe thunderstorms. Excessive rainfall can lead to flash floods, causing rapid rises in water levels and potential damage to homes and infrastructure.
-2. Tornadoes:
Tornadoes are violent rotating columns of air that extend from a thunderstorm to the ground. When severe weather forecasts indicate a heightened risk of tornadoes, they may include the following details:
- Tornado Watch: A tornado watch is issued when atmospheric conditions are favorable for tornado development. It covers a specific area and time frame, indicating that tornadoes are possible, and people should stay alert.
- Tornado Warning: A tornado warning is issued when a tornado has been sighted or detected by radar or is imminent. It means that people in the warned area should take immediate action to protect themselves.
- Enhanced Fujita Scale: Forecasts may mention the Enhanced Fujita Scale (EF Scale), which rates the intensity of tornadoes based on damage surveys. The EF Scale ranges from EF0 (weakest) to EF5 (strongest) and helps convey the potential severity of tornadoes in the forecasted area. An EF0 tornado produces wind speeds of 65-85mph which can still cause significant damage.
- Tornado Paths: If possible, forecasts may provide information about the potential paths or tracks that tornadoes might follow. This information helps residents in the warned area take precautions and seek shelter in the safest possible locations.
-3. Hurricanes:
Hurricanes are large, powerful tropical cyclones with sustained winds of 74 miles per hour (119 kilometers per hour) or higher. When forecasting hurricanes, the following information may be included:
- Hurricane Watches and Warnings: Watches and warnings are issued to alert people of potential hurricane threats. A hurricane watch means that hurricane conditions are possible in a specific area within 48 hours, while a hurricane warning indicates that hurricane conditions are expected within 36 hours. These alerts help residents prepare and take necessary actions.
- Projected Path: Forecasts typically include a projected path or track for the hurricane, based on current data and predictive models. This track provides an estimate of where the hurricane is expected to make landfall or move within a specific time frame. It is important to remember that anyone within the forecast cone, not just the track, should expect potential impacts.
- Intensity and Category: Forecasts may mention the expected intensity of the hurricane and its corresponding category on the Saffir-Simpson Hurricane Wind Scale. The scale ranges from Category 1 (weakest) to Category 5 (strongest) and provides an indication of the potential wind speeds and storm surge associated with the hurricane.
- Rainfall and Flooding Potential: Forecasts often provide information about the expected rainfall amounts associated with the hurricane. Heavy rainfall can lead to widespread flooding, especially in coastal areas and low-lying regions.
- Storm Surge: Storm surge, the abnormal rise in water levels along the coast, is a significant concern during hurricanes. Forecasts may include details about the potential storm surge height, helping coastal residents understand the magnitude of the coastal flooding threat.
It is important to note that severe weather conditions, such as severe thunderstorms, tornadoes, and hurricanes, require continuous monitoring, and individuals and businesses should rely on official updates and follow the guidance of local authorities and meteorological agencies to ensure their safety.
_______
_______
Climate change and weather forecasting:
Humans are responsible for global warming. Climate scientists have showed that humans are responsible for virtually all global heating over the last 200 years. Global warming changes the Earth’s weather by adding more heat and moisture to the atmosphere, which fuels stronger and more unpredictable events. Climate change makes global weather more extreme and unpredictable by trapping heat and adding extra energy and moisture to the atmosphere. As global temperatures rise, the natural water and air cycles change. This warming affects the water cycle, shifts weather patterns, and melts land ice — all impacts that can make extreme weather worse. As Earth’s climate changes, it is impacting extreme weather across the planet. Record-breaking heat waves on land and in the ocean, drenching rains, severe floods, years-long droughts, extreme wildfires, and widespread flooding during hurricanes are all becoming more frequent and more intense.
_
Major Effects on Weather
- Higher Temperatures: Earth’s average temperature continues to rise, leading to more intense and frequent heatwaves.
- Heavier Rainfall: Warmer air holds more water vapor—about 3.5% more for every degree Fahrenheit of warming—which causes major storms to drop heavier rain and trigger severe floods.
- Longer Droughts: Higher heat causes more evaporation from soil and plants, drying out land faster and intensifying droughts in many regions.
- Stronger Storms: Warmer sea surface temperatures provide extra energy to fuel powerful storms and hurricanes.
- Slowed Jet Streams: A warmer planet disrupts the jet stream, causing weather systems to stall and prolonging extreme conditions like heatwaves or heavy downpours in a single area.
_
Climate change makes it trickier to forecast the weather:
Climate change makes it more difficult to predict the weather, because as the Earth heats up, it causes weather patterns to change and get more extreme. Traditionally, weather forecasters relied on their understanding of past weather patterns – basically what “normal” weather looks like for a given place – to predict future weather conditions. But the future no longer looks like the past. When you start looking at the data, 7 out of the last 10 Atlantic hurricane seasons were above normal. Abnormally hot ocean water in the Atlantic and Caribbean has helped drive relentless hurricane activity in the last decade. A similar pattern is playing out with floods, which are often caused by intense rainfall that’s getting more common as the Earth’s atmosphere warms and holds more moisture.
_
The National Weather Service has changed how it presents extreme weather forecasts in response to climate change:
Changes in extreme weather have led the weather service to change some of the most basic tools it uses to communicate with the public. In recent years, the National Hurricane Center has overhauled the maps and other graphics it uses to warn people about the hazards from hurricanes. Now, there are new storm surge warnings, new language about how quickly storms can intensify before hitting land and a new hurricane track forecast map that will roll out later this summer and will include warnings about flooding and other hazards.
In 2017, the weather service had to add new colors to its rainfall map for Hurricane Harvey, which dumped an unprecedented amount of rain in Texas. And a new color-coded heat warning system was introduced this spring to better warn people about dangerously hot weather.
The goal is to make it clear to the public that weather norms are changing, and they need to prepare for weather they might not have experienced in the past.
______
______
Tropical cyclone forecasting:
Tropical cyclone forecasting is the science of forecasting where a tropical cyclone’s center, and its effects, are expected to be at some point in the future. There are several elements to tropical cyclone forecasting: track forecasting, intensity forecasting, rainfall forecasting, storm surge, tornado, and seasonal forecasting. While skill is increasing in regard to track forecasting, intensity forecasting skill remains unchanged over the past several years. Seasonal forecasting began in the 1980s in the Atlantic basin and has spread into other basins in the years since.
_
A tropical cyclone forecast model is a computer program that uses meteorological data to forecast aspects of the future state of tropical cyclones. There are three types of models: statistical, dynamical (NWP), or combined statistical-dynamic. Dynamical models utilize powerful supercomputers with sophisticated mathematical modeling software and meteorological data to calculate future weather conditions. Statistical models forecast the evolution of a tropical cyclone in a simpler manner, by extrapolating from historical datasets, and thus can be run quickly on platforms such as personal computers. Statistical-dynamical models use aspects of both types of forecasting. Four primary types of forecasts exist for tropical cyclones: track, intensity, storm surge, and rainfall. Dynamical models were not developed until the 1970s and the 1980s, with earlier efforts focused on the storm surge problem. Track models did not show forecast skill when compared to statistical models until the 1980s. Statistical-dynamical models were used from the 1970s into the 1990s. Early models use data from previous model runs while late models produce output after the official hurricane forecast has been sent. The use of consensus, ensemble, and superensemble forecasts lower errors more than any individual forecast model. Both consensus and superensemble forecasts can use the guidance of global and regional models runs to improve the performance more than any of their respective components. Techniques used at the Joint Typhoon Warning Center indicate that superensemble forecasts are a very powerful tool for track forecasting.
_
Meteorologists worldwide use modern technology, such as satellites, weather radars and computers, to track tropical cyclones as they develop. Tropical cyclones can be challenging to forecast, as they can suddenly weaken or change their course. However, meteorologists use state-of-the-art technologies and develop modern techniques such as numerical weather prediction models to forecast how a tropical cyclone evolves, including its movement and change of intensity; when and where one will hit land and at what speed. National Meteorological Services of the concerned countries then issue official warnings. Around 85 tropical storms form annually over the world’s warm tropical oceans. Among these, just over half (45) become tropical cyclones/hurricanes/typhoons. Proportionately, out of 85 tropical storms, 72% form in the northern hemisphere, and 28% in the southern hemisphere.
_
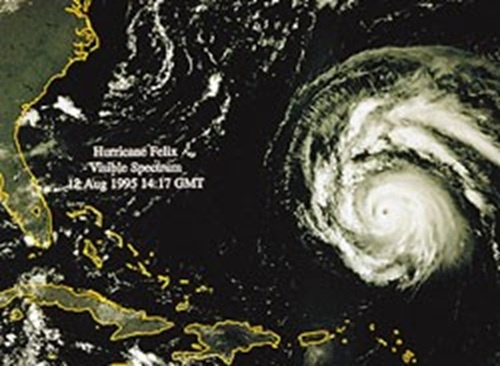
Hurricane Felix 1995 approaches the Bahamas and Florida in this image above taken from a weather satellite in orbit about 22,300 miles (35,900 kilometers) above the earth. Only satellites can provide images of the weather over vast expanses of the earth’s surface, making satellites an essential part of modern storm detection.
_
As a result of international cooperation and coordination, tropical cyclones are increasingly being monitored from their early stages of formation. WMO allows timely and widespread dissemination of information about tropical cyclones. WMO coordinates activities at global and regional levels through its Tropical Cyclone Programme. The Regional Specialized Meteorological Centres with activity specialization in tropical cyclones, and Tropical Cyclone Warning Centres, are all designated by WMO and function within WMO’s Tropical Cyclone Programme. Their role is to detect, monitor, track and forecast all tropical cyclones in their respective regions. The Centres provide, real-time advisory information and guidance to the National Meteorological and Hydrological Services.
_
Forecasters say they are less skilful at predicting the intensity of tropical cyclones than cyclone track. Available computing power limits forecasters’ ability to accurately model a large number of complex factors, such as exact topology and atmospheric conditions, though with increased experience and understanding, even models with the same resolution can be tuned to more accurately reflect real-world behaviour. Another weakness is lack of frequent wind speed measurements in the eye of the storm. The Cyclone Global Navigation Satellite System, launched by NASA in 2016, is expected to provide much more data compared to sporadic measurements by weather buoys and hurricane-penetrating aircraft.
An accurate track forecast is essential to creating accurate intensity forecasts, particularly in an area with large islands such as the western north Pacific and the Caribbean Sea, as proximity to land is an inhibiting factor to developing tropical cyclones. A strong hurricane/typhoon/cyclone can weaken if an outer eye wall forms (typically around 80–160 kilometres (50–99 mi) from the centre of the storm), choking off the convection within the inner eye wall. Such weakening is called an eyewall replacement cycle, and is usually temporary.
Tropical cyclones may be difficult to forecast, as they can suddenly weaken or change their course. However, meteorologists use state-of-the-art technologies and develop modern techniques to forecast how a tropical cyclone evolves.
_
Tropical cyclone warnings and watches are alerts issued by national weather forecasting bodies to coastal areas threatened by the imminent approach of a tropical cyclone of tropical storm or hurricane intensity. They are notices to the local population and civil authorities to make appropriate preparation for the cyclone, including evacuation of vulnerable areas where necessary. A warning may be amended whenever a significant change is made to the forecast track, intensity, and/or tropical cyclone best track position before the next regular warning is issued, or it may be corrected due to administrative or typographical errors.
For a warning to be issued, a storm system must meet one or more of the following criteria:
- It must have a closed circulation and maximum sustained winds of 25 kn (45 km/h; 30 mph) in the North Pacific or 35 kn (65 km/h; 40 mph) in the South Pacific and Indian Oceans.
- Its maximum sustained winds within the close circulation are expected to increase to 35 kn (65 km/h; 40 mph) or greater within 48 hours.
- It may endanger life and/or property within 72 hours.
_______
_______
Mountains matter for weather forecasts:
About one third of the Earth’s land surface is made up of mountains, hills, and other elevated terrain. Mountains have a big impact on local weather, regional weather patterns, and airflow in the lower and upper atmosphere.
When moist air encounters a mountain, it’s forced upward. As it rises, it cools and condenses, forming clouds and precipitation. This is known as orographic lift, and is why the windward side of a mountain range gets more rainfall. Mountains can block or redirect storm systems, and have the power to enhance thunderstorms by forcing warm, moist air to rise much quicker than it would over flatter ground. They can also create a rain shadow effect. After air rises and loses moisture, it then descends on the leeward side (opposite side) of the mountain where it warms up and dries out.
Deep temperature inversions are created by mountains, as cool air can get trapped under a layer of warm air in the valleys between peaks, and can persist for several days. Temperature inversions prevent the mixing of air and can lead to fog, frost, and air pollution build-up. Mountain passes can also funnel and accelerate winds, leading to strong gusts, and areas rapidly warming or cooling.
Mountains alter large-scale air flow and condition climate patterns that lead to droughts and storms. Let’s think about some of the most iconic mountain regions of the world. The Himalayas block cold air from Siberia, keeping South Asia warmer in winter. The Indian Monsoon is also shaped by the Himalayas, which trap moist air from the Indian Ocean, leading to heavy seasonal rains.
The Rocky Mountains influence the jet stream, sometimes causing weather extremes in North America. The Andes, Sierra Nevada, and Cascades contribute to the deserts of Atacama, Nevada, and eastern Oregon by blocking moist air or via the rain shadow effect.
Mountain ranges influence how air masses interact with oceans too, affecting currents like the Gulf Stream and El Niño-Southern Oscillation. Large mountain glaciers reflect sunlight, in turn regulating regional and even global temperatures, but melting glaciers due to climate change could disrupt this.
_
Field Forecasting:
As becomes increasingly obvious from field application of weather forecasts, forecast updating or “field forecasting” is an integral and important part of weather forecasting and snow safety. Field forecasting is defined as the process of using our knowledge and awareness of weather and its interaction with local terrain to ascertain an updated mountain weather forecast. This ability to effectively generate such a forecast greatly enhances our safe travel in mountainous terrain.
As shown in Figure below, the field forecasting process involves several steps:
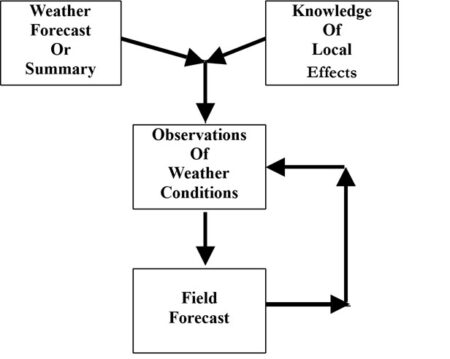
Components of a Field Weather Forecast:
(1) Being aware of the broad scale weather patterns (the current general forecast and the flow at upper levels);
(2) Applying knowledge of local effects to the expected wind, temperature and moisture fields;
(3) Observing the weather conditions;
(4) Preparing a field forecast consistent with the (changing) observations;
(5) Continually updating the forecast through an iterative process of further observations and subsequent forecast refinements;
(6) Using this feedback to arrive at a working knowledge of not only the current weather and snowpack, but how these should evolve in the immediate future.
When we try to apply our mental picture of the atmosphere and the observations that comprise it to reality in the mountains—the field forecast—we’ll want to remember key points:
Weather observations are influenced by local terrain to varying degrees. This means that a good knowledge of local effects is necessary to correctly interpret and apply our observations. And no matter how reliable or good the forecast that we start with is, we’ll have to remember to constantly update our assessment of the weather and come up with our own local forecast update. That is, if we’re good local weather forecasters and correctly interpret the effects of local weather on the snow pack, we will not be surprised by local avalanches.
This feedback process is best accomplished through observations and compilation of updated information that helps to keep our view of the weather and snowpack current.
_
It should be noted that in this discussion of field forecasting, both the general orientation of the mountain range to the upper level flow and the specifics of the underlying topography in question (passes, ridges, large topographic barriers, etc) have major effects on the time-wise changes of wind, precipitation and temperature fields with any given storm. For instance, the evolution of wind direction (both at higher elevations ridgelines and near lower passes) with a given storm will be considerably different for an east-west oriented mountain range than if the same storm impacted a north-south running range.
______
______
Fog forecasting:
Fog is a low-lying cloud made of tiny water droplets or ice crystals suspended in the air near the ground. It reduces horizontal visibility to less than 1,000 meters (3,281 feet). Fog arises when water vapour condenses into minute liquid droplets suspended in the air near the surface, markedly reducing visibility. Its formation depends on the interplay of thermodynamic, microphysical and dynamic processes within the lower atmosphere. Temperature drops or moisture increases can raise relative humidity to saturation, initiating nucleation on aerosol particles. Fog types—radiation, advection and sea fog—are distinguished by driving forces such as nocturnal radiative cooling or horizontal advection of warm moist air. Forecasting techniques range from high‐resolution numerical weather prediction models that resolve boundary‐layer turbulence and microphysics, to data‐driven and ensemble methods that integrate observations with machine learning. Accurate forecasting holds global significance for aviation, road safety and ecological monitoring, and informs water resource management and urban planning in fog‐prone regions.
_
Fog Levels:
Weather groups use visibility ranges to describe fog:
- Shallow Fog: Visibility is between 500 and 999 meters.
- Moderate Fog: Visibility is between 200 and 499 meters.
- Dense Fog: Visibility drops between 50 and 199 meters.
- Very Dense Fog: Visibility is under 50 meters
_
Fog is frequently blamed for traffic disasters and bad air quality in poor-visibility weather and has been extensively studied for more than a century (see the review by Gultepe et al. 2007). However, progress in the operational forecasting of fog at the National Centers for Environmental Prediction (NCEP) and other numerical weather prediction (NWP) centers has been slow due to the complexity of predicting fog and limited computing resources available for the task. For now, fog is still not a direct model guidance product produced by NWP centers but is diagnosed by local forecasters based either on statistical methods such as model output statistics (MOS; Koziara et al. 1983) and neural network (NN; Fabbian et al. 2007; Marzban et al. 2007) or on indirect model output variables (e.g., Baker et al. 2002). The major drawbacks to statistical forecasts are that the models used at NWP centers are frequently upgraded or changed while the statistical approach needs a long period of past forecast data for training and both the MOS and NN approaches are statistical but not flow dependent. The diagnosis of fog from other indirect model output variables strongly depends on the experience of the local forecaster and remains a challenging forecast problem. Thus, there have been growing efforts to numerically predict fog over the last decade, either with local fog models over small areas (e.g., Bott and Trautmann 2002; Bergot et al. 2005) or with NWP models over large domains (e.g., Ballard et al. 1991; Teixeira 1999; Kong 2002; Pagowski et al. 2004; Koracin et al. 2005; Muller 2005; Gao et al. 2007; Toth and Burrows 2008). A study done by Roquelaure and Bergot (2008) has shown some promising results in predicting fog using a one-dimensional local ensemble model (not a full NWP model) for the Charles de Gaulle International Airport in Paris, France.
_
Most of these fog forecasting efforts were deterministic in nature and did not consider forecast uncertainty. Due to the chaotic and highly nonlinear nature of the atmospheric system, initially small differences in either initial conditions (ICs) or the model itself can amplify over time and become large after a certain time period (Lorenz 1965). Since an intrinsic uncertainty always exists in both the ICs and model physics, a forecast predicted by a single model run always has uncertainty. Such forecast uncertainty varies from time to time, from location to location, and from case to case. A dynamical way to quantify such flow-dependent forecast uncertainty is with ensemble forecasting (Leith 1974; Du 2007). Instead of one single integration, multiple model integrations are made, initiated with either multiple slightly different ICs and/or based on different model configurations in an ensemble prediction system. Given the intrinsic uncertainty of the model forecasts and the fact that fog forecasting is believed to be extremely sensitive to the initial conditions and the physics schemes used in a prediction system (Bergot and Guedalia 1994; Gayno 1994; Bergot et al. 2005), it is highly desirable to have fog prediction be part of an ensemble framework. Fog forecasting by ensemble uses multiple weather simulation runs to predict low-visibility events with higher accuracy than a single deterministic model. Various studies showed that the ensemble-based method can significantly improve the fog forecasting when compared with deterministic style. Low visibility conditions due to fog affect air traffic and, in some cases, are the leading cause of aviation accidents. Accurate forecasting of fog can lead to a significant reduction of human and financial losses.
______
______
FAQ:
How accurate are weather forecasts?
Short-term forecasts (1–3 days) are highly accurate, often above 85%, while forecasts beyond 7 days become less reliable due to atmospheric complexities.
How do meteorologists predict storms?
They combine surface and upper-air observations, satellite and radar imagery, and numerical models to anticipate storm formation, location, and severity.
Why are some weather apps different from the TV forecast?
Different sources may use different forecast models or prioritize them differently. The TV meteorologist interprets multiple models and local data, while an app might automate a single model’s output, leading to discrepancies, especially for complex or long‑range forecasts.
What’s the hardest weather phenomenon to predict?
Precipitation type and amount in marginal temperature zones (e.g., rain vs. sleet vs. snow) and the precise initiation/location of summertime convective thunderstorms remain significant forecasting challenges due to their small scale and sensitivity to tiny atmospheric changes.
What does probability of precipitation (PoP) really mean?
The “Probability of Precipitation” (PoP) simply describes the probability that the forecast grid/point in question will receive at least 0.01inch (0.25mm) of rain. A 40% PoP means you have a 40 out of 100 chances of seeing rain at your specific location during the given time window. It does not mean it will rain 40% of the time or cover 40% of the area.
Do meteorologists just read a model?
Absolutely not. They are trained scientists who analyze, interpret, and correct model guidance using physics, local knowledge, and real‑time observations. The model is a vital tool, but the forecast is the product of human synthesis and judgment.
How do satellites help in weather prediction?
Satellites provide global imagery of cloud cover, storm systems, and temperature variations, enabling meteorologists to track weather even in remote areas.
What is the difference between a weather watch and a weather warning?
A weather watch means that conditions are favorable for a specific type of severe weather to develop in a particular area. It encourages people to be prepared and stay informed. A weather warning means that severe weather is imminent or is already occurring. Warnings require immediate action to protect life and property.
What is the role of the jet stream in weather patterns?
The jet stream is a high-altitude, fast-flowing wind current that circles the globe. It plays a significant role in steering weather systems across continents. Changes in the jet stream’s position and strength can influence the development and movement of storms, as well as temperature patterns.
How does El Niño and La Niña affect global weather?
El Niño and La Niña are climate patterns in the tropical Pacific Ocean that can influence weather conditions around the world. El Niño is characterized by warmer-than-average sea surface temperatures in the central and eastern Pacific, while La Niña is characterized by cooler-than-average temperatures. These patterns can affect rainfall, temperature, and storm tracks in various regions.
What causes thunderstorms?
Thunderstorms are caused by unstable atmospheric conditions that allow warm, moist air to rise rapidly. As the air rises, it cools and condenses, forming cumulonimbus clouds. These clouds can produce heavy rain, lightning, thunder, and sometimes hail or tornadoes.
How is weather radar used to track storms?
Weather radar emits radio waves that are reflected by precipitation. By analyzing the strength and location of the reflected signals, meteorologists can determine the intensity and movement of storms. Doppler radar can also measure the speed and direction of wind within a storm, providing valuable information for detecting tornadoes and other severe weather phenomena.
Why are some areas more prone to tornadoes than others?
Certain areas, like the “Tornado Alley” in the central United States, are more prone to tornadoes due to a combination of factors, including the presence of warm, moist air from the Gulf of Mexico, cool, dry air from the Rocky Mountains, and strong wind shear (changes in wind speed and direction with height). These conditions create an unstable atmosphere that is conducive to the formation of supercell thunderstorms, which are the most common type of storm to produce tornadoes.
_______
_______
Section-8
Science of weather forecasting:
Atmospheric physics:
Atmospheric physics is a branch of science that investigates the physical processes and phenomena occurring in the Earth’s atmosphere. This field encompasses two main areas: physical meteorology, which focuses on observable atmospheric events such as cloud formation, precipitation, and severe weather; and atmospheric dynamics, which studies large-scale movements in the atmosphere, including jet streams and tropical storms. Central to this discipline is the understanding of air pressure, density, and the ways water vapor is transported and transformed within the atmosphere.
Atmospheric physics employs mathematical models and principles from fluid dynamics, thermodynamics, and radiation to analyze and predict atmospheric behavior. The study has gained significance in recent decades due to advancements in satellite technology, which enhance our ability to monitor weather patterns and climate changes. The atmosphere, primarily composed of nitrogen and oxygen, plays a critical role in regulating the Earth’s climate through complex interactions involving solar radiation, greenhouse gases, and aerosols.
As concerns about climate change intensify, atmospheric physics is crucial for understanding the impacts of human activity on weather, air quality, and the global climate system. This interdisciplinary science not only contributes to weather forecasting and aviation safety but also informs strategies for addressing environmental challenges and promoting sustainable practices.
_
Atmospheric physics focuses on the application of physics to the study of the atmosphere, including the modeling of Earth’s atmosphere and those of other planets using fluid dynamics, radiation balance, and energy transfer processes. It is closely linked to meteorology and climatology, providing the theoretical foundation for understanding weather systems, climate variability, and atmospheric phenomena.
Key Areas of Study:
- Thermodynamics and Dynamics: Examines temperature, pressure, wind, and moisture to understand atmospheric motion and energy transfer
- Radiative Transfer: Studies how solar and terrestrial radiation interact with gases, aerosols, and clouds, influencing Earth’s energy balance and climate
- Cloud Physics and Precipitation: Investigates cloud formation, droplet growth, and precipitation processes, essential for weather prediction
- Atmospheric Electricity: Explores phenomena like lightning, the global electric circuit, and plasma properties in the atmosphere
- Atmospheric Tides and Waves: Analyzes oscillations in wind, temperature, and pressure caused by solar heating, distinct from ocean tides
- Aeronomy: Focuses on the upper atmosphere, where dissociation and ionization are significant, including the study of planetary atmospheres
_
Atmospheric physicists use a variety of instruments and methods to study the atmosphere:
- Remote Sensing: Satellites, aircraft, and ground-based sensors collect data on atmospheric composition, temperature, and dynamics without direct contact
- Radiosondes and Weather Balloons: Measure vertical profiles of temperature, humidity, and pressure.
- Radar and Lidar Systems: Track precipitation, cloud structure, and aerosol distribution.
- Numerical Models: Simulate atmospheric processes using fluid flow equations, statistical mechanics, and wave propagation models to predict weather and climate
_
Applications:
Atmospheric physics underpins weather forecasting, climate modeling, and environmental monitoring. It helps improve:
- Short-term and seasonal weather predictions by analyzing temperature, moisture, and wind profiles
- Air quality and pollution studies through understanding the transport and chemical interactions of trace gases and aerosols
- Climate change research by modeling radiative forcing, greenhouse gas effects, and long-term atmospheric trends
- Planetary science by applying atmospheric physics principles to other planets and moons
_______
_______
Fundamental Concepts of Atmospheric Physics:
Atmospheric Composition and Structure:
The Earth’s atmosphere is composed mainly of nitrogen (78%) and oxygen (21%), along with trace gases such as carbon dioxide, water vapor, methane, and ozone. These trace gases play a vital role in absorbing and emitting radiation, influencing weather and climate patterns.
The atmosphere is divided into several layers based on temperature gradients:
- Troposphere: The lowest layer (0-12 km), where most weather phenomena occur, and temperature decreases with altitude.
- Stratosphere: The next layer (12-50 km), containing the ozone layer, where temperature increases with altitude due to absorption of ultraviolet radiation.
- Mesosphere: Above the stratosphere (50-85 km), where temperatures decrease again with altitude.
- Thermosphere: Extending from about 85 km to several hundred kilometers, where solar radiation heats the few molecules present to high temperatures.
_______
Thermodynamics of the Atmosphere:
Atmospheric thermodynamics is the study of heat-to-work transformations (and their reverse) that take place in the Earth’s atmosphere and manifest as weather or climate. Atmospheric thermodynamics use the laws of classical thermodynamics, to describe and explain such phenomena as the properties of moist air, the formation of clouds, atmospheric convection, boundary layer meteorology, and vertical instabilities in the atmosphere. Atmospheric thermodynamic diagrams are used as tools in the forecasting of storm development. Atmospheric thermodynamics forms a basis for cloud microphysics and convection parameterizations used in numerical weather models and is used in many climate considerations, including convective-equilibrium climate models.
_
The atmosphere is an example of a non-equilibrium system. Atmospheric thermodynamics describes the effect of buoyant forces that cause the rise of less dense (warmer) air, the descent of more dense air, and the transformation of water from liquid to vapor (evaporation) and its condensation. Those dynamics are modified by the force of the pressure gradient and that motion is modified by the Coriolis force. The tools used include the law of energy conservation, the ideal gas law, specific heat capacities, the assumption of isentropic processes (in which entropy is a constant), and moist adiabatic processes (during which no energy is transferred as heat). Most of tropospheric gases are treated as ideal gases and water vapor, with its ability to change phase from vapor, to liquid, to solid, and back is considered one of the most important trace components of air.
_
Advanced topics are phase transitions of water, homogeneous and in-homogeneous nucleation, effect of dissolved substances on cloud condensation, role of supersaturation on formation of ice crystals and cloud droplets. Considerations of moist air and cloud theories typically involve various temperatures, such as equivalent potential temperature, wet-bulb and virtual temperatures. Connected areas are energy, momentum, and mass transfer, turbulence interaction between air particles in clouds, convection, dynamics of tropical cyclones, and large scale dynamics of the atmosphere.
_
The major role of atmospheric thermodynamics is expressed in terms of adiabatic and diabatic forces acting on air parcels included in primitive equations of air motion either as grid resolved or sub-grid parameterizations. These equations form a basis for the numerical weather and climate predictions.
Thermodynamics in atmospheric physics governs the energy exchanges and transformations that occur between the Earth’s surface, atmosphere, and space. These processes are critical for understanding weather and climate phenomena. Key thermodynamic principles include:
- Adiabatic Processes: The rising and falling of air masses without heat exchange with the surroundings, leading to temperature changes. For example, when air rises and expands in the lower pressure of the upper atmosphere, it cools adiabatically.
- Lapse Rate: The rate of temperature change with altitude. The dry adiabatic lapse rate is around 9.8°C per kilometer, while the moist adiabatic lapse rate (in the presence of water vapor) is lower (about 5°C per 1,000 meters) due to latent heat release during condensation.
- Stability and Convection: The standard environmental lapse rate is the actual observed change in air temperature with altitude, whereas the adiabatic lapse rate is the theoretical rate at which a rising or sinking air parcel cools or warms without exchanging heat with its surroundings. Meteorologists compare the ELR to the adiabatic rates to determine if the air is stable, unstable, or neutral, which dictates cloud formation and weather. If the atmosphere is unstable, convection occurs, leading to rising and sinking air masses, which are key drivers of cloud formation and storms.
_______
Radiative Transfer and Atmospheric Radiation:
Radiative transfer is a fundamental process by which energy in the form of electromagnetic radiation is exchanged between the Earth’s surface, the atmosphere, and space. The radiative balance of the planet determines the Earth’s temperature and climate. Two key concepts in radiative transfer are:
- Solar Radiation (Shortwave Radiation): The sun emits radiation primarily in the visible spectrum, which is absorbed by the Earth’s surface, warming it.
- Terrestrial Radiation (Longwave Radiation): The Earth re-emits absorbed energy in the form of infrared radiation. Certain gases, known as greenhouse gases (e.g., CO₂, CH₄, H₂O), absorb this longwave radiation, trapping heat in the atmosphere and contributing to the greenhouse effect.
_______
Fluid Dynamics and Atmospheric Circulation:
The motions of the atmosphere are governed by the fundamental physical laws of conservation of mass, momentum, and energy. These forces can be classified as either body forces or surface forces. Body forces act on the center of mass of a fluid parcel; they have magnitudes proportional to the mass of the parcel. Gravity is an example of a body force. Surface forces act across the boundary surface separating a fluid parcel from its surroundings; their magnitudes are independent of the mass of the parcel. The pressure force is an example.
Newton’s second law of motion states that the rate of change of momentum (i.e., the acceleration) of an object, as measured relative to coordinates fixed in space, equals the sum of all the forces acting. For atmospheric motions of meteorological interest, the forces that are of primary concern are the pressure gradient force, the gravitational force, and friction. If, as is the usual case, the motion is referred of coordinate system rotating with the earth, Newton’s second law may still be applied provided that certain apparent forces, the centrifugal force and the Coriolis force, are included among the forces acting.
_
Basic Conservation Laws:
Atmospheric motions are governed by three fundamental physical principles: conservation of mass, conservation of momentum, and conservation of energy. The mathematical relations that express these laws may be derived by considering the budgets of mass, momentum, and energy for an infinitesimal control volume in the fluid. Two types of control volume are commonly used in fluid dynamics. In the Eulerian frame of reference, the control volume consists of a parallelepiped of sides δx, δy, δz, whose position is fixed relative to the coordinate axes. Mass, momentum, and energy budgets will depend on fluxes caused by the flow of fluid through the boundaries of the control volume. In the Lagrangian frame, however, the control volume consists of an infinitesimal mass of “tagged” fluid particles; thus, the control volume moves about following the motion of the fluid, always containing the same fluid particles. The Lagrangian frame is particularly useful for deriving conservation laws, as such laws may be stated most simply in terms of a particular mass element of the fluid. The Eulerian system is, however, more convenient for solving most problems because in that system the field variables are related by a set of partial differential equations in which the independent variables are the coordinates x, y, z, and t.
_
The atmosphere behaves like a fluid, and its dynamics are governed by the principles of fluid mechanics. Key equations in atmospheric fluid dynamics include:
- Navier-Stokes Equations: These govern the motion of fluid substances, including air in the atmosphere, considering forces like pressure gradients, gravity, and Coriolis forces.
- Coriolis Effect: Due to the Earth’s rotation, moving air is deflected to the right in the Northern Hemisphere and to the left in the Southern Hemisphere. This effect is crucial for the formation of trade winds, westerlies, and cyclones.
- General Circulation of the Atmosphere: Large-scale wind patterns, such as the Hadley cell, Ferrel cell, and polar cell, transport heat and moisture around the globe, playing a significant role in climate dynamics.
_
Key Forces Driving Wind and Weather:
- Pressure Gradient Force: Drives air to move horizontally from high-pressure to low-pressure areas.
- Coriolis Force: An apparent force caused by Earth’s rotation that deflects winds to the right in the Northern Hemisphere and to the left in the Southern Hemisphere.
- Friction: Slows down surface winds within 1 to 3 kilometers of the ground.
_
The equations at the heart of a dynamical model are designed to digitally mimic the natural processes at work in the atmosphere all around the globe. For example, Newton’s second law forms an important backbone to the equations of atmospheric motion. It’s usually written as
F = ma, and stated as “Force equals mass times acceleration”.
To apply Newton’s second law to weather forecasting, however, we use the form:
A = F/m.
In plain language, the acceleration of air is equal to the forces acting on it divided by air’s mass. This form of Newton’s second law makes weather modelling possible! The forces include pressure gradients, gravity, and Coriolis forces owing to the Earth’s rotation, and friction.
Utilizing this type of equation is achieved by using a grid containing millions of data points positioned at regular intervals in a virtual, computer-based world. The most complex models replicate atmospheric processes such as rainfall, the underlying land and ocean surfaces, as well as the various forms of incoming and outgoing energy (i.e. sunlight, amongst others).
_
Weather Systems and Pressure Centers:
- Cyclones (Low Pressure): Characterized by inward converging air that spins anticlockwise in the Northern Hemisphere and clockwise in the Southern Hemisphere, often bringing clouds and rain.
- Anticyclones (High Pressure): Characterized by sinking, diverging air that usually brings fair, clear, and stable weather.
_______
Cloud Microphysics and Precipitation Processes:
Cloud Formation:
Clouds form when moist air cools to its dew point, causing water vapor to condense into liquid droplets or ice crystals. Cloud microphysics focuses on the processes that govern the growth, evaporation, and precipitation of cloud particles. Important factors include:
- Nucleation: Cloud droplets form on tiny particles called cloud condensation nuclei (CCN), which can be dust, sea salt, or pollution particles.
- Supersaturation: The air must become supersaturated with respect to water for condensation to occur.
This typically happens when rising air cools due to expansion.
_
Precipitation Mechanisms:
Precipitation occurs when cloud droplets or ice crystals grow large enough to overcome the updrafts in the cloud and fall to the ground. Two key processes in precipitation formation are:
- Collision and Coalescence: In warm clouds, larger droplets collide with smaller ones and merge to form raindrops.
- Bergeron-Findeisen Process: In cold clouds, ice crystals grow at the expense of surrounding supercooled water droplets, leading to the formation of snow or ice pellets.
_______
_______
Mathematical models:
Since the mid-1950’s, weather forecasters have used mathematical models of the atmosphere, processed by computers, to improve the accuracy of their predictions. A mathematical model of the atmosphere consists of a set of equations intended to approximate the atmospheric processes that drive the development and movement of weather systems. Mathematical models are based on scientific laws, and through the years scientists have developed increasingly sophisticated models. Improvements in computer technology have greatly enhanced meteorologists’ ability to use mathematical models effectively because computers can process enormous amounts of observation data and perform a multitude of calculations extremely rapidly.
_
A mathematical model begins with the current state of the atmosphere, as determined by the most recent weather observations. The model uses these data to predict the state of the atmosphere for a specific time interval — for example, the next 10 minutes. Using this predicted state as a new starting point, the model then forecasts the state of the atmosphere for another 10-minute period. This process repeats over and over again until the model produces short-range weather forecasts for the next 12, 24, 36, and 48 hours.
_
The accuracy of weather forecasts generated by mathematical models declines steadily over time for two main reasons. First, the weather observation data initially fed into the model can never provide a complete picture of the present state of the atmosphere. Not all the data are reliable, due to both technical and human error, and data are missing from vast stretches of the atmosphere over the oceans. Second, mathematical models of the atmosphere are only approximations of the way the atmosphere actually works, and errors in the models tend to grow with each repetition.
Meteorologists understand the limitations of mathematical models. They base their forecasts on observations of how the weather has changed over the past several days and on their understanding of atmospheric processes. Experience and even intuition play important roles, along with the cautious interpretation of the output of mathematical models.
Meteorologists also use mathematical models to produce long-range weather forecasts, such as 6- to 10-day forecasts and monthly (30-day) and seasonal (90-day) outlooks. Long-range forecasts and outlooks typically are less accurate than short-range forecasts, but they can provide an indication of general trends, such as whether conditions will be wetter or drier than normal.
_
Numerical weather prediction is the science of forecasting weather using computer simulations built from mathematical models. In this process, the atmosphere is divided into a three-dimensional lattice of grid points, and at each point the various atmospheric variables of interest are represented. These values are initialized with a state determined through analysis of past and present conditions. This state is then evolved forward into the future by solving, at each grid point, the classical laws of fluid mechanics and thermodynamics, which are known to accurately approximate the behavior of the atmosphere. The output from the model provides the basis of the weather forecast.
The equations that govern how the state of a fluid changes with time contain many variables and require a great deal of computer processing resources to solve. Weather prediction centers have access to supercomputers containing thousands of processors on which to run a forecasting model. The required calculations are shared among the processors and computed simultaneously to produce a complete forecast in a fraction of the time possible with a single computer. This system is essential to ensure that an accurate prediction can be made within a useful time frame.
_
The raw output from the simulation is often modified before being presented as a forecast. Modifications include either the use of statistical techniques to remove known biases in the model or adjustments to take into account consensus among other numerical weather predictions. Accurate forecasts of precipitation for a specific location are particularly challenging because of the chance that the rainfall may fall in a slightly different place—such as several kilometers away—or at a slightly different time than the model forecasts, even if the overall quantity of precipitation is correct. Therefore, daily forecasts give fairly precise temperatures but put probabilistic values on quantities such as rain, based on knowledge of the uncertainty factors in the forecast.
_
Numerical weather prediction (NWP) is a method of weather forecasting that employs a set of equations that describe the flow of fluids. These equations are translated into computer code and use governing equations, numerical methods, parameterizations of other physical processes and combined with initial and boundary conditions before being run over a domain (geographic area). Almost every step in NWP includes omissions, estimations, approximations and compromises.
Numerical Methods:
-Created because computers can perform arithmetic but not calculus
-Used to convert spatial and temporal derivative into equations that computers can solve
-Numerical methods directly affect model output, mostly at small scales
Governing Equations:
-Conservation of momentum (Newton’s laws)
-Conservation of mass
-Conservation of energy
-Ideal gas law
_______
_______
Atmospheric Physics Equations:
The realm of atmospheric physics grapples with understanding the physical processes that govern our atmosphere. At its heart lie the Atmospheric Physics Equations, a set of mathematical expressions that, in their simplest definition, describe the behavior of air and its constituents. For someone new to this field, it’s useful to think of these equations as the fundamental rules that dictate weather patterns and climate dynamics.
They are not arbitrary constructs, but rather a precise statement of the laws of physics as they apply to the atmosphere.
_
Imagine the atmosphere as a vast, complex fluid. To understand how this fluid moves, changes temperature, and forms clouds, we need a way to describe these changes quantitatively. This is where the Atmospheric Physics Equations come into play. They are a collection of equations, each focusing on a different aspect of atmospheric behavior. One crucial set of equations deals with fluid dynamics, describing air motion → winds, currents, and turbulence. Another set focuses on thermodynamics, addressing temperature changes, heat transfer, and the formation of precipitation. Radiative transfer equations, a third key group, detail how energy from the sun interacts with the atmosphere, influencing temperature and driving weather systems. In essence, Atmospheric Physics Equations are the mathematical language used to articulate the physical processes that shape our atmospheric environment.
_
To further clarify their meaning, consider a basic example: the equation of state for an ideal gas. While a simplification, it’s a cornerstone in atmospheric physics. This equation, often represented as PV=nRT, establishes a relationship between pressure (P), volume (V), temperature (T), and the amount of gas (n).
In the atmospheric context, this specification allows us to understand how changes in pressure, for instance, are linked to temperature variations in the air. This seemingly simple relationship has profound implications for understanding atmospheric stability and the development of weather phenomena.
_
The description of these equations at a fundamental level often involves analogies to everyday experiences. Think about a pot of boiling water. The steam rising, the heat transferring → these are governed by physical laws similar to those described by Atmospheric Physics Equations, albeit in a much simpler setting.
The atmosphere, however, is vastly more complex, with numerous interacting processes occurring simultaneously. Therefore, the equations become more intricate, but the underlying principles remain rooted in basic physics.
_
Understanding the significance of these equations starts with recognizing their role in weather forecasting. Numerical weather prediction models, the tools meteorologists use daily, are built upon these equations. By solving them using powerful computers, these models simulate the future state of the atmosphere, providing forecasts of temperature, precipitation, and wind. The accuracy of these forecasts, while constantly improving, is directly tied to the completeness and correctness of the Atmospheric Physics Equations used in the models and our ability to solve them computationally.
_
Basic Categories of Atmospheric Physics Equations:
To provide a more structured delineation, Atmospheric Physics Equations can be broadly categorized:
-1. Thermodynamic Equations: These describe energy conservation and transformations within the atmosphere.
-First Law of Thermodynamics: Deals with the conservation of energy, relating changes in internal energy to heat added and work done.
-Clausius-Clapeyron Equation: Describes the relationship between vapor pressure and temperature, crucial for understanding cloud formation and precipitation.
-2. Fluid Dynamic Equations: These govern the motion of air.
-Navier-Stokes Equations: Describe the motion of viscous fluids, including air, under various forces.
-Continuity Equation: Expresses the conservation of mass in fluid flow.
-3. Radiative Transfer Equations: These detail the interaction of radiation with the atmosphere.
-Schwarzschild’s Equation: Describes the transfer of radiation through a medium, essential for understanding the Earth’s energy budget and climate.
-Beer-Lambert Law: Governs the attenuation of radiation as it passes through a medium, relevant to atmospheric absorption and scattering.
In summary, for a beginner, the Atmospheric Physics Equations represent the mathematical foundation for understanding atmospheric processes. They are not just abstract formulas but tools that provide a framework for interpretation of weather and climate phenomena, underpinning forecasting and climate modeling. Their import lies in their ability to transform qualitative observations of the atmosphere into quantitative predictions and insights.
______
Primitive Equations:
Primitive equations are simplified Atmospheric Physics Equations that can be handled by computers. Primitive equations are a set of nonlinear partial differential equations used to approximate large-scale global atmospheric flow and weather prediction. The derivatives in the primitive equations can be approximated by finite differences, such that the equations can be transformed into a linear equation system. It takes modern supercomputers at the leading weather services quite a while to solve all these equations.
_
For each weather forecast, meteorologists need to know the values of seven physical quantities: temperature, pressure, density, humidity, and wind velocity, containing three components accounting for the three different wind directions. Some forecasting models also include the content of water and ice in clouds and at the ground. Ideally, these values would be known at every point in the atmosphere at any time. This is virtually impossible due to limited computational power; therefore, the atmosphere is divided into many small air parcels, and the values are calculated for each parcel. Scientists treat the Earth’s atmosphere as if it were a fluid on a rotating sphere in order to describe large-scale atmospheric processes using the fundamental laws of thermodynamics and hydrodynamics, also called the primitive equations. Essentially, they are the equations of motion, one for each of the three wind directions, the continuity equation, describing the conservation of mass, the ideal gas law, and the first law of thermodynamics, describing the conservation of energy. There is also an equation for determining the humidity, which is not always included in the set of the primitive equations. Furthermore, the following forces have to be taken into account: gravitation, drag force, pressure gradient force, and, since the Earth is rotating, the Coriolis and the centrifugal forces.
_
The basic principle underlying the continuity equation is the conservation of mass. Fundamentally, matter can be neither created out of thin air nor can it be destroyed completely; but it can be rearranged. If you want to build a house, for example, you have to use material that has already existed in some form, but through the building process it becomes a house. And if you burn a tree trunk, the wood does not vanish completely as ashes will always remain. The situation is similar for the atmosphere; if the atmospheric pressure rises in one place, it has to decrease in some other place so as to guarantee the balance. This means that if you subtract the mass flowing out of an air parcel from the mass that flew in, you obtain the change of mass within the parcel. The continuity equation is used to determine the air density.
_
In order to determine the temperature in an air parcel, forecasters make use of the first law of thermodynamics. This law expresses the conservation of energy, or heat, as heat is a form of energy. In essence, energy cannot be created or destroyed (similar to mass), but it can change forms. For example, if you have a bonfire, you need to input energy in the form of wood, and energy is released in the form of heat and light. The first law of thermodynamics also states that the amount of energy added to a system cannot be bigger than the amount of energy released from the system, in other words, the amount of energy supplied is exactly balanced by the work done (within the system).
In terms of the atmosphere, the conservation of energy means that the temperature in an air parcel changes only when heat is added or removed. This can be caused by warmer or cooler air moving into the parcel, or by evaporation (which cools the air) or condensation (which releases heat). Furthermore, the temperature in a parcel can change if the parcel moves about vertically. This property is very important for the formation of clouds.
_
The primitive equations were first used in a weather forecast by Lewis Fry Richardson. Jule Charney and his colleagues had simplified them so that the early computers could handle them, but nowadays meteorologists have gone back to use all of Richardson’s equations.
All current weather forecasting models are based on the primitive equations — or versions thereof — but each model uses different approximations and assumptions, resulting in slightly different outcomes. Also, the models include equations accounting for the effects of small-scale processes such as convection, radiation, turbulence and the effects of mountains that cannot be represented explicitly by the forecasting models, as their resolution is not high enough. This process is called parameterisation.
Furthermore, before weather data gathered from various observations can be entered into the computer models, they have to be assimilated. During data assimilation, real observations are combined with predicted conditions so as to give the best possible estimate of the actual state of the atmosphere. This process is necessary, as inputting raw data obtained just from observations results in inaccurate forecasts.
Assuming that hydrostatic balance applies limits the smallest possible grid spacing to about 5 – 10 km, which is not fine enough a resolution for detailed, accurate forecasts of small-scale weather events like thunderstorms.
Some models, such as the regional model COSMO developed by the German weather service Deutscher Wetterdienst (DWD), have therefore abandoned this assumption and are based on non-hydrostatic thermodynamic equations (similar to the equations used in fluid mechanics). This permits a much finer resolution (i.e. smaller grid spacing), but as a result, the primitive equations are much more complex and computationally more demanding as vertical wind components are included in the model.
Moreover, in order to improve the model’s forecast accuracy and quality, the vertical coordinate z can be replaced by the generalised vertical coordinate ζ, allowing the orthogonal spherical coordinate system to be transformed into a terrain-following coordinate system, which is conformal to the Earth’s orography. Again, the primitive equations have to be re-written in terms of ζ. Not all forecasting models have such a coordinate system, though; there are several grid models.
_____
_____
Boundary conditions (external interactions) and initial conditions (initial state):
The boundary conditions define the interactions of the system with the environment during the entire process. The initial conditions define the initial state of the system that executes a process.
Initial and boundary conditions refer to the necessary specifications for flow simulations, where initial conditions provide starting values for variables and boundary conditions dictate the values or gradients at the domain’s edges, including Dirichlet, Neumann, and Cauchy types.
Initial and Boundary Conditions in weather forecasting:
- Initial conditions define the atmosphere’s current state…the starting point.
- Boundary conditions define the atmosphere’s state and the domains’ edges
Initial conditions and boundary conditions are the critical inputs required to run numerical weather prediction (NWP) models and simulate the future state of the atmosphere.
Initial Conditions (ICs):
- Definition: The exact state of the atmosphere (temperature, pressure, wind, and humidity) at the starting moment of the forecast.
- How they are found: Created using data assimilation, a process that combines sparse real-world observations (from satellites, radar, weather balloons, and surface stations) with a prior model forecast (background state).
- Role in forecasting: Acts as the launching point for the simulation. They are vital for short-range forecasts (nowcasting up to 3 days), where forecast accuracy depends heavily on knowing the precise starting values.
- Limitations: The atmosphere’s “memory” of initial conditions is chaotic and fades after about 10 days, meaning errors in initial data grow and ruin the forecast over time.
Boundary Conditions (BCs):
- Definition: The conditions and fluxes (heat, moisture, momentum) specified at the outer edges (lateral boundaries) or lower surface of a model domain.
- Types:
-Lateral Boundary Conditions (LBCs): Feed data into the sides of a regional limited-area model (LAM), usually supplied by a larger global forecast model.
-Surface Boundary Conditions: Control lower-boundary exchanges, such as sea surface temperatures (SSTs), soil moisture, snow cover, and vegetation.
- Role in forecasting: Dictates how weather systems enter and leave a specific regional grid. While initial conditions dominate the first few days, surface and lateral boundary conditions drive longer-term predictability (medium-range, seasonal, and climate scales).
In a nutshell:
Weather forecasting is fundamentally an initial-boundary value problem in mathematics, meaning it requires both an accurate snapshot of the current atmospheric state (initial conditions) and continuous data at the outer edges of the forecast region (boundary conditions) to solve the governing differential equations of fluid motion
______
______
Science of weather forecasting models:
Weather forecast models are computer programs that can help predict what the weather will be in the future, any time in the future from an hour to ten days out and even months ahead.
These forecast models take current weather observations collected from thousands of locations (such as wind speed, wind direction, air temperature, pressure, etc.), make an estimate about the current weather for locations where no actual data exists, and then use math and physics equations to predict what will happen in the future.
Below is an image from the “GFS” forecast model showing areas of high and low pressure as well as precipitation. We can use an image like this to know where storms may be at a point in the future.
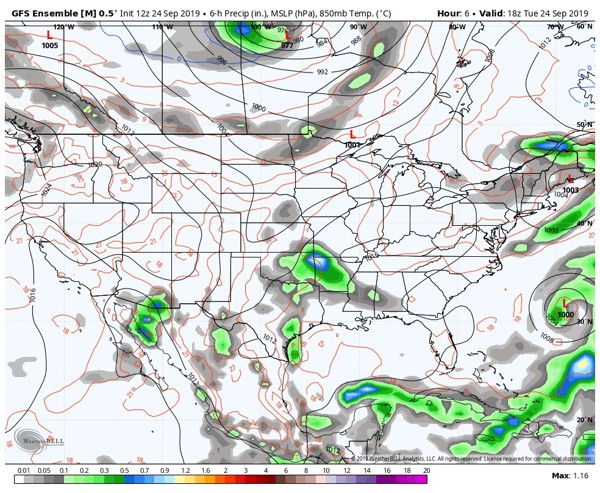
There are many forecast models that cover the globe or smaller regions, and each model is developed with its own formulas in an attempt to be the most accurate.
_
In atmospheric science, an atmospheric model is a mathematical model constructed around the full set of primitive, dynamical equations which govern atmospheric motions. It can supplement these equations with parameterizations for turbulent diffusion, radiation, moist processes (clouds and precipitation), heat exchange, soil, vegetation, surface water, the kinematic effects of terrain, and convection. Most atmospheric models are numerical, i.e. they discretize equations of motion. They can predict microscale phenomena such as tornadoes and boundary layer eddies, sub-microscale turbulent flow over buildings, as well as synoptic and global flows. The horizontal domain of a model is either global, covering the entire Earth (or other planetary body), or regional (limited-area), covering only part of the Earth. Atmospheric models also differ in how they compute vertical fluid motions; some types of models are thermotropic, barotropic, hydrostatic, and non-hydrostatic. These model types are differentiated by their assumptions about the atmosphere, which must balance computational speed with the model’s fidelity to the atmosphere it is simulating.
_
Forecasts are computed using mathematical equations for the physics and dynamics of the atmosphere. These equations are nonlinear and are impossible to solve exactly. Therefore, numerical methods obtain approximate solutions. Different models use different solution methods. Global models often use spectral methods for the horizontal dimensions and finite-difference methods for the vertical dimension, while regional models usually use finite-difference methods in all three dimensions. For specific locations, model output statistics use climate information, output from numerical weather prediction, and current surface weather observations to develop statistical relationships which account for model bias and resolution issues.
______
Atmospheric models differ in how they treat vertical fluid motion:
Barotropic Models
- Assumption: Density depends only on pressure.
- Vertical Motion: Wind direction does not change with height. Vertical motion is heavily simplified or assumed negligible because temperature gradients and baroclinic effects are ignored.
Thermotropic Models
- Assumption: Mean temperature dictates the atmospheric layer thickness.
- Vertical Motion: Wind direction remains constant with height. Vertical velocity is derived from simplified thickness patterns rather than full 3D thermodynamic equations.
Hydrostatic Models
- Assumption: Gravity and the vertical pressure gradient force are in exact balance. Vertical acceleration is ignored.
- Vertical Motion: Vertical wind speed is diagnosed indirectly using horizontal wind data and mass conservation (continuity equations) rather than a direct vertical force equation. Best for large-scale global weather patterns.
Non-Hydrostatic Models
- Assumption: Vertical forces do not always balance out. It uses the full vertical momentum equation.
- Vertical Motion: Explicitly calculates vertical acceleration. Essential for capturing rapid, small-scale upward air currents like thunderstorms, clouds, and strong convection
_
Thermotropic:
The main assumption made by the thermotropic model is that while the magnitude of the thermal wind may change, its direction does not change with respect to height, and thus the baroclinicity in the atmosphere can be simulated using the 500 mb (15 inHg) and 1,000 mb (30 inHg) geopotential height surfaces and the average thermal wind between them.
Barotropic:
Barotropic models assume the atmosphere is nearly barotropic, which means that the direction and speed of the geostrophic wind are independent of height. In other words, no vertical wind shear of the geostrophic wind. It also implies that thickness contours (a proxy for temperature) are parallel to upper level height contours. In this type of atmosphere, high and low pressure areas are centers of warm and cold temperature anomalies. Warm-core highs (such as the subtropical ridge and Bermuda-Azores high) and cold-core lows have strengthening winds with height, with the reverse true for cold-core highs (shallow arctic highs) and warm-core lows (such as tropical cyclones). A barotropic model tries to solve a simplified form of atmospheric dynamics based on the assumption that the atmosphere is in geostrophic balance; that is, that the Rossby number of the air in the atmosphere is small. If the assumption is made that the atmosphere is divergence-free, the curl of the Euler equations reduces into the barotropic vorticity equation. This latter equation can be solved over a single layer of the atmosphere. Since the atmosphere at a height of approximately 5.5 kilometres (3.4 mi) is mostly divergence-free, the barotropic model best approximates the state of the atmosphere at a geopotential height corresponding to that altitude, which corresponds to the atmosphere’s 500 mb (15 inHg) pressure surface.
Note: The Rossby number is a dimensionless value in fluid dynamics that measures the ratio of inertial (or advective acceleration) forces to Coriolis forces in a rotating system. Euler’s equations in atmospheric physics are fundamental fluid motion equations that describe the conservation of momentum for an inviscid (frictionless) gas or fluid influenced by pressure gradients and gravity.
Hydrostatic:
Hydrostatic models filter out vertically moving acoustic waves from the vertical momentum equation, which significantly increases the time step used within the model’s run. This is known as the hydrostatic approximation. Hydrostatic models use either pressure or sigma-pressure vertical coordinates. Pressure coordinates intersect topography while sigma coordinates follow the contour of the land. Its hydrostatic assumption is reasonable as long as horizontal grid resolution is not small, which is a scale where the hydrostatic assumption fails.
Nonhydrostatic:
Models which use the entire vertical momentum equation are known as nonhydrostatic. A nonhydrostatic model can be solved anelastically, meaning it solves the complete continuity equation for air assuming it is incompressible, or elastically, meaning it solves the complete continuity equation for air and is fully compressible. Nonhydrostatic models use altitude or sigma altitude for their vertical coordinates. Altitude coordinates can intersect land while sigma-altitude coordinates follow the contours of the land.
______
Initialization:
The atmosphere is a fluid. As such, the idea of numerical weather prediction is to sample the state of the fluid at a given time and use the equations of fluid dynamics and thermodynamics to estimate the state of the fluid at some time in the future. The process of entering observation data into the model to generate initial conditions is called initialization. On land, terrain maps available at resolutions down to 1 kilometer (0.6 mi) globally are used to help model atmospheric circulations within regions of rugged topography, in order to better depict features such as downslope winds, mountain waves and related cloudiness that affects incoming solar radiation. One main source of input is observations from devices (called radiosondes) in weather balloons which rise through the troposphere and well into the stratosphere that measure various atmospheric parameters and transmits them to a fixed receiver. Another main input is data from weather satellites. The World Meteorological Organization acts to standardize the instrumentation, observing practices and timing of these observations worldwide. Stations either report hourly in METAR reports, or every six hours in SYNOP reports. These observations are irregularly spaced, so they are processed by data assimilation and objective analysis methods, which perform quality control and obtain values at locations usable by the model’s mathematical algorithms. The data are then used in the model as the starting point for a forecast.
_
Commercial aircraft provide pilot reports along travel routes and ship reports along shipping routes. Commercial aircraft also submit automatic reports via the WMO’s Aircraft Meteorological Data Relay (AMDAR) system, using VHF radio to ground stations or satellites. Research projects use reconnaissance aircraft to fly in and around weather systems of interest, such as tropical cyclones. Reconnaissance aircraft are also flown over the open oceans during the cold season into systems which cause significant uncertainty in forecast guidance, or are expected to be of high impact from three to seven days into the future over the downstream continent. Sea ice began to be initialized in forecast models in 1971. Efforts to involve sea surface temperature in model initialization began in 1972 due to its role in modulating weather in higher latitudes of the Pacific.
_______
Computation:
A model is a computer program that produces meteorological information for future times at given locations and altitudes. Within any model is a set of equations, known as the primitive equations, used to predict the future state of the atmosphere. These equations are initialized from the analysis data and rates of change are determined. These rates of change predict the state of the atmosphere a short time into the future, with each time increment known as a time step. The equations are then applied to this new atmospheric state to find new rates of change, and these new rates of change predict the atmosphere at a yet further time into the future. Time stepping is repeated until the solution reaches the desired forecast time. The length of the time step chosen within the model is related to the distance between the points on the computational grid, and is chosen to maintain numerical stability. Time steps for global models are on the order of tens of minutes, while time steps for regional models are between one and four minutes. The global models are run at varying times into the future. The UKMET Unified model is run six days into the future, the European Centre for Medium-Range Weather Forecasts model is run out to 10 days into the future, while the Global Forecast System model run by the Environmental Modeling Center is run 16 days into the future.
_
The equations used are nonlinear partial differential equations which are impossible to solve exactly through analytical methods, with the exception of a few idealized cases. Therefore, numerical methods obtain approximate solutions. Different models use different solution methods: some global models use spectral methods for the horizontal dimensions and finite difference methods for the vertical dimension, while regional models and other global models usually use finite-difference methods in all three dimensions. The visual output produced by a model solution is known as a prognostic chart, or prog.
_______
Parameterization:
Some meteorological processes are too small-scale or too complex to be explicitly included in numerical weather prediction models. Parameterization is a procedure for representing these processes by relating them to variables on the scales that the model resolves. For example, the grid boxes in weather and climate models have sides that are between 5 kilometers (3 mi) and 300 kilometers (200 mi) in length. A typical cumulus cloud has a scale of less than 1 kilometer (0.6 mi), and would require a grid even finer than this to be represented physically by the equations of fluid motion. Therefore, the processes that such clouds represent are parameterized, by processes of various sophistication. In the earliest models, if a column of air within a model grid box was conditionally unstable (essentially, the bottom was warmer and moister than the top) and the water vapor content at any point within the column became saturated then it would be overturned (the warm, moist air would begin rising), and the air in that vertical column mixed. More sophisticated schemes recognize that only some portions of the box might convect and that entrainment and other processes occur. Weather models that have grid boxes with sizes between 5 and 25 kilometers (3 and 16 mi) can explicitly represent convective clouds, although they need to parameterize cloud microphysics which occur at a smaller scale. The formation of large-scale (stratus-type) clouds is more physically based; they form when the relative humidity reaches some prescribed value. The cloud fraction can be related to this critical value of relative humidity.
_
The amount of solar radiation reaching the ground, as well as the formation of cloud droplets occur on the molecular scale, and so they must be parameterized before they can be included in the model. Atmospheric drag produced by mountains must also be parameterized, as the limitations in the resolution of elevation contours produce significant underestimates of the drag. This method of parameterization is also done for the surface flux of energy between the ocean and the atmosphere, in order to determine realistic sea surface temperatures and type of sea ice found near the ocean’s surface. Sun angle as well as the impact of multiple cloud layers is taken into account. Soil type, vegetation type, and soil moisture all determine how much radiation goes into warming and how much moisture is drawn up into the adjacent atmosphere, and thus it is important to parameterize their contribution to these processes. Within air quality models, parameterizations take into account atmospheric emissions from multiple relatively tiny sources (e.g. roads, fields, factories) within specific grid boxes.
_
Parametrization in weather forecasting is the method of replacing complex, small-scale physical processes that cannot be directly calculated by a computer model with simplified mathematical approximations.
Why Parametrization is Needed:
- Grid Limitations: Weather models divide the atmosphere into a 3D grid boxes (often 5 to 50 kilometers wide).
- Sub-grid Processes: Phenomena smaller than a single grid box—such as individual clouds, turbulence, or raindrops—cannot be explicitly resolved.
- Computational Limits: Calculating the exact physics for every single molecule or microscopic droplet requires more computing power than any supercomputer possesses. Parametrization estimates the net effect of these small events using the large-scale values of the grid box.
Each important physical process that cannot be directly predicted requires a parameterization scheme based on reasonable physical or statistical representations.
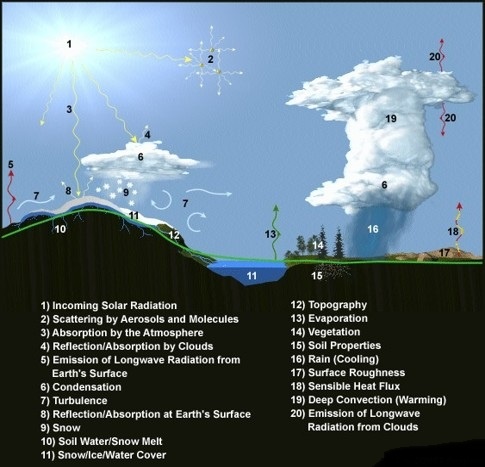
The graphic above depicts some of the physical processes and parameters that are typically parameterized, both because they cannot be explicitly predicted in full detail in model forecast equations used to approximate the bulk effects of physical processes too small, brief, complex or poorly understood to be explicitly represented by the governing equations and/or numerical methods.
_______
Domains:
The horizontal domain of a model is either global, covering the entire Earth, or regional, covering only part of the Earth. Regional models (also known as limited-area models, or LAMs) allow for the use of finer grid spacing than global models because the available computational resources are focused on a specific area instead of being spread over the globe. This allows regional models to resolve explicitly smaller-scale meteorological phenomena that cannot be represented on the coarser grid of a global model. Regional models use a global model to specify conditions at the edge of their domain (boundary conditions) in order to allow systems from outside the regional model domain to move into its area. Uncertainty and errors within regional models are introduced by the global model used for the boundary conditions of the edge of the regional model, as well as errors attributable to the regional model itself.
_
A plot of model domain size versus model grid size with several different types of numerical models arranged diagonally in figure below.
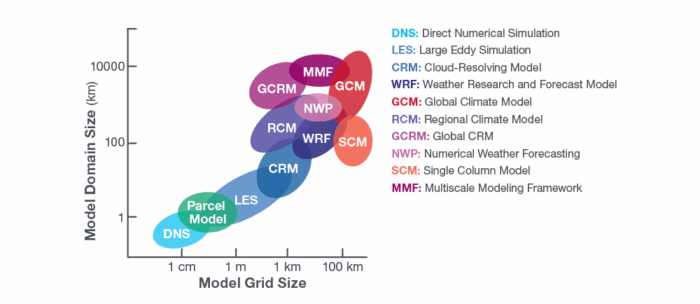
Figure above shows comparison of different types of atmospheric models by spatial domain and model grid size.
_
The vertical coordinate is handled in various ways. Lewis Fry Richardson’s 1922 model used geometric height (z) as the vertical coordinate. Later models substituted the geometric z coordinate with a pressure coordinate system, in which the geopotential heights of constant-pressure surfaces become dependent variables, greatly simplifying the primitive equations. This correlation between coordinate systems can be made since pressure decreases with height through the Earth’s atmosphere.
Meteorology uses pressure as the vertical coordinate and not height. This works out better for thermodynamic computations that are done on a regular basis. Pressure decreases in the atmosphere exponentially as height increases reaching zero pressure in space. The standard unit of pressure is millibars (mb or hectopascals-hPa) of which sea level is around 1013 mb.
Standard pressure levels and approximate heights:
|
Pressure |
Approximate Height |
Approximate Temp |
||
|
Sea level |
0 m |
0 ft |
15oC |
59oF |
|
1000 mb |
100 m |
300 ft |
15oC |
59oF |
|
850 mb |
1,500 m |
5,000 ft |
5oC |
41oF |
|
700 mb |
3,000 m |
10,000 ft |
-5oC |
23oF |
|
500 mb |
5,000 m |
18,000 ft |
-20oC |
-4oF |
|
300 mb |
9,000 m |
30,000 ft |
-45oC |
-49oF |
|
200 mb |
12,000 m |
40,000 ft |
-55oC |
-67oF |
|
100 mb |
16,000 m |
53,000 ft |
-56oC |
-69oF |
The first model used for operational forecasts, the single-layer barotropic model, used a single pressure coordinate at the 500-millibar (about 5,500 m (18,000 ft)) level, and thus was essentially two-dimensional. High-resolution models—also called mesoscale models—such as the Weather Research and Forecasting model tend to use normalized pressure coordinates referred to as sigma coordinates. This coordinate system receives its name from the independent variable σ used to scale atmospheric pressures with respect to the pressure at the surface, and in some cases also with the pressure at the top of the domain.
______
Cloud computing:
Most of that improvement has been down to more powerful computers. Weather forecasts work by carving the world into a grid of three-dimensional boxes. Each is populated with temperature, air pressure, wind speed and the like, and the system’s evolution simulated by grinding through enormous numbers of calculations.
Better computers allow finer models. In the same way that a high-resolution digital photo looks more realistic than a coarse-grained one, using a smaller grid helps match a model more closely to the real world. The ECMWF’s highest-resolution global model, for instance, chops the globe into boxes that are 9 km square, down from 16 km in 2016, and splits the atmosphere vertically into more than 100 layers.
Smaller grids also allow models to recreate more of what happens in the real weather. Deep convective clouds, for instance, are formed as hot air floats upwards. They can produce heavy rain, hail and even tornadoes, but typically cannot be resolved with grids bigger than about 5 km. Models have instead represented them using stopgap code that acts as a simplified substitution.
But smaller grids come at a high price. Halving the horizontal size of a grid means that four times as many boxes—and four times as many calculations—are needed to cover a given area. One option is to trade resolution for locality. The sharpest offering from the National Oceanic and Atmospheric Administration, in America, for instance, uses grid boxes 3 km square, but covers only North America. Computing, meanwhile, continues to improve. The world’s fastest computer is Frontier, installed at Oak Ridge National Laboratory in Tennessee. Using it, ECMWF scientists were able to experiment with running a worldwide model with a 1km resolution.
_
But no matter how powerful computers become, there is a limit to how far ahead a numerical forecast can look. The atmosphere is what mathematicians call a “chaotic system”—one that is exquisitely sensitive to its starting conditions. A tiny initial change in temperature or pressure can compound over days into drastically different sorts of weather. Since no measurement can be perfectly accurate, this is a problem that no amount of computing power can solve. In 2019 American and European scientists found that even the most minor alterations to simulations resulted in highly divergent forecasts for day-to-day weather after about 15 days. “It seems to be a limit that nature sets,” explains Falko Judt, a meteorologist at the National Centre for Atmospheric Research, in America. “It has nothing to do with our technological capabilities.”
_____
Statistical models:
Because forecast models based upon the equations for atmospheric dynamics do not perfectly determine weather conditions near the ground, statistical corrections were developed to attempt to resolve this problem. Statistical models were created based upon the three-dimensional fields produced by numerical weather models, surface observations, and the climatological conditions for specific locations. These statistical models are collectively referred to as model output statistics (MOS), and were developed by the National Weather Service for their suite of weather forecasting models. The United States Air Force developed its own set of MOS based upon their dynamical weather model by 1983.
Model output statistics differ from the perfect prog technique, which assumes that the output of numerical weather prediction guidance is perfect. MOS can correct for local effects that cannot be resolved by the model due to insufficient grid resolution, as well as model biases. Forecast parameters within MOS include maximum and minimum temperatures, percentage chance of rain within a several hour period, precipitation amount expected, chance that the precipitation will be frozen in nature, chance for thunderstorms, cloudiness, and surface winds.
_______
_______
Different methods used to solve primitive equations in weather models:
For his forecasting model, Richardson constructed a grid to divide the atmosphere into many small air parcels. In essence, this is still done by meteorologists today, but several different grid versions have been developed. Similarly, Richardson’s finite difference method is not the only method for solving the primitive equations anymore; its strongest “opponent” is the so-called spectral method, and a third method, the finite element method is also used.
_
Before the primitive equations can be solved, they have to be discretized with respect to space and time. Discretization means that the atmosphere (or the part of it that you want to study) is represented by a finite number of numerically approximated values. Discretization of differential equations is the process of converting continuous mathematical models and operators into discrete algebraic counterparts so they can be evaluated on a digital computer.
The most common numerical time integration scheme in meteorology is the leapfrog scheme. In order to make a forecast for the future (at time step t+Δt), you do not start at the present time step t, but at the previous step t-Δt, and the forecast leaps over the time step t (with Δt denoting the size of the time step, that is the difference between two points in time). The scheme is applied both in the finite difference method and in the spectral method.
_
All the different methods need to be stable, in other words, it has to be guaranteed that the numerical solution does not diverge from the true solution as the time span for which the forecast is made increases. There are various stability criteria for atmospheric processes such as advection and wave propagation. One of the main causes for instability are truncation errors, which happen when a variable ψ is represented by a Taylor series, i.e. as an infinite sum of its values at the individual grid points. Due to computational reasons, only the very first terms of the series, which are in fact the most important ones, can be used, but the higher-order terms influence the accuracy of the series. As a second order scheme, the leapfrog scheme is fairly accurate; an even better scheme is the so-called Runge-Kutta method, which is of fourth order. However in most of the current models only second order schemes can be applied due to computer capacities. The accuracy of all forecasting models is tested regularly; statistical models have been developed for this.
_
The Finite Difference Method:
The traditional grid structure is based on dividing the Earth’s surface into a large number of squares, such that there is a high air column above each square. The atmosphere is then divided into a number of layers, resulting in a three-dimensional grid, in which the primitive equations can be solved for each grid point. In general, the layers are much thinner close to the Earth’s surface than the layers in the upper atmosphere, as most weather events happen relatively close to the ground. Processes in the upper atmosphere influence the weather, though, so the whole of the atmosphere has to be considered in a forecasting model. Most models also include several subterranean layers so as to take the air and water exchange between atmosphere and ground into account. Over the years, the resolution of the grids has become higher (i.e. the edge length of each square has become smaller).
_
The world’s leading weather services such as the British Met Office and the German DWD use three different grids: a global grid spanning the whole planet, a so-called regional model covering Europe (and North America in the case of the Met Office’s model), and a local model covering the UK or Germany, respectively. The regional model of the DWD has a resolution of 7 km, and the local model has a resolution of up to 2.8 km (the Met Office’s models have coarser resolution as the Met Office does not work with non-hydrostatic equations). Both of these local models, and all of the Met Office models, are based on a rectangular grid, whereas the DWD’s global model is based on a triangular grid with a 40 km resolution. The great advantage of the triangular grid (figure below) is that the primitive equations can be solved in air parcels close to the poles without any problems, as opposed to the rectangular grid, where the longitudes approach each other, resulting in erroneous computations.
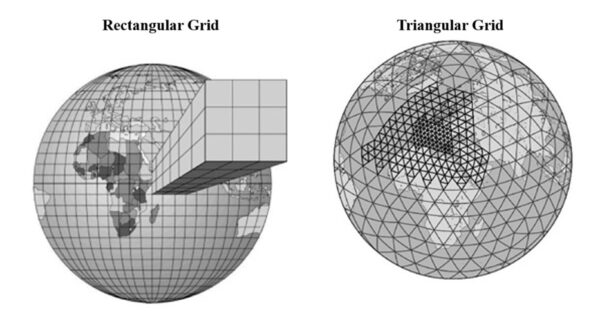
_
In a nutshell, the derivatives in the primitive equations can be approximated by finite differences, such that the equations can be transformed into a linear equation system. It takes modern supercomputers at the leading weather services quite a while to solve all these equations, so it is astonishing that Richardson managed to produce a numerical weather forecast at all, even if it was for a limited area. However, the application of this method to the primitive equations was crucial to the development of numerical weather forecasting, as it was the only mathematical method that could simplify partial differential equations needed for forecasting for several decades.
A further disadvantage of the finite difference method, other than the great number of equations you have to solve, is that it does not reveal anything about the behaviour of the variables between the individual grid points. The spectral method, on the other hand, takes this into account.
_
The Spectral Method:
The spectral method was already devised in the 1950s, but it took a while before the method was implemented in forecasting models. In 1976, the Australian and Canadian weather services were the first ones to adopt this method, which is now used by a range of weather services across the globe; the European Forecasting Centre ECMWF in Reading, for example, adopted it in 1983. One of the advantages of the spectral method is that the primitive equations can be solved in terms of global functions rather than in terms of approximations at specific points as in the finite difference method. For the ECMWF, this is the better option as they require a global model in order to produce medium-range weather forecasts.
_
For the spectral method, the atmosphere has to be represented in terms of spectral components. In the ECMWF model, the atmosphere is divided into 91 layers (in comparison, the DWD’s and the Met Office’s global models have 40 layers), with the number of layers in the boundary layer equalling the number of layers in the uppermost 45 km of the atmosphere. The partial differential equations are represented in terms of spherical harmonics, which are truncated at a total wave number of 799. This corresponds to a grid length of roughly 25 km (the DWD’s and the Met Office’s global model has a resolution of 40 km).
_
In general, spectral method algorithms are more difficult to program than their finite difference counterparts; also the domains in which they are used have to be regular in order to keep the high accuracy of this method. However, the spectral method has a number of advantages: for example, there is no pole problem when the method is used. At the poles, the solutions to differential equations become infinitely differentiable; therefore the poles are usually excluded from the spectral space, which actually simplifies the method. Furthermore, it can handle finite elements of higher orders than the finite difference method can. As a result, the solutions of many problems are very accurate. The high accuracy also results in the fact that the models do not need as many grid points as in the finite difference method, and computers on which the method is run require less memory space.
Summing up, the spectral method gives much more accurate results than the finite difference method. Many weather services still use the finite difference method though because it is much easier to implement and because “the physics is so complicated … that purely numerical errors are a low priority.”
_
The Finite Element Method:
A third technique for finding approximate solutions to partial differential equations and hence to the primitive equations is the finite element method. It is quite similar to the spectral method in that a dependent variable ψ is defined over the whole domain in question, rather than at discrete grid points used in the finite difference method. Moreover, a finite series expansion in terms of linearly independent functions approximates the variation of ψ within a specified element (e.g. a set of grid points). Unlike the spectral method, the basis functions are not globally, but only locally non-zero; also they are low-order polynomials rather than high-order polynomials. The domain for which the partial differential equations have to be solved is divided into a number of subdomains, and a different polynomial is used to approximate the solution for each subdomain. These approximations are then incorporated into the primitive equations. A condition for the finite element method to work, however, is that ψ is continuous between neighbouring elements. The fact that only low-order polynomials can be used is reflected in the comparatively low accuracy, but the amount of necessary calculations is much smaller than for finite differences or for spectral methods. On the other hand, there are a number of choices for the basis functions, and depending on which functions are used, the finite element method can give very accurate results when it is applied to irregular grids. Thus, the use of this method is not restricted to triangular and rectangular grids only as is the finite difference method. This is — currently — probably more important in engineering and fluid dynamics, where this method is most widely used. However, scientists are constantly trying to improve existing and find new mathematical methods that model atmospheric processes better than the methods in use nowadays.
________
The challenge of computer programs and supercomputers:
The forecasting models which are operational in 2016 include several million meshes, about ten variables per mesh and time steps of a few minutes. They require the solution of more than 100 million complex equations to produce a single hour of forecast. Only the use of the most powerful computers, but also efficient algorithms, can produce forecasts quickly enough to be transmitted to forecasters in a time.
_
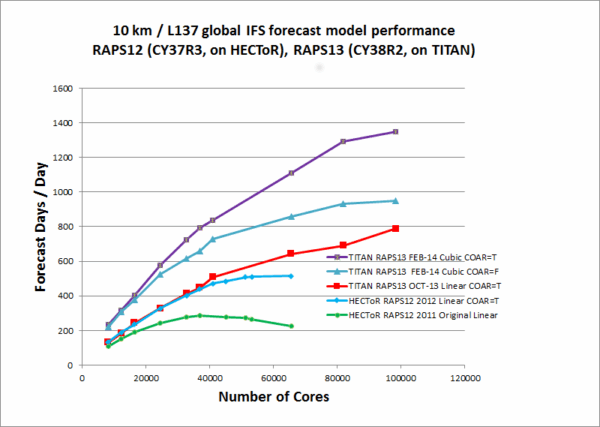
Figure above shows Curves showing an example of a benchmark for a configuration of the ECMWF model corresponding to a horizontal resolution of 10 km and 137 vertical levels. The different curves give the maximum number of forecast days that can be performed by the system depending on the number of processors used on the HECToR and TITAN supercomputers and for different system configurations. Currently, the operational constraint is to produce 10 days of forecast in less than one hour, or at least 240 “days/day”. The green curve shows that, on the Hector ECU and with the 2011 system, the system parallelization is far from optimal because performance is not increased (or even decreased) when the number of processors increases. The purple curve shows a significant improvement in the system’s performance in terms of parallel computing. One of the keys to rapid computing is to be able to distribute the calculations in order to make the different processors of a supercomputer work in parallel. And this parallelization must be done with minimal communications between processors because these communications are often much slower than the local computing capabilities of the processors. These constantly evolving technological constraints require modelers to constantly adapt numerical schemes to the new specificities of the supercomputers. Comparative tests are regularly carried out to evaluate the efficiency of the models in terms of computation speed both for current computer technology and in projection for possible future technologies.
_
An atmospheric model is therefore finally a computer code of several million lines, developed and maintained by dozens of people in parallel. It is the heart of the data assimilation and high-resolution forecasting cycle in operational weather forecast centres. It is also used to produce the perturbed forecasts of each member of the ensemble forecast. Coupled with an ocean model, it is used for monthly and seasonal forecasts and to monitor climate change.
Numerical modelling of the atmosphere has had to and must continue to cope with:
- increases in resolution and therefore in the number of calculations,
- increases in the processes to be described (e.g., addition of atmospheric chemistry),
- increases in the number of processors in the ECUs,
- increases in power consumption of supercomputers,
- increases in the number of program lines,
- increases in the mass of data to be processed and stored at the output.
An important challenge in the coming years is to improve the scalability of existing models, i.e. their ability to adapt to all these increases, while remaining tools that can still be used by all researcher-developers and are still useful for weather forecasting applications.
_
Improvements in Model Resolution and Data Assimilation:
One of the key factors in improving weather forecasting accuracy is the development of higher-resolution models. These models are able to capture more detailed information about the atmosphere, allowing for more accurate predictions of weather patterns. For example, the European Centre for Medium-Range Weather Forecasts (ECMWF) has developed a model with a resolution of 9 km, which is able to capture complex weather phenomena such as thunderstorms and heavy precipitation events
In addition to improvements in model resolution, advances in data assimilation have also played a crucial role in improving weather forecasting accuracy. Data assimilation is the process of combining model forecasts with observational data to produce the best possible initial conditions for a forecast. The use of advanced data assimilation techniques, such as ensemble Kalman filter (EnKF) and 4D-Var, has been shown to significantly improve forecast accuracy.
_______
_______
Fundamentals of Numerical Weather Prediction:
Though weather is stochastic to the core, the well-understood physical laws of hydrodynamics long have been applied to predict the weather with useful near-to-midterm accuracy. Instantiating these laws in predictive models requires simulating the earth’s atmosphere as a three-dimensional grid of cells exchanging energy and moisture from observed starting conditions. This requires some of the most complex and demanding computational workloads in existence.
Consequently, the forecasts we all rely upon today are generally provided by large national weather services—most importantly, the National Oceanic and Atmospheric Administration (NOAA) and National Weather Service (NWS) in North America and the European Centre for Medium-Range Weather Forecasts (ECMWF) in Europe, supplemented by several country-specific models such as the Unified Model (UM) in the U.K. and the ICON Model in Germany.
_
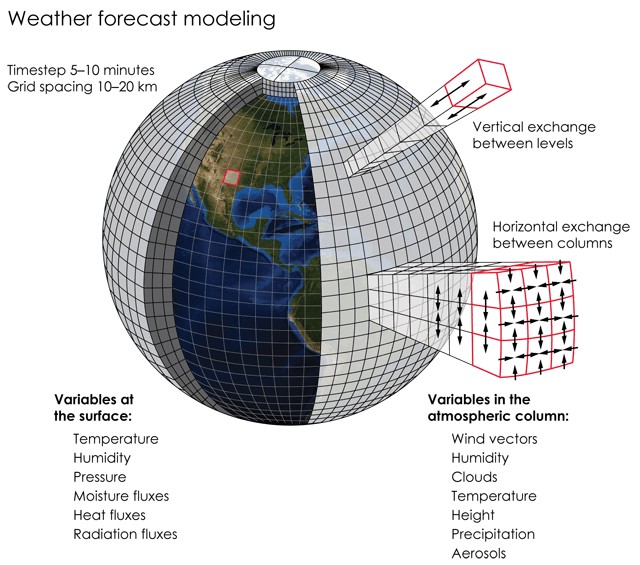
Figure above is an overview of NWP.
_
Numerical Weather Prediction (NWP) is a cornerstone of modern meteorology, enabling forecasters to predict weather patterns with increasing accuracy. At its core, NWP involves solving complex mathematical equations that describe the behavior of the atmosphere. NWP is based on the idea that the future state of the atmosphere can be predicted by solving a set of nonlinear partial differential equations that describe the dynamics and thermodynamics of the atmosphere. These equations, known as the primitive equations, account for the conservation of mass, momentum, and energy. The complexity of the primitive equations requires significant computational resources to solve them accurately. Supercomputers play a crucial role in NWP by providing the necessary processing power to run complex models. Modern supercomputers can perform calculations at speeds of over 100 petaflops (1 petaflop = 1 million billion calculations per second), enabling forecast models to be run at high resolutions and with complex physics.
_
NWP center:
Each country in the world has a National Meteorological Service (NMS), whose mission is to make regular observations of the atmosphere and to issue forecasts for government, industry and the public. But only the most advanced countries have Numerical Weather Prediction (NWP) centres, whose products are also distributed to other countries, in exchange for their observations, within the framework of the World Meteorological Organization.
Among the main NWP centres outside Europe are those in the United States, Canada, Japan, Korea, China, Russia, Australia, India, Morocco, South Africa and Brazil. In Europe, only France, the United Kingdom and Germany make numerical forecasts for the entire globe, while the other countries have NWP centres covering only regional areas. The European countries have also come together in a “super-centre”, which is responsible for providing them with medium-range numerical forecasts.
_
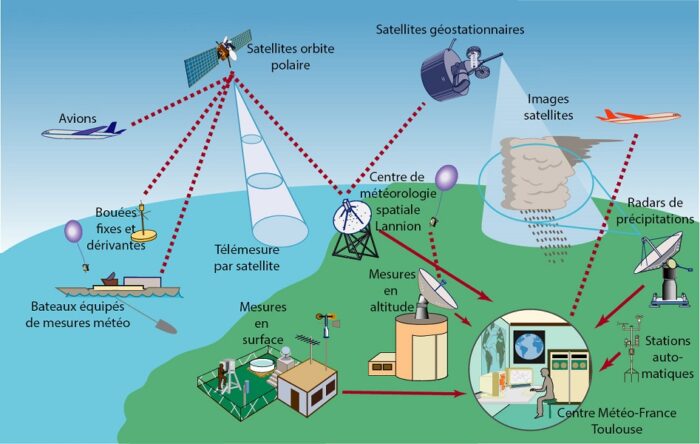
Figure above shows observation systems used in operational meteorology.
_
The organization of NWP centres varies from one country to another, but there are some shared major functions described below. The first important function is the reception of observations. Observations means any numerical data characterizing the state of the atmosphere or related media. These observations are very varied, we will note in particular:
–Surface level measurements made by Meteorological Services worldwide, either at land stations or on offshore buoys;
–Altitude measurements made by ascending balloons (radiosondes) or meteorological radars;
–Measurements made by meteorological satellites or, more generally, Earth observation satellites (there are currently more than fifteen such satellites);
–Measurements taken on board commercial aircraft or vessels.
_
The behavior of the atmosphere can be described by a set of hydrodynamic equations which express how the air moves, the process of heating and cooling, the role of moisture, etc. Numerical weather prediction is generally performed by numerical integration of the hydrodynamic equations governing atmospheric motions. These non-linear equations describing the evolution of the atmosphere do not have analytical solutions even if the problem is “well posed”. If an analytical solution does not exist, we have to use the numerical techniques to find a certain approximation to the true solution of the system of equations and therefore we have to use computers. With the introduction of powerful computers in meteorology, the meteorological community has invested more time and efforts to develop more and more complex numerical models of the atmosphere.
_
Given a description of the current state of the atmosphere, numerical models can be used to propagate this information forwards to produce a forecast for future weather. The state of the atmosphere is described by the spatial distribution of wind, temperature, and other weather variables. By extrapolating the computed tendencies ahead in time, the model can predict the field variables in the future.
_
The initial conditions of any numerical integration are given by very complex assimilation procedures which estimate the state of the atmosphere by considering all available observations. The fact that a limited number of observations are available and that part of the globe is characterized by a very poor coverage introduces uncertainties in the initial conditions. A short-range forecast or first-guess provides an estimate of the atmosphere that is compared with the observations. The two fields are combined to obtain a correct atmospheric state called analysis. This process is named “Data Assimilation” (Figure below).
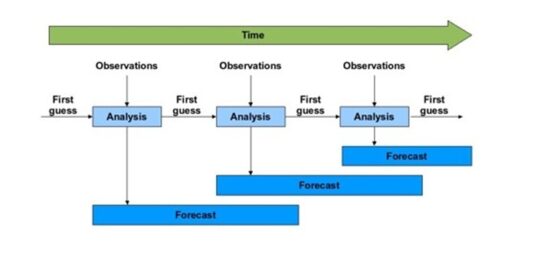
Figure above shows assimilation and forecast cycle of a numerical model. The observations and the first-guess field are combined to obtain the analysis.
In contrast to the original differential equations which describe the whole spectrum of atmospheric motions, the discretized equations describe only processes with certain spatial and temporal scales. Since sub grid-scale processes are not included in models, only their statistical effects on the mean flow are taken into account. The statistical contributions by the different processes must be expressed in terms of the large-scale parameters themselves. The mathematical procedure involved is called parametrization.
_
There are several types of numerical models depending on the spatial and temporal scales considered. However, all models are based on the same hydrodynamic equations with initial conditions but with different parametrizations and horizontal and vertical resolutions.
Mesoscale models are used for short-range weather forecasts (0-2 days ahead). These models have a non-hydrostatic dynamical core and 1-3 km horizontal resolution. They produce forecasts few hours after observations are made. They are limited area models and their boundary conditions are given by a global model.
The global models are used for medium-range weather forecasts (2-15 days ahead). These models have a hydrostatic dynamical kernel. Both the parametrizations and the assimilation procedure are very important in them. They have more vertical levels than limited area models and the horizontal resolution is around 10-25 km. They produce forecasts up to several hours after observations are made.
_
The architecture of a typical NWP system is as follows:
Data Collection
Data Assimilation
Model Initialization
Numerical Integration
Post-processing
Forecast Output
_
Overview of Data Assimilation Techniques:
Data assimilation is the process of combining model forecasts with observational data to produce the best possible initial conditions for a forecast model. There are several data assimilation techniques used in NWP, including:
- Optimal Interpolation (OI): a simple, computationally efficient method that uses a weighted average of model forecasts and observations to produce the analysis.
- 3D-Var: a more sophisticated method that uses a variational approach to minimize the difference between the model forecast and observations.
- 4D-Var: an extension of 3D-Var that takes into account the temporal evolution of the model forecast and observations.
- Ensemble Kalman Filter (EnKF): a method that uses an ensemble of model forecasts to estimate the uncertainty in the analysis.
_
Components of NWP Models:
NWP models consist of several key components, including model physics and dynamics, initial and boundary conditions, and data assimilation methods.
Model Physics and Dynamics:
Model physics refers to the representation of physical processes in the atmosphere, such as cloud formation, precipitation, and radiation. Model dynamics refers to the numerical methods used to solve the primitive equations.
Some of the key physical processes represented in NWP models include:
- Cloud microphysics: the formation and evolution of clouds and precipitation.
- Convection: the representation of vertical transport of heat and moisture.
- Radiation: the interaction between the atmosphere and radiation.
- Boundary layer processes: the representation of the atmospheric boundary layer.
Initial and Boundary Conditions:
Initial conditions refer to the state of the atmosphere at the start of a forecast. Boundary conditions refer to the conditions at the edges of the model domain.
The quality of the initial conditions is critical to the accuracy of the forecast. Data assimilation techniques are used to produce the best possible initial conditions.
Boundary conditions can be either lateral boundary conditions, which define the conditions at the edges of the model domain, or surface boundary conditions, which define the conditions at the surface.
Data Assimilation Methods:
Data assimilation methods are used to combine model forecasts with observational data to produce the best possible initial conditions. The choice of data assimilation method depends on the specific application and the available computational resources.
Some of the key considerations when selecting a data assimilation method include:
- Computational cost: the computational resources required to run the data assimilation system.
- Accuracy: the ability of the data assimilation system to produce accurate initial conditions.
- Flexibility: the ability of the data assimilation system to handle different types of observational data.
_
Challenges in NWP:
Despite the advances in NWP, there are still several challenges that need to be addressed.
-Predictability Limits:
The predictability limit refers to the maximum time period over which a forecast can be made with a certain level of accuracy. The predictability limit is influenced by the complexity of the atmosphere and the quality of the initial conditions.
Research has shown that the predictability limit is around 10-14 days for mid-latitude weather patterns. However, this limit can be extended by improving the accuracy of the initial conditions and the model physics.
-Model Biases and Uncertainties:
Model biases and uncertainties refer to the errors in the model forecast due to the representation of physical processes and the initial conditions.
Some of the key sources of model bias and uncertainty include:
- Model physics: the representation of physical processes in the atmosphere.
- Initial conditions: the quality of the initial conditions.
- Boundary conditions: the conditions at the edges of the model domain.
______
Models that cover the entire globe:
Two of the more well-known/used weather models are the European Center for Medium-Range Weather Forecast (ECMWF) a.k.a. the “Euro” model, and the United States’ Global Forecast System (GFS) model. Both of these models cover the entire globe.
GFS:
- Global Forecasting System
- Produced by the US Government
- Covers the entire globe
- Forecasts out to 384 hours (16 days)
- Updates 4x per day
- Model resolution of 13 km
- Average accuracy score lags the ECMWF (but every storm is different)
- Cost = freely available to anyone
ECMWF:
- European Center for Medium-Range Weather Forecasts
- Produced by a group of European Governments
- Covers the entire globe
- Forecasts out to 240 hours (10 days)
- Updates 2x per day
- Model resolution of 9 km (more detailed than the GFS)
- Average accuracy score makes it the best model (but every storm is different)
- Cost = $250,000 for commercial license to host data. Personal license is available to access data with an individual subscription.
_
Models that cover a smaller area:
Then there are mesoscale (fine-scale) models, which hone in on more specific regions and tend to be able to forecast really small weather features better than the global models, like thunderstorms or snowfall within steep mountains.
The two most popular U.S. mesoscale models are known as the North American Mesoscale Forecast System (NAM) and the High-Resolution Rapid Refresh (HRRR) model.
NAM:
- North American Model
- Produced by the US Government
- Covers the United States
- Two versions: Standard and High-Resolution
- Standard = 12km resolution for North America out to 84 hours (3.5 days)
- High-Resolution = 3km resolution for the United States out to 60 hours (2.5 days)
- Cost = freely available to anyone
HRRR:
- High-Resolution Rapid Refresh
- Produced by the US Government
- Covers the United States
- Forecasts out to 18 hours
- Updates once every hour
- Model resolution of 3km
- Cost = freely available to anyone
________
Remarkable improvement in weather forecast:
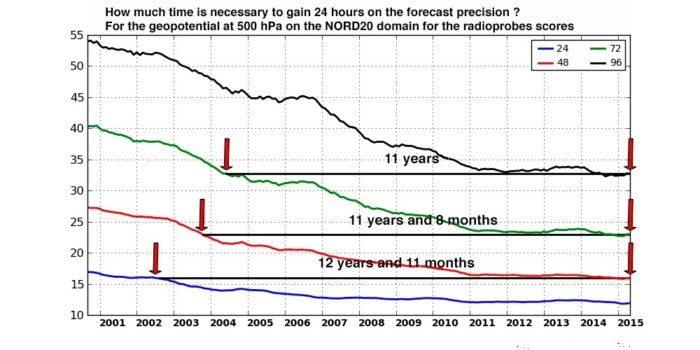
Figure above shows Evolution of the quality of the forecasts of the ARPEGE model over the last 15 years. The score shown is the mean square error of the geopotential forecasts at 500hPa (geopotential is the precise altitude of the 500 hPa pressure surface, which is approximately 5000 m), averaged over the entire Northern Hemisphere north of 20° latitude, for the lead-times 24, 48, 72, and 96 hours. There has been a steady improvement in quality, which has resulted in an improvement of about 24 hours in 11 to 12 years.
_
The remarkable improvement in the quality of weather forecasts is one of the great successes of environmental science in the 20th century, which continues at a sustained pace at the beginning of the 21st century. This is due to the progress of numerical prediction systems and the increasing number and variety of observations of the state of the atmosphere and related media (ocean, soils, vegetation, cryosphere), including observations from Earth observation satellites. The rapid development of supercomputers has been one of the keys to this success, which has also required significant scientific work.
_
Weather models have revolutionised the science of weather prediction. Improvements in models, and a vast increase in the observation data that feeds them, have made a huge difference. They’re a big part of why our 5-day forecasts today are about as accurate as a 3-day forecast in the early 2000s. The map below shows how weather models between 1974 and 2010 would have forecast the path of severe tropical cyclone Tracy. They come closer and closer to the path it actually took.
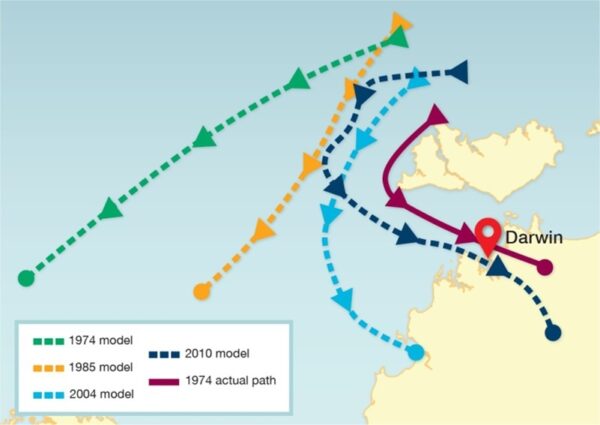
_
Figure below shows comparison between an image produced from satellite observations of 15 October 2016 at 12 GMT (top figure) and the corresponding synthetic image produced from the 12-hour maturity forecast of the ECMWF model.
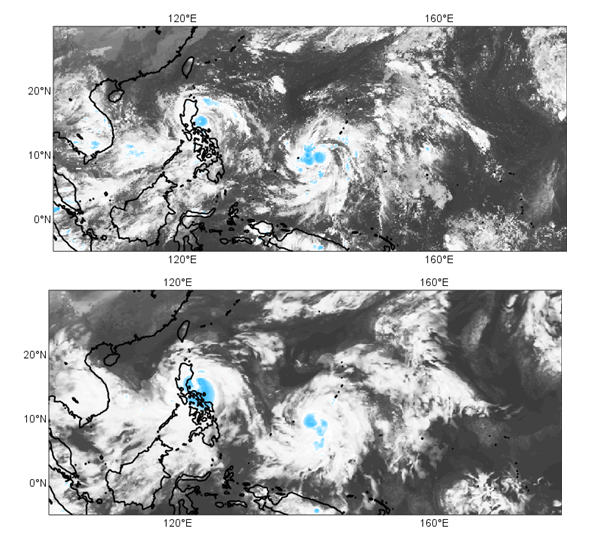
The fields provided by the model are not stored at each time step but only for the forecast times required by the users. The raw parameter fields such as temperature, wind or geopotential height are interpolated to the isobaric levels conventionally used by forecasters. Cloud cover and surface precipitation are provided directly by the cloud parameterizations. Many other parameters are diagnosed from the model’s raw outputs to help the forecaster analyze the behaviour of the atmosphere and compare the predicted states with new observations that arrive in real time. Maps of surface parameters such as temperature at 2 m above the surface, wind at 10 m above the surface, gusts, but also satellite images or synthetic radar images (Figure above) are thus routinely processed. Model outputs are the main information that is made available to expert forecasters. They use it to produce the best general scenario for the weather evolution in the coming days and the necessary refinements for each region around the globe.
_______
_______
Ensemble forecasting:
In 1963, Edward Lorenz discovered the chaotic nature of the fluid dynamics equations involved in weather forecasting. Extremely small errors in temperature, winds, or other initial inputs given to numerical models will amplify and double every five days, making it impossible for long-range forecasts—those made more than two weeks in advance—to predict the state of the atmosphere with any degree of forecast skill. Furthermore, existing observation networks have poor coverage in some regions (for example, over large bodies of water such as the Pacific Ocean), which introduces uncertainty into the true initial state of the atmosphere. A complex set of equations called the “Liouville Equations” actually account for the uncertainty in the initial conditions. These equations produce not just a single forecast, but a set of forecasts (a full distribution of possible forecast states) – given a range (distribution) of possible initial states of the atmosphere. Both the input and the output of these equations are in the form of a Probability Density Function (PDF). While Liouville equations exist to determine the initial uncertainty in the model initialization, the equations are too complex to run in real-time, even with the use of supercomputers. These uncertainties limit forecast model accuracy to about five or six days into the future.
_
Edward Epstein recognized in 1969 that the atmosphere could not be completely described with a single forecast run due to inherent uncertainty, and proposed using an ensemble of stochastic Monte Carlo simulations to produce means and variances for the state of the atmosphere. Although this early example of an ensemble showed skill, in 1974 Cecil Leith showed that they produced adequate forecasts only when the ensemble probability distribution was a representative sample of the probability distribution in the atmosphere.
Since the 1990s, ensemble forecasts have been used operationally (as routine forecasts) to account for the stochastic nature of weather processes – that is, to resolve their inherent uncertainty. This method involves analyzing multiple forecasts created with an individual forecast model by using different physical parametrizations or varying initial conditions. Starting in 1992 with ensemble forecasts prepared by the European Centre for Medium-Range Weather Forecasts (ECMWF) and the National Centers for Environmental Prediction, model ensemble forecasts have been used to help define the forecast uncertainty and to extend the window in which numerical weather forecasting is viable farther into the future than otherwise possible. The ECMWF model, the Ensemble Prediction System, uses singular vectors to simulate the initial probability density, while the NCEP ensemble, the Global Ensemble Forecasting System, uses a technique known as vector breeding. The UK Met Office runs global and regional ensemble forecasts where perturbations to initial conditions are used by 24 ensemble members in the Met Office Global and Regional Ensemble Prediction System (MOGREPS) to produce 24 different forecasts.
_
In a single model-based approach, the ensemble forecast is usually evaluated in terms of an average of the individual forecasts concerning one forecast variable, as well as the degree of agreement between various forecasts within the ensemble system, as represented by their overall spread. In the same way that many forecasts from a single model can be used to form an ensemble, multiple models may also be combined to produce an ensemble forecast. This approach is called multi-model ensemble forecasting, and it has been shown to improve forecasts when compared to a single model-based approach. Models within a multi-model ensemble can be adjusted for their various biases, which is a process known as superensemble forecasting. This type of forecast significantly reduces errors in model output.
_
Ensemble forecasting is a technique used to quantify the uncertainty associated with a forecast. By running multiple models with slightly different initial conditions, ensemble forecasting can provide a range of possible outcomes, allowing forecasters to assess the likelihood of different weather scenarios. This is particularly useful for predicting high-impact weather events, such as hurricanes or blizzards, where the uncertainty associated with the forecast can be high. The use of ensemble forecasting has become increasingly widespread in recent years, with many operational forecasting centers now using ensemble techniques to inform their forecasting decisions. For example, the ECMWF’s Ensemble Prediction System (EPS) provides a 51-member ensemble forecast, which is used to predict the probability of different weather events.
There are two main sources of uncertainty that must be accounted for when making an ensemble weather forecast: initial condition uncertainty and model uncertainty.
Initial condition uncertainty arises due to errors in the estimate of the starting conditions for the forecast, both due to limited observations of the atmosphere, and uncertainties involved in using indirect measurements, such as satellite data, to measure the state of atmospheric variables.
Model uncertainty arises due to the limitations of the forecast model. The process of representing the atmosphere in a computer model involves many simplifications such as the development of parametrisation schemes, which introduce errors into the forecast. Every weather model is based on assumptions and approximations which adds to uncertainty.
_
In order to understand the difference between deterministic (NWP) and ensemble (probabilistic) forecasts, we need to know more about ensemble forecasts. At many weather modeling centers, as soon as the computer has finished processing the DF, it gets to work on the second type of forecast; an Ensemble Forecast. As the name suggests, the ensemble is comprised of many forecasts or members – anywhere between 12 and 51, depending on the center.
In Figure below time moves left to right; the DF is shown by the single bold line, and the many forecasts of the ensemble are shown by the dashed lines. As the power of the computer is fixed, and the 12 to 51 ensemble members are calculated concurrently, the forecasts are necessarily run at a much lower resolution than the deterministic forecast.
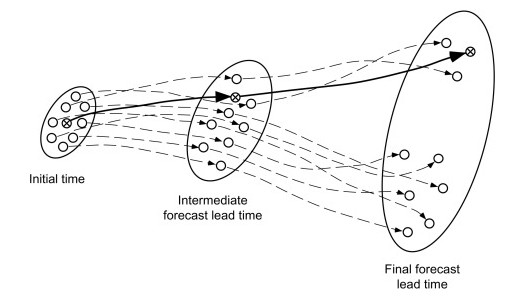
Figure above shows the ensemble average masks the spread in the forecasts, which is represented by the ellipse surrounding each forecast. The forecasts are represented by each dot.
If we run the same model twice, with precisely the same IC, then it produces two identical forecasts, which is of no use whatsoever. To produce a set of ensemble forecasts, the IC are changed slightly for each ensemble member. There is uncertainty in the original IC and the new IC are just as likely to match the real world as those used for the DF – this is known as sampling the uncertainty (the different starting points are shown on the left of the image in Figure above). In some models, slight variations are also made to the equations in an attempt to capture some of the model uncertainty. The advantage gained in producing many possible outcomes outweighs the fact that the ensemble members are run at lower resolution – and the Ensemble Average (EA) is often more skilful than the DF at longer lead times. In fact, an ensemble forecast is a vital tool for long range forecasting.
_
Use of Ensemble Forecasts to produce improved Medium Range (3-15 days) Weather Forecasts:
The traditional method of making a weather forecast is to take the best model available and run it until it loses its skill due to the growth of small errors in the initial conditions. Skill is typically lost after 6 days or so, depending on the season. An alternate method that produces forecasts with skill up to 15 days after the initial forecast uses what is called “ensemble forecasting”. Instead of using just one model run, many runs with slightly different initial conditions are made. An average, or “ensemble mean”, of the different forecasts is created. This ensemble mean will likely have more skill because it averages over the many possible initial states and essentially smoothes the chaotic nature of atmosphere. In addition, it is now possible to forecast probabilities of different conditions because of the large ensemble of forecasts available.
Ensemble forecasting is a method used in or within numerical weather prediction. Instead of making a single forecast of the most likely weather, a set (or ensemble) of forecasts is produced. This set of forecasts aims to give an indication of the range of possible future states of the atmosphere.
Ensemble forecasting is a form of Monte Carlo analysis. The multiple simulations are conducted to account for the two usual sources of uncertainty in forecast models: (1) the errors introduced by the use of imperfect initial conditions, amplified by the chaotic nature of the equations of the atmosphere, which is often referred to as sensitive dependence on initial conditions; and (2) errors introduced because of imperfections in the model formulation, such as the approximate mathematical methods to solve the equations. Ideally, the verified future atmospheric state should fall within the predicted ensemble spread, and the amount of spread should be related to the uncertainty (error) of the forecast.
In general, this approach can be used to make probabilistic forecasts of any dynamical system, and not just for weather prediction.
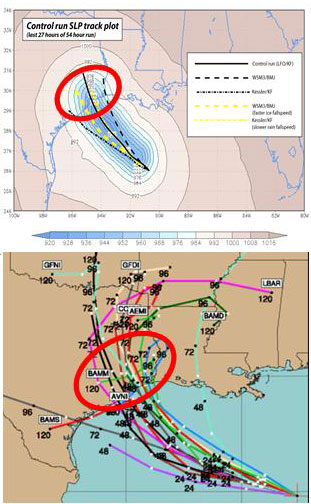
Figure above Top: Weather Research and Forecasting model simulation of Hurricane Rita tracks.
Figure above Bottom: The spread of National Hurricane Center multi-model ensemble forecast.
_____
The ensembles to help decision-making:
Ensemble weather forecasts have been in use for many years to help forecasters understand uncertainty in weather predictions but are now becoming core to some operational NWP systems. Ensembles offer greater predictive skill and information content than deterministic forecasts but are more complex to interpret and communicate; essential if users are to benefit through improved decision-making. An ensemble forecast runs a computer model multiple times with slightly different starting conditions to create a group of individual forecasts, which are then used to calculate the likelihood of specific future weather events in a probability forecast.
Probability forecasts can be used in two main ways:
-Using a range of values
-Using percentages
For a specific weather element, such as temperature or wind speed, a range of values can be provided, along with a measure of how confident we are that the actual value will fall within that range.
A probability forecast can give a percentage of how likely a defined event is to occur, which can help users to assess the risks associated with particular weather events to which they are sensitive.
Ensembles are designed to estimate these probabilities by sampling the range of possible forecast outcomes. The probability of a particular event occurring is estimated by counting the proportion of ensemble members which forecast that event to occur. So if six out of the 24 members predict more than 5 mm of rain at a specified location in a defined period, we would estimate there to be a 1-in-4, or 25%, chance of the event happening.
If the probability of an event occurring is 10%, this means that the event will only occur on one occasion in every 10 (or equivalently 10 in 100). Therefore, on the other nine out of 10 occasions the event will not occur. This means that we can never say whether a single probability forecast is right or wrong. We can only measure how good our probability forecasts are by looking at a large set of forecasts. Then we can group all the 10% forecasts together and check that the event occurred on one in 10 of these occasions.
Although they give a useful guide, ensembles cannot provide a perfect representation of probability. By reviewing past performance we can use statistics to calibrate the forecast and give improved probability forecasts.
______
______
Deterministic (NWP) to probabilistic (ensemble) forecast:
The atmospheric movements can be described by non-linear differential equations that unfortunately have no analytical solution. The numerical methods to solve them have been developed in different stages. During the 50s was demonstrated the close relation between cyclone dynamics and the global circulation using a 2-layer model. At the beginning of the 70s, the global circulation models emerged (Lynch, 2006), which are based on a set of non-linear differential equations, called primitive equations. During the 80s, regional and mesoscale numerical models appeared (Athens and Warner, 1978; Mesinger et al., 1988) and the 90s, atmosphere-ocean and atmosphere-ocean-soil coupled models allowed the development of diagnostic techniques for weather forecasting (Davis and Emanuel, 1991; Stein and Alpert, 1993; Mechoso and Arakawa, 2003). This evolution on numerical weather prediction is a direct consequence of the increase of computer power, the spatio-temporal high resolution of the models and the improvement in observational networks and assimilation methods. All of this contributed to extend the knowledge on the dynamics and microphysical processes in the atmosphere.
_
Until then, the numerical weather prediction (NWP) philosophy was based on the deterministic atmospheric behaviour. That means, given an initial state of the atmosphere, its time evolution can be numerically predicted to give a final state, which is unique. Accordingly to this premise, a deterministic system is one in which the chance is not involved in any future states of the system. As a consequence, a deterministic model will always lead to the same final state from identical initial conditions. Consequently, the efforts of the scientific community on NWP were focused on producing the most accurate forecast (Tracton and Kalnay, 1993).
_
Uncertainty sources in Numerical Weather Prediction:
Lorenz (1963) showed the concepts of Chaos Theory using a simplified model of fluid convection to numerically represent a dynamical system that exhibits most of the properties of other more complex chaotic systems. Lorenz demonstrated that small variations on the model initial conditions (ICs) do not produce a single final solution but a set of different possible solutions. Consequently, due to the chaotic nature of the atmosphere, different sources of uncertainty (error) can be defined in NWP within the forecast chain:
- ICs forecast error source: Forecast errors can arise due to inaccuracies in the characterization of the initial atmospheric state.
- Model formulation forecast error source: Due to inadequacies of NWP models on its own.
- Parameterization forecast error source: Processes that occur at spatial scales finer than the model spatio-temporal resolution the model works with must be parameterized by empirical formulations leading to another source of uncertainty.
- LBCs forecast error source: When limited-area models (LAM) are used to design LAM ensemble prediction systems (LAMEPS), lateral boundary conditions (LBCs) coming from global NWP models are another source of forecast error.
_
Errors are amplified as the forecast period grows and will evolve into spatial structures shaping the flow of the day. The inherent atmospheric predictability is thus state-dependent and that is why the predictability of the future atmospheric states is also limited in time (Lorenz, 1963 and 1969).
Observational methods, assimilation strategies and the own characteristics of numerical models have inherent limitations that introduce uncertainty in the estimation of the possible future atmospheric states. This uncertainty misleads the forecast and is amplified when the forecast period grows and when the spatio-temporal resolution of the model increases.
Therefore, the atmospheric state cannot be exactly known because the forecast chain always contains uncertainties, which only can be estimated. The inaccurate determination of the real atmospheric state leads to the existence of a set of initial conditions compatible with it. A single model only provides a single solution of the future atmospheric state.
_
The traditional deterministic approach gave way to a new paradigm with richer information than a single solution of the future state of the atmosphere. The new paradigm includes quantitative information about the uncertainty (errors) of the predictive process. The atmospheric non-linear behaviour, consequently chaotic, must be treated now in a probabilistic way by means of the generation of multiple forecasts starting from slightly different but equally probable initial conditions in order to characterize the uncertainty of the prediction (Leith, 1974).
To capture these sources of uncertainty, many operational and scientific centres worldwide produce ensemble forecasts (e.g. NCEP, ECMWF, etc.) since the early of 1990s. The basic idea behind ensemble forecasting is to run multiple (ensemble) forecast integrations from slightly perturbed ICs (ICs forecast error source) coming from multiple models and/or perturbing model formulation (model formulation forecast error source).
_
Ensemble prediction techniques:
A practical approximation to probabilistic forecasting based on meteorological models is the so-called ensemble forecasting methodology. The ensemble prediction system (EPS) is a tool for estimating the time evolution of the Probability Density Function (PDF) viewed as an ensemble of individual selected atmospheric states. Each of these initial different states is physically plausible. The spread of the states is representative of the prediction error/uncertainty (Toth and Kalnay, 1997).
If an idealized EPS could be generated that just properly captures all sources of forecast error (uncertainty), then the forecasted PDF would be reliable and skilful, that is, sharper than the climatological PDF. No further information is needed to become trustworthy the forecast-error predictions since a perfect PDF is a complete statement of the actual forecast uncertainty.
These errors are particularly pronounced when dealing with mesoscale forecast of near surface weather variables leading to large under-dispersion results because of the insufficient ensemble size, inadequate parameterization of sub-grid scale processes and inaccurate knowledge of land-surface boundary conditions (Eckel and Mass, 2005). Even so, real ensemble forecast distributions often represent a substantial portion of the true forecast uncertainty although they were generated from an incomplete representation of weather forecast error sources.
_______
Deterministic vs. Probabilistic Forecasts:
Weather forecasting relies on two primary approaches: probabilistic and deterministic forecasts. Each serves a distinct purpose, catering to different decision-making needs. A probabilistic forecast presents a range of possible outcomes, assigning probabilities to each. This approach acknowledges uncertainty, helping stakeholders assess potential risks and plan for multiple scenarios. In contrast, a deterministic forecast provides a single, specific prediction—offering a clear expectation without expressing likelihoods for alternative outcomes.
_
Weather forecasting models split into two main types: deterministic and probabilistic. Deterministic models predict a single future outcome, probabilistic models project a range of scenarios with odds, and both rely on supercomputers running complex math on atmospheric data.
Deterministic Models:
- Single Output: Yields one exact value or map for a specific time and place (e.g., a high of 82°F).
- High Resolution: Uses fine grid spacing to resolve local terrain, clouds, and short-term changes very clearly.
- Best for Short Range: Highly accurate for the first 1 to 2 days, but skill drops off fast as forecast time increases.
- No Confidence Metric: Does not show how certain or uncertain the prediction is.
Probabilistic Models:
- Multiple Scenarios: Runs an ensemble (many slightly different versions of the initial conditions) to generate a spectrum of outcomes.
- Risk Assessment: Assigns percentages or likelihoods to events, such as an 80% chance of rain or a 20% chance of heavy snow.
- Best for Medium/Long Range: Accounts for the chaotic, unpredictable nature of the atmosphere over 3 to 15 days.
- Wider Spread: Helps planners see extreme worst-case or best-case scenarios alongside the most likely average.
_
Core Comparison:
|
Feature |
Deterministic Models |
Probabilistic Models |
|
Output Type |
Single value (point forecast) |
Range of values and odds |
|
Resolution |
Higher spatial resolution |
Coarser grid/resolution due to multiple runs |
|
Primary Strength |
Precision in short-range forecasting |
Uncertainty and risk management in medium/long range |
|
Main Weakness |
Hides uncertainty; fails if initial data has tiny errors |
Computationally heavy; harder for the general public to read quickly |
________
Below is a difference between deterministic and ensemble forecasts. The highly detailed deterministic forecast is able to resolve small scale features, and this precision scores very well in the early stages of the forecast as the model closely matches the real world. As time progresses, the small-scale features in the model start to misalign with the equivalent features in the real world. As the model continues to give very specific weather values and locations, this precision becomes detrimental, and accuracy drops rapidly at around 6 days ahead as the noise starts to become larger than the signal as seen in the figure below.
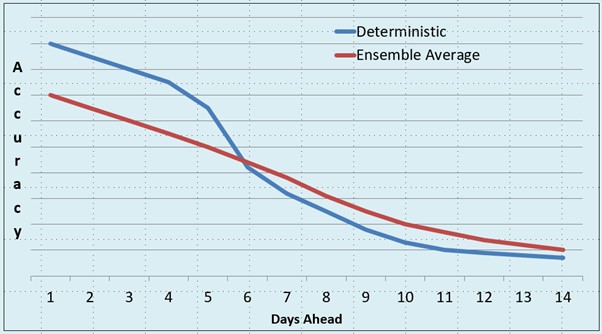
Figure above is a schematic diagram of the typical accuracies of a deterministic forecast and an ensemble forecast at various lead times.
In the lower resolution ensemble forecast, the model is relatively vague about values and positions and thus accuracy is modest. As time progresses, accuracy declines at a steady rate. Beyond six days ahead, the vagueness of the (Ensemble Average) EA works to its advantage and makes the forecast a better guide than the deterministic forecast.
We see that the best forecast is given by the (Deterministic Forecast) DF in the early stages of the evolution, but where the lines cross at around 6 days ahead, so the ensemble becomes the more accurate model. In this way, the model that gives the better forecast is determined by the horizon for which we are forecasting.
_______
_______
Use of Artificial Intelligence:
Artificial intelligence (AI) is being increasingly used in weather forecasting to improve the accuracy and reliability of forecasts. AI techniques, such as machine learning and deep learning, are used to analyze large datasets and predict future weather patterns.
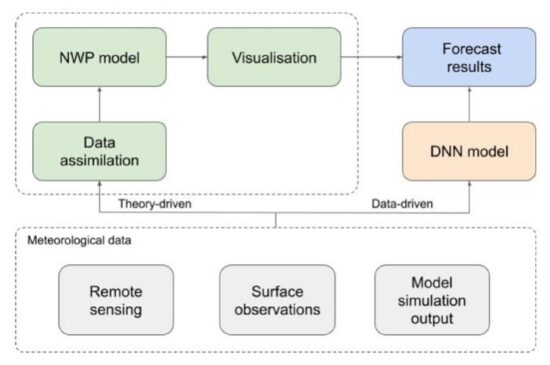
Machine learning replaces slow mathematical calculations in weather forecasting with fast, data-driven pattern recognition. Traditional weather forecasting uses supercomputers to solve complex physical equations. Machine learning models take a different path:
- Training on history: Models study decades of past atmospheric data, such as the ECMWF’s ERA5 reanalysis archives.
- Recognizing patterns: Instead of calculating physics from scratch, AI learns how weather states evolve over time.
- Instant results: Trained models generate global forecasts in seconds or minutes on a single graphics card, using a tiny fraction of the energy.
_______
_______
Section-9
Technology of weather forecasting:
Today weather forecasting has become very scientific and involves some well-defined steps like recording, collecting, transmitting, compilation, plotting, analyzing and then the final forecasting of the weather related information. Recording of weather data like temperature, pressure, wind speed and direction, precipitation etc. is done with the help of several instruments and tools in weather and meteorological stations. These stations are located around the world be it land or water surface. These recordings are done at different times of the day, especially during the four times, that is, 6 a.m., 6 p.m., 12 a.m. and 12 p.m. Satellite imageries are also studied to record weather related information. Collection of weather related information and data is done through various weather recording centres and stations scattered at different places around the world. These centres are distributed in various landscapes, that is, mountains, plains, plateaus as well as water areas in the oceans and seas. They collect meteorological, climatological, hydrological and oceanographic data from over 15 satellites, 100 moored buoys, 600 drifting buoys, 3000 aircraft, 7300 ships and some 10,000 land-based observation stations which are a part of World Meteorological Organisation (WMO).
_
Transmission of weather related data is done after the recording and collection. World Meteorological Organisation is a scientific body of United Nations established in 1950 and having 191 member countries with a huge network of observatories and stations as mentioned above. WMO coordinates with National Meteorological and Hydrological Services of its member countries through which weather related data is shared internationally through the World Weather Watch. There are three major collection centres of WMO where the information from local and regional centres are transmitted. They are located at Washington D.C. in USA, Melbourne in Australia and Moscow in Russia. This enables in the dissemination of daily weather forecasts and early and reliable warnings of high-impact weather and climate events. After the processes of recording, collection and transmission of data comes the work of compilation and analysis of data which is done by climatological experts. Computers are used in the final analysis work and various models are in use by the experts which we would learn in the coming subsections. Lastly after the analysis, final interpretation is done which is in the form of weather forecast.
_
Technology in weather forecasting now relies on computer-based models that use real-time data from automated weather stations, Doppler radar, radiosondes, and weather satellites to project atmospheric changes with greater accuracy. Artificial intelligence is also being used to generate faster, localized forecasts at lower cost than traditional physics-based models. Weather forecasting has evolved significantly, primarily due to advancements in technology. Modern forecasting relies on various tools and methods to improve accuracy and efficiency.
Key Technologies Used in Weather Forecasting:
|
Technology |
Description |
|
Automated Weather Stations (AWS) |
Collect real-time data on humidity, wind speed, temperature, and atmospheric pressure. |
|
Doppler Radar |
Measures wind and precipitation, crucial for tracking severe weather and storms. |
|
Radiosondes |
Weather balloons that monitor atmospheric conditions at different altitudes. |
|
Weather Satellites |
Provide global weather data, including sea surface temperatures and cloud cover. |
|
Artificial Intelligence |
Generates localized forecasts quickly and at lower costs compared to traditional models. |
_
Weather forecasting relies on a combination of observational instruments, satellites, radar, supercomputers, and AI to predict atmospheric conditions accurately.
Observational Instruments:
Meteorologists collect real-time data from ground-based weather stations, which measure temperature, humidity, air pressure, wind speed, and precipitation. Weather buoys and ships provide crucial oceanic data that influence global weather patterns, while radiosondes attached to weather balloons measure atmospheric conditions up to 20 miles high, creating a vertical profile of the atmosphere.
Automated surface-observing systems:
ASOS (automated surface observing systems) constantly monitor weather conditions on the Earth’s surface. More than 900 stations across the U.S. report data about sky conditions, surface visibility, precipitation, temperature and wind up to 12 times an hour. Nearly 10,000 volunteer NWS Cooperative Observers collect and provide us additional temperature, snowfall and rainfall data. The observational data our ASOS and volunteers collect are essential for improving forecasts and warnings.
Radiosondes:
Radiosondes are our primary source of upper-air data. At least twice per day, radiosondes are tied to weather balloons and are launched in 92 locations across the United States. In its two hour trip, the radiosonde floats to the upper stratosphere where it collects and sends back data every second about air pressure, temperature, relative humidity, wind speed and wind direction. During severe weather, we usually launch weather balloons more frequently to collect additional data about the storm environment.
Radar Technology:
Doppler radar is essential for detecting precipitation, storm rotation, wind speed, and tornado debris. With hundreds of radar towers across the U.S., it provides detailed coverage for monitoring severe weather events and issuing timely warnings.
Satellite Systems:
Satellites are a cornerstone of modern meteorology. Geostationary satellites remain fixed over a point on the equator, providing continuous real-time images of weather systems, while polar-orbiting satellites capture detailed images of the entire Earth multiple times a day. These satellites track cloud patterns, storms, and other atmospheric phenomena, enabling meteorologists to monitor and predict weather globally.
Computational Models and Supercomputers:
Collected data is processed through numerical weather prediction (NWP) models, which simulate atmospheric dynamics using complex mathematical equations. Supercomputers run these models continuously, comparing current conditions with historical data to forecast temperature, rainfall, wind, and storm development
AWIPS:
AWIPS (Advanced Weather Information Processing System) is a computer processing system that combines data from all the previous tools into a graphical interface that our forecasters use to analyze data and prepare and issue forecasts, watches, warnings. This system uses supercomputers to process data from doppler radar, radiosondes, weather satellites, ASOS, and other sources using models and forecast guidance products. After meteorologists prepare the forecasts, AWIPS generates weather graphics and hazardous weather watches and warnings. All this helps our meteorologists create more accurate forecasts and faster than ever before.
Cloud computing:
Accurate weather forecasting saves lives and protects infrastructure, but predicting complex global atmospheric patterns requires immense computing power. NOAA (National Oceanic and Atmospheric Administration) is taking a major leap forward by selecting Google Cloud as the primary provider of high-performance computing (HPC) infrastructure for its Weather and Climate Operational Supercomputing System (WCOSS).
By transitioning to Google Cloud’s H4D virtual machines, NOAA becomes one of the first major global weather centers to move operational numerical weather prediction directly to the public cloud. This migration gives meteorologists and researchers unprecedented scale, speed, and AI capabilities to run massive simulations, refine prediction models, and issue faster, life-saving early warnings.
Artificial Intelligence and Machine Learning:
AI and ML are revolutionizing weather forecasting by enhancing model accuracy and predictive capabilities. These technologies can analyze vast amounts of data, identify patterns, and improve forecasting models. AI and machine learning algorithms are increasingly integrated into forecasting. These systems analyze massive datasets, identify patterns, and refine predictions over time. AI enhances both general and hyper-local forecasts, accounting for local geography, urban heat effects, and other microclimate factors, improving accuracy and enabling timely warnings for severe weather events.
_
Comparison of Weather Forecasting Techniques:
|
Technique |
Advantages |
Limitations |
|
Observation-Based Forecasting |
High accuracy for short-term forecasts, ability to detect severe weather events |
Limited spatial coverage, dependence on weather station density |
|
Use of Weather Balloons |
Ability to collect data at different heights, high accuracy for upper-air data |
Limited spatial coverage, high cost |
|
Forecasting Based on Historical Climate Trends |
Ability to predict long-term weather patterns, low cost |
Limited ability to predict short-term weather patterns, dependence on high-quality historical data |
|
Computer-Based Models |
High accuracy for short-term and long-term forecasts, ability to predict complex weather patterns |
Dependence on high-quality input data, limited ability to predict rare or extreme weather events |
|
Satellite Imaging |
Global coverage, ability to detect weather patterns that are not visible from the surface |
Dependence on satellite technology, limited ability to detect weather patterns at night or in cloudy conditions |
|
Radar Technology |
High accuracy for precipitation forecasting, ability to detect severe weather events |
Limited spatial coverage, dependence on radar technology |
|
Ensemble Forecasting |
Ability to quantify uncertainty, ability to predict complex weather patterns |
High computational cost, dependence on high-quality input data |
|
Nowcasting |
High accuracy for short-term forecasts, ability to predict severe weather events |
Limited spatial coverage, dependence on radar and other observational data |
|
Artificial Intelligence |
Ability to analyze large datasets, ability to identify complex patterns in weather data |
Dependence on high-quality input data, limited ability to interpret results |
_______
_______
Weather Stations (vide supra):
A weather station is a facility, either on land or sea, with instruments and equipment for measuring atmospheric conditions to provide information for weather forecasts and to study the weather and climate. The measurements taken include temperature, atmospheric pressure, humidity, wind speed, wind direction, and precipitation amounts. Wind measurements are taken with as few other obstructions as possible, while temperature and humidity measurements are kept free from direct solar radiation, or insolation. Manual observations are taken at least once daily, while automated measurements are taken at least once an hour. The data collected from the weather station is used to provide accurate weather forecasts and warnings. Weather station can be found in public places such as airports, parks, schools, universities and private homes. They are typically connected to a computer or other device for collecting, processing and transmitting the readings. Weather conditions out at sea are taken by ships and buoys, which measure slightly different meteorological quantities such as sea surface temperature (SST), wave height, and wave period. Drifting weather buoys outnumber their moored versions by a significant amount.
_
A weather instrument is any device that measures weather related conditions. Since there are a variety of different weather conditions, there are a variety of different weather instruments.
Typical weather stations have the following instruments and sensors:
- Thermometer for measuring air and sea surface temperature
- Barometer for measuring atmospheric pressure
- Hygrometer for measuring humidity
- Anemometer for measuring wind speed
- Pyranometer for measuring solar radiation
- Rain gauge for measuring liquid precipitation over a set period of time.
- Wind sock for measuring general wind speed and wind direction
- Wind vane, also called a weather vane or a weathercock: it shows which way the wind is blowing.
- Evaporation pan for measuring evaporation.
In addition, at certain automated airport weather stations, additional instruments may be employed, including:
- Present weather sensor for identifying falling precipitation
- Disdrometer for measuring drop size distribution
- Transmissometer for measuring visibility
- Ceilometer for measuring cloud ceiling
Wind is measured at a height of ten meters above the ground to avoid the influence of surface friction. The weather station measures precipitation using a heated tipping bucket. This tipping bucket collects precipitation as it falls and will tip over every time it measures a certain amount (typically 1/100 of an inch). The reason the tipping bucket is heated is so that when precipitation is frozen such as snow, it will melt and the tipping bucket will still tip over with the correct amount of liquid precipitation. More sophisticated stations may also measure the ultraviolet index, leaf wetness, soil moisture, soil temperature, water temperature in ponds, lakes, creeks, or rivers, and occasionally other data.
______
______
Weather balloon and radiosonde:
To obtain information on the state of the atmosphere above Earth’s surface, meteorologists routinely use an instrument package called a radiosonde. The radiosonde, which is carried aloft by a weather balloon, measures changes in temperature, pressure, and humidity. A small radio transmitter beams these data back to a weather station, where they are recorded by computer. At an altitude of about 19 miles (30 kilometers), the balloon bursts, and a parachute carries the instrument package back to Earth’s surface.
Meteorologists use a special antenna to track a radiosonde and thereby measure wind speed and direction at different altitudes within the atmosphere. Such an observation is known as a rawinsonde. Radiosonde and rawinsonde observations are made every 12 hours.
Meteorologists sometimes use a dropwindsonde to obtain atmospheric measurements over the oceans. A dropwindsonde is a radiosonde attached to a parachute and dropped from an aircraft. As the instrument package falls toward the sea, it radios back to the aircraft measurements of temperature, pressure, and humidity.
Ships also report on weather conditions at sea. Some launch weather balloons, and others release special ocean buoys that record and transmit information about weather at sea level.
_
Weather balloons are the most direct way in which meteorologists measure the atmosphere. Weather balloons are made up of a balloon filled with either hydrogen or helium attached by a string to an instrument that measures meteorological variables such as temperature, pressure, humidity, and wind. The National Weather Service launches weather balloons twice a day at nearly 100 locations across the United States. They will often launch even more balloons ahead of hazardous weather events such as hurricanes and blizzards. Radiosondes are instrument that are carried aloft by a balloon as shown in figure below and has radio transmitting capabilities.
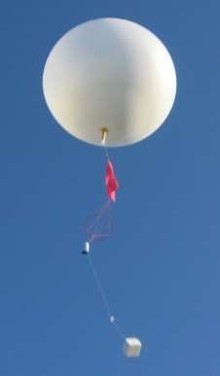
Radiosondes are launched from about 800 sites around the globe twice daily to provide a profile of the atmosphere. Radiosondes can be dropped from a balloon or airplane to make measurements as they fall. This is done to monitor storms, for example, since they are dangerous places for airplanes to fly.
_
Sounding plot:
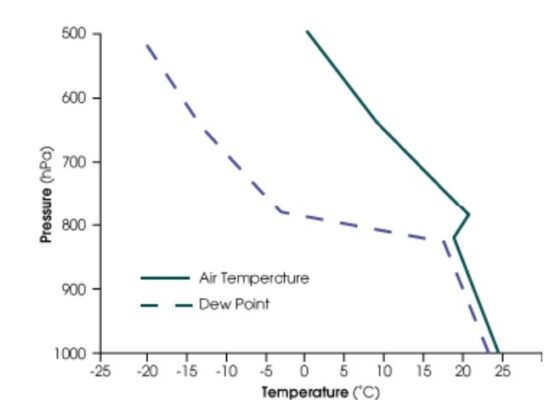
Figure above is a schematic sounding of air temperature and dewpoint derived from radiosonde data. This sample schematic sounding includes a temperature “inversion” (temperatures increasing with height) at about 800 hPa and reflects atmospheric conditions that frequently precede the development of severe thunderstorms and possibly tornadoes.
Note:
The dew point is the temperature to which air must be cooled to become completely saturated with water vapor and begin forming condensation. The dew point is always equal to or lower than the air temperature, representing the exact temperature to which air must be cooled to become fully saturated with water vapor. While air temperature measures how warm or cold the air feels, the dew point measures the actual amount of moisture (absolute humidity) in the air. A higher dew point means more water vapor is present. The difference between the air temperature and the dew point is called the “spread”. A small spread means the air is humid and close to saturation, which often leads to fog or dew. A large spread indicates dry air.
_______
_______
Weather radar:
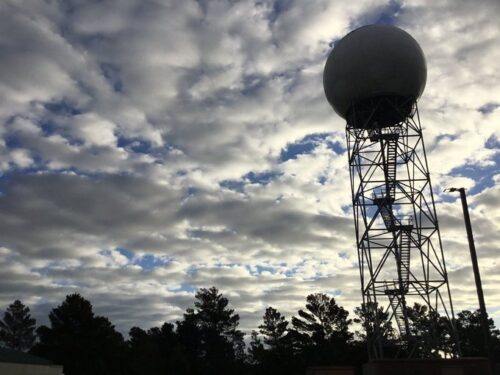
Radars (Radio Detection and Ranging) are active remote sensing systems operating at microwave wavelengths. The primary advantage of active remote sensing system or radar is that, it can take imageries during any time, whether it is daylight or night or in any weather condition whether it is cloudy or precipitating in the form of rain or snowfall. The basic principle underlying a radar is that the sensor in this transmits a microwave (radio) signal towards a target object and detects the backscattered radiation. The strength of the backscattered signal is measured to discriminate between different targets and the time delay between the transmitted and reflected signals determines the distance (or range) of the target object from the radar. There are different modes of operation of the radar, that is constant wave mode which is continuous and pulsed mode which transmits electromagnetic waves in short pulses.
_
Modern weather radars are mostly pulse-Doppler radars, capable of detecting the motion of rain droplets in addition to the intensity of the precipitation. Pulse-Doppler radars remain the technology of choice for real-time, terrestrial weather observations. The optimal range of a typical ground-based weather radar spans about 125 to 150 miles (200 to 250 kilometers). A standard weather radar scans the atmosphere vertically from near the surface up to an elevation of around 70,000 feet (approx. 21 km) using multiple tilted elevation angles. A weather radar rotates continuously in a full 360-degree circle (azimuth) while scanning at multiple upward tilt angles (elevation) to build a complete 3D picture of the atmosphere. Weather radars typically operate in the microwave frequency range between 3 GHz and 10 GHz, corresponding to wavelengths of 3 to 10 centimeters.
The specific frequency bands used depend on the application and range:
- S-band (2 to 4 GHz / ~10 cm wavelength): Used for long-range storm tracking and heavy precipitation penetration (e.g., NEXRAD systems). Requires large antennas.
- C-band (4 to 8 GHz / ~5 cm wavelength): Commonly used for regional weather monitoring and mid-range tracking, balancing antenna size and signal attenuation.
- X-band (8 to 12 GHz / ~3 cm wavelength): Used for short-range, high-resolution scans and airborne weather radars because it easily detects tiny water droplets, though it suffers from higher signal attenuation in heavy rain.
- W-band (approx. 95 GHz / 3 mm wavelength): Specialized research radar used to detect very fine particles like fog, mist, and cloud droplets.
_
Radar is the primary instrument meteorologists use to observe most of the weather systems across the world. A radar works by sending out a beam of radiation in all directions and listening for what radiation gets bounced back to the radar by things like rain, hail, clouds, etc. The radar beam is sent at a slight elevation above ground level so that farther away from the radar, the greater the height of the beam is. This elevation has the advantage of not bouncing off of objects like tall buildings and wind turbines, but the main disadvantage is that at greater distances from the radar, the lowest beam can still be several thousand feet above ground level.
_
There are two main variables which are being measured by radar: one is how much power of the beam is being returned by things like rain or other things in the path of the beam, and the second is how fast those things are moving. The amount of power returning to the radar is commonly expressed as reflectivity. This is what you often see on radar maps from broadcast meteorologists, the National Weather Service, The Weather Channel, etc. For example, the more rain and hail in a cloud that is in the path of the beam, the higher the reflectivity will be on the radar map. Thunderstorms which are producing high reflectivity values as seen on the radar are often very intense and may be creating large, solid objects like hail. How fast objects are moving is measured as velocity by the radar beam. The wave of the power returned to the radar will be slightly displaced, resulting in a phase shift of the radar beam. That phase shift (or “Doppler effect”) can be compared to the original radiation sent out by the radar to determine the velocity of the object that was intercepted by the radar beam. This method for measuring velocity is why radar is often referred to as Doppler radar. One big caveat about this velocity is that it is only measured in the direction of the radar beam itself. For example, if an object was traveling at 50 mph exactly perpendicular to the radar beam, the radar would interpret it as having a velocity of zero because it’s not moving up or down in the direction of the radar beam, i.e. it’s not getting closer to or farther away from the radar.
_
The radar can also measure many other variables through a combination of analyzing the patterns from reflectivity and velocity. For example, one of the variables that the radar is able to measure is called correlation coefficient. Correlation coefficient is a measure of how uniform the features the radar is measuring are. If correlation coefficient is high, that means that all of the different signals being returned to the radar are very similar to each other; if the correlation coefficient is low, then the different signals being returned to the radar are very different from each other. High correlation coefficient would be expected in a weak thunderstorm, which is mostly just rain. However, if a thunderstorm becomes strong enough, it may start producing hailstones, which would be moving at different speeds and in different directions than the rain droplets, and that may start to cause a drop in correlation coefficient. In fact, very low correlation coefficient that is associated with a storm that may be producing a tornado can be used to identify a possible path of debris caused by the tornado because that debris would be moving in a wildly different way than the rain and the hail around it.
_
Radar can only detect reflected energy when it is in listening mode. While radar is transmitting energy, it cannot detect reflected energy. Since radar alternates between transmitting and receiving energy, a term called the pulse repetition frequency (PRF) – defined as the rate at which the radar sends pulses. PRF is used to characterize radar. For example, a PRF of 1000 Hz, it means the radar is transmitting 1000 pulses per second, or one pulse every thousandth (0.001) of a second. The PRF has mathematical significance to reflectivity and velocity products also. Microwave energy emitted by radar has all the characteristics of waves. One of them is wavelength, defined as the distance between successive peaks or valleys in a wave. In the microwave portion of the electromagnetic spectrum, wavelengths may be varied between 1 millimetre and 1 meter. For Doppler weather radars, different wavelengths are being used like 10 centimetre (S-band), 5 centimetre (C-band), and 3 centimetre (X-band) radars. The wavelengths used for radar have major effects.
The shorter the wavelength, the smaller the particles the radar can detect. Attenuation means weakening of the beam due to energy being deflected away or absorbed by particles as the beam travels away from the radar. A practical application of this effect is when a radar beam has to travel through several intense thunderstorms, or along a line of intense thunderstorms. The beam will encounter with a very large number of raindrops as it passes through the thunderstorms. The more raindrops the beam bounces off less energy is left to travel farther to more distant storms. The product called base reflectivity displays the amount of energy that has returned to the radar. If there is less energy emitted to reflect from particles, there will be less back reflected power to the radar. This will make it seem like the thunderstorms that are farther out are less intense, in fact they may be as intense as or more intense than the storms closer to the radar.
_
Weather radar can operate in either a reflectivity mode or a velocity mode.
In the reflectivity mode, weather radar locates areas of rain or snow. The system sends out a radar signal, which consists of microwave energy pulses. If the radar signal encounters rain, snow, or hail, the falling precipitation reflects some of that signal back to the radar. The reflected radar signal, called a radar echo, appears as a blotch on a television-type screen. As the radar rotates, it generates a map of radar echoes that represents the pattern of precipitation surrounding the radar. In the reflectivity mode, weather radar can detect precipitation more than 250 miles (400 kilometers) away.
In the velocity mode, weather radar determines the circulation of air from the motion of raindrops, snowflakes, or dust particles. This radar is also known as Doppler radar because it uses the Doppler effect to calculate how the air in a weather system is moving.
The Doppler effect is the change in frequency of sound or radiation waves caused by the motion of the source of the waves relative to their observer. For example, the pitch (frequency) of a train whistle seems higher as a train approaches and lower as the train moves away. Similarly, as raindrops, snowflakes, or dust particles move through the atmosphere, the radar signals they reflect change in frequency. The radar monitors these frequency changes and then uses them to calculate the speed at which the drops, flakes, or particles are advancing or receding.
_
Doppler weather radar (DWR):
DWR scans are designed so as to suit the prevailing weather situations and data requirements.
The scan schedules are as follows:
(a) A long range single elevation scan, generally up to 500Km range, with lowest elevation angle possible is done to have general observation of the atmosphere around the radar site. Scan time maximum 2 minutes.
(b) A medium range (up to 250Km) multiple elevations scan, called a volume scan is done for detailed probing of atmosphere. Scan time maximum 9 minutes.
(c) A 10 minute temporal spaced scan strategy is to suit the periods of bad weather or expected bad weather.
The network of X-band and S-band Doppler Radars at IMD serves like a real-time scanner. These can detect rainfall, wind speed, and hailstorms up to 200 km. This is how “Nowcasting” is done: predicting sudden change in weather in the next 1 to 3 hours with high precision.
_
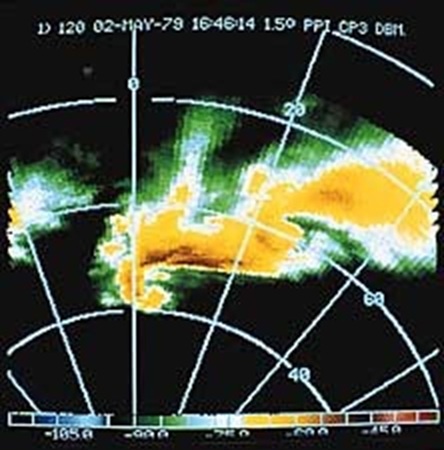
Figure above is a Doppler radar image is color-coded to indicate the speed and direction at which rain clouds and other masses of air are moving. By enabling meteorologists to monitor the motion of air in a weather system, rather than merely track areas of precipitation, Doppler radar has improved their ability to provide advance warning for severe weather. For example, meteorologists can use Doppler radar to detect the development of a tornado before it descends from its parent thunderstorm and strikes Earth’s surface. In the velocity mode, radar can detect the speed of precipitation or dust particles more than 120 miles (190 kilometers) away. A network of more than 150 Doppler radar stations across the United States called NEXRAD began operation in 1997 to improve the forecasting of severe weather.
__
Technological advancements in radar technology have gone even farther now, with new ‘dual polarization’ scans can actually provide forecasters with information about what kind of ‘hydrometeors’ are falling – raindrops, snowflakes, snow or ice pellets, or hailstones.
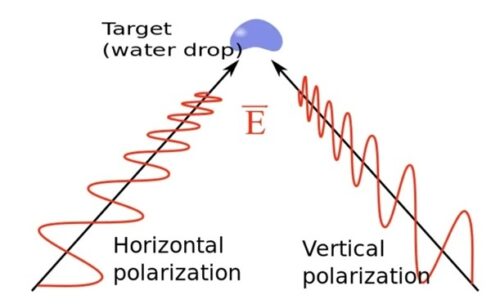
Figure above shows the combination of horizontally-polarized radio waves with vertically-polarized waves gives insight into the shape of the hydrometeor (raindrop) since the horizontal beam returns a stronger signal than the vertical beam. Spherical hail would show more uniform returns from both beams.
By scanning a hydrometeor’s width and height, they can see how large the raindrops are (since they flatten out into lenses as they grow), the size of snowflakes, and whether ice pellets or hail are falling or circulating within the clouds (since they are more spherical).
_______
_______
Weather Satellites:
A weather satellite (or meteorological satellite) is a specialized Earth-observation spacecraft used to monitor Earth’s weather, climate, and atmospheric conditions. Weather satellites play a major role in worldwide weather observation. They monitor clouds associated with weather systems, track hurricanes and other severe weather systems, measure winds in the upper atmosphere, and obtain temperature measurements.
Weather satellites offer significant advantages over the network of surface weather stations. They can observe weather over a broad and continuous field of view, whereas surface stations are widely spaced and may not observe some weather systems directly. Furthermore, satellites provide valuable data from the oceans, which cover about 70 percent of the globe. Land-based weather stations provide little information about these vast regions. Polar-orbiting satellites measure sea surface temperature (SST) by using onboard sensors to detect thermal infrared and microwave energy emitted from the top millimeter of the ocean.
_
Sensors aboard weather satellites detect two types of radiation signals coming from the planet. One signal consists of reflected sunlight. These satellite images, which resemble black-and-white photographs of the planet, reveal cloud patterns.
The second signal recorded by weather satellites is infrared radiation (IR). The intensity of the infrared radiation emitted by an object depends on the object’s temperature. For example, low clouds and fog, which are relatively warm objects, give off more intense infrared radiation than do high clouds, which are relatively cool. Thus, an IR image reveals not only cloud patterns but also cloud temperatures. Weather satellites can record IR images at any time — day or night — because objects continually emit infrared radiation.
_
Satellites are an example of passive sensing in that they can only receive what is already being emitted in terms of radiation. This is in contrast to active sensors such as radars, which send out their own beam of radiation and then listen for it to be sent back to the source. There are two types of sensors attached with satellites. One is the sounding sensor and another is the imaging sensor. An example of sounding sensor is AVHRR (Advanced Very High Resolution Radiometer) that provides useful information about thermal conditions of the atmosphere, cloud cover, water vapour etc. They are attached with polar satellites. On the other hand, the imaging sensors are attached with high altitude geosynchronous or geostationary satellites and provide information about thermal conditions and humidity conditions of the atmosphere. They are also capable of taking pictures about physical and cultural landscape of the region.
_
Satellites work by observing outgoing radiation from the Earth’s surface. Satellites can tell meteorologists whether the air is moist or dry, hot or cold, and what direction it’s moving. Most weather satellites are either in Low Earth Orbit or Geostationary Orbit.
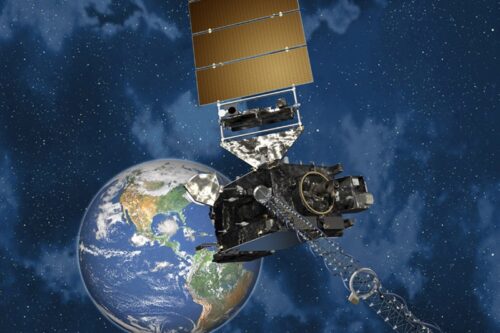
Figure above is artist depiction of the GOES-17 satellite in orbit above the Earth.
_
The main disadvantage of satellite’s passive sensors is that you can only detect what is already being emitted by the Earth and the atmosphere. This means that the visible satellite imagery is only visible during the sunlight hours, when daylight is illuminating that part of the Earth. Satellites are designed to look at other wavelengths of radiation in order to detect clouds and precipitation throughout the day and night. For example, liquid water tends to emit radiation at a very specific wavelength, which is slightly different than frozen water or ice. Some of the lightning channels take advantage of this difference in order to detect what parts of clouds are made of liquid water or ice. In addition, dry air emits radiation at a slightly different wavelength than moist air, and satellites can be tuned to detect a dry airmass in contrast a more moist airmass. These detection methods can be very important for forecasters to predict how certain weather systems will behave and evolve.
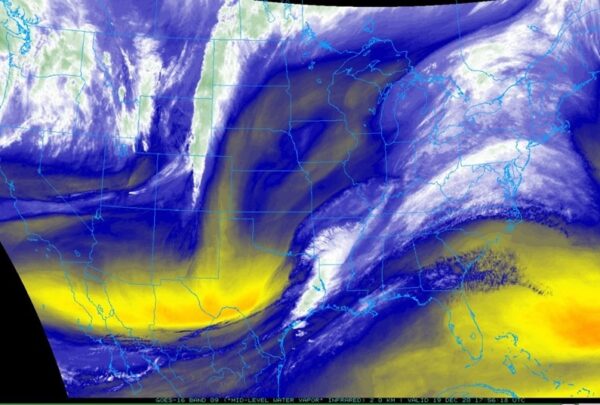
Figure above is an example of water vapor satellite imagery from GOES-16. In this image, the yellow and orange colors show dry air while the white and green colors show moist air. At this time, rain and thunderstorms were occurring in east Texas.
_
Weather satellites have been increasingly important sources of weather data since the first one was launched in 1952. Weather satellites are the best way to monitor large scale systems, such as storms. Satellites are able to record long-term changes, such as the amount of ice cover over the Arctic Ocean in September each year.
Weather satellites may observe all energy from all wavelengths in the electromagnetic spectrum. Visible light images record storms, clouds, fires, and smog. Infrared images record clouds, water and land temperatures, and features of the ocean, such as ocean currents.
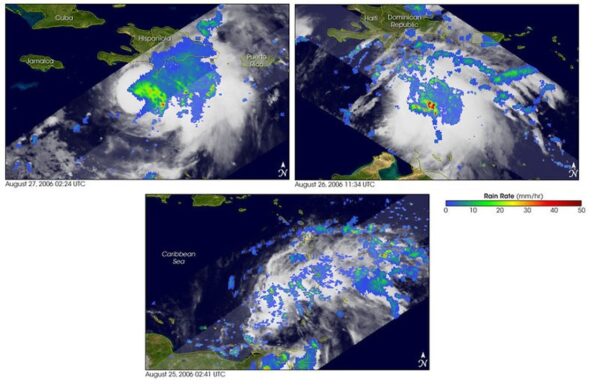
Figure above shows Infrared data superimposed on a satellite image showing rainfall patterns in Hurricane Ernesto in 2006.
______
The national oceanic and atmospheric administration (NOAA) operates three types of environmental satellites to monitor the earth’s weather.
-1. Geostationary satellites:
NOAA’s geostationary environmental operations satellite-r (goes-r) series of satellites, which orbit about 22,000 miles above earth, provide pictures of current weather conditions. Geostationary means that the satellite rotates at the same speed as the earth. This means they can collect nearly continuous images in the same area. Because they are focused on one location, they can provide up-to-date information about severe weather. This information helps forecasters understand the growth and speed of hurricanes, such as hurricanes.
In 1989, the most advanced weather imagery from space was provided by the Geostationary Operational Environmental Satellite 7, or ‘GOES-7’. It was capable of sending a full-disk image of the western hemisphere, in both visible and infrared, once every 30 minutes, and its high-resolution visible images showed us the Earth at a scale of around 1 square kilometre per pixel.
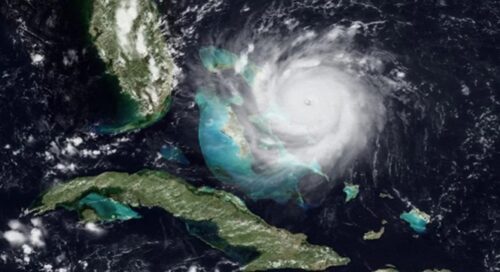
Hurricane Andrew, from 1992, imaged by GOES-7’s VISSR visible and infrared atmospheric sounder (VAS) instrument.
Through the ’90s and ’00s, newer satellites first added the ability to gather more data, at an initial cost of a slightly longer wait between receiving images, and then increased the scanning speed until we were getting full disk images of Earth, every 15 minutes.
This was state-of-the-art for geostationary weather satellites, at least over North and South America, until the new 4th generation GOES-16 and GOES-17 satellites took over in 2017 and 2018.
Each of these twin satellites now snaps images with a resolution four times better than what older satellites were capable of. This brings our weather into even sharper focus, allowing us to see details vital for severe weather forecasting. Additionally, the instruments gather so much information about weather and storms, across different temperatures and wavelengths of light, that forecasters can start to pick apart storms in a way that was really only science fiction before.
_
-2. Polar-orbiting satellite:
A polar-orbiting satellite follows a north-south path that takes it over the polar regions and operates 500 miles above earth. Because the satellite does not rotate east as Earth does, the rotation of Earth causes the satellite to pass over different areas of Earth each orbit. Polar-orbiting satellites travel at a much lower orbit than geostationary satellites, and so they record more detailed images. They slide from pole to pole 14 times a day on our planet. Because they orbit below the earth’s rotation, these satellites can see every part of the earth twice a day. Polar-orbiting satellites can monitor the entire earth’s atmosphere, clouds and oceans at high resolution. By observing these global weather patterns, polar-orbiting satellites can help meteorologists accurately predict long-term forecasts – up to seven days in the future.
_
Polar-orbiting low Earth orbit (LEO) satellites are the backbone of global weather forecasting models, providing more than 80% of the data used in numerical weather prediction models for 3-to-7-day forecasts. Some of the most impactful data come from LEO sounding instruments (“sounders”), including the Cross-track Infrared Sounder (CrIS) and the Advanced Technology Microwave Sounder (ATMS) onboard NOAA’s Joint Polar Satellite System (JPSS). These instruments measure the intensity of radiation in the atmosphere to show how temperature and moisture vary with height. These factors are important for understanding and predicting storm development.
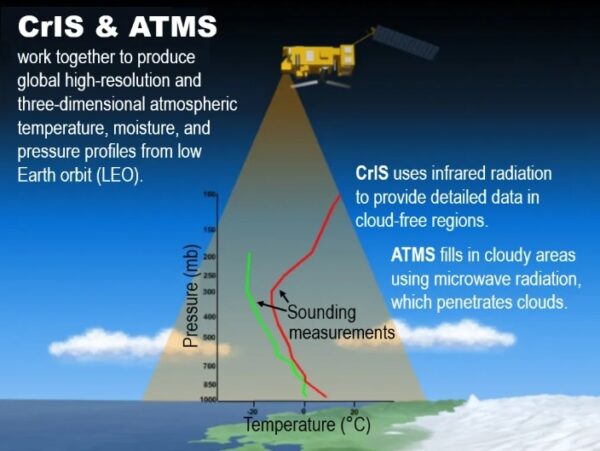
Figure above shows how CrIS and ATMS sensors measure atmospheric profiles from low Earth orbit using infrared and microwave radiation. CrIS and ATMS work together to create detailed three-dimensional profiles of atmospheric temperature and moisture. CrIS measures infrared radiation in cloud-free regions in 2,211 spectral channels. ATMS complements CrIS by measuring microwave radiation in 22 channels. Because microwave signals can pass through clouds, ATMS provides important data in cloudy areas that infrared instruments like CrIS cannot observe. For this reason, weather prediction models typically use data from both instruments.
_
-3. Deep space satellite:
NOAA’s deep space climate observatory (DSCOVR) orbits the earth for a million miles. It provides space weather warnings and forecasts, as well as monitoring the amount of solar energy the earth absorbs each day. DSCOVR also looks at ozone and aerosols in the earth’s atmosphere. These factors are important for the prediction of air quality.
_______
_______
Supercomputers:
Supercomputers process billions of data points using complex physics equations to generate accurate, real-time weather and climate forecasts.
How Supercomputers Forecast Weather:
- Data Collection: Gather live observations from radar, satellites, weather balloons, and ground stations.
- Grid Simulation: Divide the atmosphere and oceans into millions of 3D boxes.
- Numerical Crunching: Run mathematical formulas for air movement, heat, and moisture across thousands of parallel processors.
- Ensemble Runs: Execute models multiple times with tiny changes to catch probabilities and extreme risks like storms or heatwaves.
- AI Integration: Modern systems like India’s Arunika supercomputer integrate artificial intelligence models (such as GraphCast and Pangu-Weather) to compute forecasts up to 1,000 times faster than traditional physics cycles.
- Cloud Infrastructure: Agencies like the UK Met Office utilize cloud-based supercomputing-as-a-service models via Microsoft Azure to run higher-resolution simulation
As of 2016, the U.S. National Weather Service runs their weather models on supercomputers that perform 5.78 quadrillion operations per second, while Canada’s newest weather forecasting supercomputers have about half that power, running around 2.4 quadrillion operations per second. The twin supercomputers, located in Manassas, Virginia, and Phoenix, Arizona, now operate at a speed of 14.5 petaflops each, and together, the forecast system can process 29 quadrillion calculations per second.
Modern weather forecasting supercomputers operate at speeds ranging from 11 to over 60 petaflops (quadrillions of calculations per second), cutting processing times for complex global models down from 12 hours to just 4 hours.
______
______
Weather drones:
A weather drone is an unmanned aircraft equipped with sensors to measure air pressure, temperature, humidity, and wind speed in the lower atmosphere. Weather drones are specifically engineered for meteorological purposes. Operating within the Earth’s lowest atmospheric layer, known as the boundary layer, they are equipped with sensors for weather data collection, gathering key atmospheric data such as temperature, humidity, and wind conditions.
_
The boundary layer is defined as that part of the atmosphere that directly feels the effect of the earth’s surface. Its depth can range from just a few metres to several kilometres depending on the local meteorology. The boundary layer plays a critical role in regulating energy and moisture exchange between the surface and the free atmosphere. However, the boundary layer and lower atmosphere (including shallow flow features and horizontal gradients that influence local weather) are not sampled at time and space scales needed to improve mesoscale analyses that are used to drive short-term model predictions of impactful weather. These data gaps are exasperated in remote and less developed parts of the world where relatively cheap observational capabilities could help immensely. The continued development of small, weather-sensing drones, coupled with the emergence of an entirely new commercial sector focused on drone applications, has created novel opportunities for partially filling this observational gap.
_
A significant in situ observational gap resides in the lower atmosphere which encompasses the surface layer, atmospheric boundary layer, and lower free troposphere. This observational gap is most acute in remote locations and is further exacerbated in less developed regions of the world (WMO 2018). A schematic representation of this in situ observation gap is shown in Figure below.
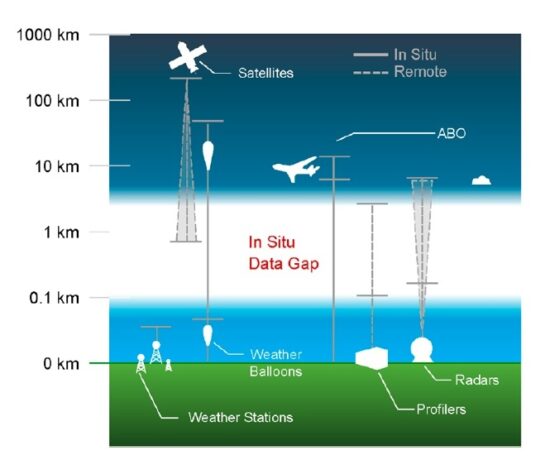
Figure above shows schematic illustrating the in situ observation gap in the lower atmosphere. Horizontal lines indicate nominal regions of primary data collection. Diagonal lines indicate changing size of foot print with distance from remote sensor. ABO refers to commercial aircraft-based observations.
_
While surface meteorological stations including airport-based observing stations and mesonets provide good spatiotemporal near-surface coverage over land areas in developed countries, radiosondes are launched just twice daily and are generally spaced over 300 km apart. Thus, radiosondes alone greatly undersample mesoscale and diurnal variability of the atmosphere. While aircraft-based observations [which may be obtained via Aircraft Meteorological Data Relay (AMDAR), Tropospheric Airborne Meteorological Data Reporting (TAMDAR), Automatic Dependent Surveillance-Broadcast (ADS-B), Mode S] can capture diurnal variations of the lower atmosphere, these observations are confined to arrival and departure ascent/descent legs at major airports and have reduced temporal coverage overnight.
_
Radar networks and satellite observations help to fill these in situ observational gaps, but these remote sensing platforms also have limitations. Doppler weather radar networks (e.g., U.S. NEXRAD) require the presence of scatterers (bugs, precipitation) for sensing velocities, provide limited thermodynamic information and have significant gaps in coverage at lower altitudes, particularly in mountainous areas. Moreover, advanced radar networks are not available in many parts of the world because they are expensive to operate and maintain. While geostationary satellites provide outstanding horizontal and temporal sampling of multichannel radiances, retrievals of thermodynamic properties of the lower atmosphere are too coarse to resolve horizontal variability important for short-term predictions and are often hindered by the presence of clouds.
_
Operational meteorologists have also pointed to the need for increased observation of the lower atmosphere to improve the accuracy of short-term (<24 h) forecast guidance. In the late 1990s, small drones began to emerge as a new system for obtaining in situ measurements within the lower atmosphere. Today’s small weather drones are nearly 100% reusable (as opposed to radiosondes of which only 20% are recovered and a smaller fraction reused), can rapidly sample the lower atmosphere, are powered with batteries that can be recharged using locally generated solar energy, and are extremely adaptable; capable of flying targeted missions or performing routine systematic profiling. Currently, readings in the near-surface atmosphere are generated through weather balloon launches that occur twice a day. With drones, forecasters will have much more access to essential data. Say a forecaster needs more information about the atmosphere because they think storms are formed, but they’re not quite sure. They can just circle that area, and a bunch of drones in that area can go out, fly, collect the data they need. It flies straight up and straight down. Gets temperature, humidity, wind and pressure. Everything the forecasters need to keep track of what’s going on and get weather warnings out.
_
Latest weather drones can now reach an altitude of 6000 metres. By continuously improving the airframe, reducing the weight of the components and using the latest battery technology, these drones can make weather forecasts even more accurate. These drones allow us to collect weather data from higher, but relevant layers of the atmosphere, by taking a transverse measurement of the atmosphere up to 6 km high. This makes it possible to take precise and direct measurements of temperature, humidity, and wind at altitudes of up to 6 kilometers, for the first time. Weather drones can also collect critical atmospheric and oceanic data from inside active hurricanes to improve intensity and track forecast. The measured data is then fed high-resolution weather models.
______
______
Several technological advances have entirely improved weather data collection and observation.
-1. Remote Sensing Technologies
Forecasters utilize remote sensing technologies to gather weather information. This enables meteorologists to help with even more specific weather predictions. There are three main remote sensing technologies that forecasters use:
- Light Detection and Ranging (LiDAR) is used for atmospheric profiling. LiDAR helps measure the time it takes for light to return to the sensor, which provides detailed information about the structure and composition of the atmosphere, such as cloud formation and particulate matter.
- Sonic Detection and Ranging (SODAR): SODAR measures wind speed. The technology uses sound waves to analyze the return signals, showing the speed and direction of wind. Forecasters use SODAR precisely to monitor severe weather events.
- Buoys: Buoys collect data on the sea surface, such as temperatures, wave heights, and currents. The National Weather Service uses oceanographic buoys the most, allowing them to understand the relationship between the atmosphere and the ocean.
Remote sensing has become one of the most valuable tools for monitoring storm development and severity. Technologies like LiDAR and SODAR provide vertical profiles of the atmosphere, enabling forecasters to detect wind shear, cloud formation, and turbulence—all of which are critical in tracking storms.
In marine environments, buoys deliver surface-level weather and climate information such as wave height, temperature, and barometric pressure. These systems help the National Weather Service and other agencies better understand the relationship between the ocean and atmosphere, improving predictions for hurricanes and coastal storms.
By combining data from these platforms with satellite observations, meteorologists can detect and analyze storm systems earlier and with greater clarity.
_
-2. AI-Driven Predictive Models
Artificial Intelligence (AI) is a game-changer.
-AI analyzes vast amounts of historical data faster than traditional methods.
-It increases the accuracy of short and long-term forecasts by recognizing intricate patterns in atmospheric data.
-AI can generate hyper-local forecasts, giving more precise predictions for specific areas.
_
-3. IoT and Weather Stations
The Internet of Things (IoT) has revolutionized many aspects of our lives, including weather monitoring.
Role of IoT in Weather Forecasting:
-Personal Weather Stations: Affordable, internet-connected weather stations allow individuals to contribute real-time data to larger networks.
-Smart City Integration: IoT devices throughout cities can provide hyper-local weather data, improving urban forecasting.
_
-4. Drones for Meteorology
Unmanned Aerial Vehicles (UAVs) or drones are becoming increasingly important in weather forecasting, especially for hard-to-reach areas.
-Storm Chasing: Drones can safely gather data from within storms, providing valuable insights into their structure and behavior.
-Atmospheric Profiling: By flying vertically, drones can create detailed profiles of temperature, humidity, and wind at different altitudes.
_
-5. 3D Wind Measuring Laser
Aerosol Wind Profiler (AWP) is an instrument to gather extremely precise measurements of wind direction, wind speed, and aerosol concentration – all crucial elements for accurate weather forecasting. Mounted to an aircraft with viewing ports underneath it, AWP emits 200 laser energy pulses per second that scatter and reflect off aerosol particles — such as pollution, dust, smoke, sea salt, and clouds — in the air. Aerosol and cloud particle movement causes the laser pulse wavelength to change, a concept known as the Doppler effect. The AWP instrument sends these pulses in two directions, oriented 90 degrees apart from each other. Combined, they create a 3D profile of wind vectors, representing both wind speed and direction.
The Aerosol Wind Profiler is able to measure wind speed and direction, but not just at one given point. Instead, we are measuring winds at different altitudes in the atmosphere simultaneously with extremely high detail and accuracy. Vectors help researchers and meteorologists understand the weather, so AWP’s measurements could significantly advance weather modeling and forecasting. A 3D wind profile can significantly improve weather forecasts, particularly for storms and hurricanes.
_________
_________
Section-10
Importance of weather forecasting:
According to the World Meteorological Organization, extreme weather, climate, and water extremes have caused an estimated 2 million deaths and $4.3 trillion in economic losses globally over the past 50 years. Weather forecasting is critical for saving lives, protecting property, and optimizing global economic operations. By providing advanced warnings for extreme events like cyclones and floods, it enables emergency responses and mass evacuations. It also empowers industries—such as agriculture, aviation, and energy—to minimize losses and improve efficiency. Weather forecasting is vital for public safety, economic planning, and daily decision-making, helping individuals and organizations prepare for and respond to changing atmospheric conditions.
_
A variety of organizations use meteorological forecasts including:
- transport services, particularly air and sea travel
- shipping and sea fishing industries and sailing organisations
- government services, e.g. firefighters or for advice on climate change policy
- armed forces
- farmers;
- public services
- mass media
- industry and retail businesses
- insurance companies
- health services
In addition to forecasting, meteorologists study the impact of weather on the environment and conduct research into weather patterns, climate change and models of weather prediction.
_
Weather disasters cost the global economy hundreds of billions of dollars each year in direct damages and up to $2 trillion annually when including wider social and ecosystem losses. Across the United States, government agencies (including the military), private industry, and private citizens consult weather analyses and forecasts to support decisions ranging from the routine (e.g., whether to hold an event) to important and urgent actions to help protect life and property when threatened by hazardous weather. Weather’s impacts are substantial and wide-reaching and occur on multiple temporal and spatial scales. Examples include the following:
- 291 billion-dollar weather and climate disasters (e.g., tornadoes, hurricanes, extreme temperatures, and floods) have occurred in the United States since 1980, including 22 billion-dollar disasters in 2020 alone. Of these billion-dollar weather and climate disasters since 1980, tropical storms and hurricanes have been the costliest, with losses totaling nearly $1 trillion.
- Excessive heat is the leading cause of weather-related fatalities, with recent peer-reviewed estimates of excess mortality ranging from 5,600 to 12,000 per year.
- As of March 2021, approximately 70% of air traffic delays are caused by adverse weather conditions. The FAA also reports an annual average of nearly 167,000 total delay hours, at a cost to airlines between $1,400 and $4,500 for each delay hour.
- High-impact weather events, including billion-dollar disasters such as the 2019 California wildfires, August 2020 Midwest derecho, and 2021 central United States cold-air outbreak, account for 90% of all large (>50,000 affected customers) U.S. power outages.
_
The importance of accurate weather forecasts cannot be over emphasized as the needs for them are always craved for in virtually every aspect of life. These forecasts can be applied in the following areas:
-1. Severe weather alerts and advisories
A major part of modern weather forecasting is the severe weather alerts and advisories, which the national weather services issue in the case that severe or hazardous weather is expected. This is done to protect life and property. Some of the most commonly known severe weather advisories are the severe thunderstorm and tornado warnings, as well as warnings about areas that are prone to flash flood. Other forms of these advisories include winter weather, high wind, heat waves, flood, tropical cyclone, and fog. Government officials use hurricane forecasts to inform evacuation decisions, declare states of emergencies, and spur the public to action in advance of the expected hazards.
-2. Air Traffic
Because the aviation industry is especially sensitive to the weather, accurate weather forecasting is essential considering the fact that a greater number of plane crashes recorded the world over have weather related causes. Just as turbulence and icing are significant in-flight hazards, thunderstorms are a major problem for all aircrafts because of severe turbulence due to their updrafts and outflow boundaries, icing due to the heavy precipitation, as well as large hail, strong winds, and lightening, all of which can cause severe damage to aircrafts in-flight. Volcanic ash is also a significant problem for aviation, as aircrafts can lose engine power with ash clouds. On a day-to-day basis, airliners are routed to take advantage of the jet stream tailwind to improve fuel efficiency. Aircrews are briefed prior to takeoff on the conditions to expect enroute and at their destination. Additionally, airports often change which runway is being used to take advantage of a headwind. This reduces the distance required for takeoff, and to eliminate potential crosswinds.
-3. Marine
Commercial and recreational use of waterways can be limited significantly by wind direction and speed, wave periodicity and heights, tides, and precipitation. These factors can each influence the safety of marine transit. Consequently, a variety of codes have been established to efficiently transmit detailed marine weather forecasts to vessel pilots through radio, for example the MAFOR (Marine forecast).
-4. Agriculture
Farmers rely on weather forecasts to decide what work to do on any particular day. For example, drying hay is only feasible in dry weather. Prolonged periods of dryness can ruin cotton, wheat, and corn crops. While crops can be ruined by drought, their dried remains can be used as a cattle feed substitute in the form of silage. Frosts and freezes play havoc with crops both during the spring and fall. For example, peach tree in full bloom can have their potential peach crop decimated by a spring freeze. Orange groves can suffer significant damage during frosts and freezes, regardless of their timing.
-5. Utility companies
Electricity and gas companies rely on weather forecasts to anticipate demand, which can be strongly affected by the weather. They use the quantity termed the degree-day to determine how strong of a use there will be for heating (heating degree day) or cooling (cooling degree day). These quantities are based on a daily average temperature of 65F (18C). Cooler temperatures force heating degree days (one per degree Fahrenheit), while warmer temperatures force cooling degree days. In winter, severe cold weather can cause a surge in demand as people turn up their heating. Similarly, in summer or dry season a surge in demand can be linked with the increased use of air conditioning systems in hot weather. By anticipating a surge in demand, utility companies can produce additional supplies of power or natural gas before the price increases, or in some circumstances, supplies are restricted through the use of brown outs and blackouts.
Power companies use forecasts of high-impact weather events such as severe thunderstorms, hurricanes, extreme heat and wildfires, and freezing rain and blizzards to deploy equipment and personnel to help restore power after the associated threats have subsided.
Water management and treatment agencies use short- to medium-range forecasts to determine if water should be released from a reservoir or treated and released from a water-treatment facility in advance of anticipated rainfall.
-6. Private Sector
Increasingly, private companies pay for weather forecasts tailored to their needs so that they can increase their profits or avoid large losses. For example, supermarket chains may change the stocks on their shelves in anticipation of different, consumer spending habits in different weather conditions. Weather forecasts can be used to invest in the commodity market, such as futures in oranges, corn, soybeans and oil. Also, members of the public use knowledge of future weather conditions to determine what to put on, on a daily basis.
-7. Military applications
Similarly to the private sector, military weather forecasters present conditions to the war fighters community. Military weather forecasters provide preflight weather briefs to pilots and provide real time resource protection services for military installations.
_______
Impact of Weather Parameters on Human Beings:
Weather significantly influences human life, shaping health outcomes, behaviors, and the functionality of essential systems such as agriculture, transportation, and public health. Parameters like temperature, humidity, wind, and precipitation interact with biological and societal factors to create both beneficial and harmful effects. As climate variability intensifies, these impacts are becoming more pronounced and unpredictable.
Weather parameters including temperature, humidity, pressure, wind, precipitation, and solar radiation— have significant effects on human health. Extreme temperatures can cause heatstroke, hypothermia, or worsen heart and respiratory conditions. High humidity increases the risk of asthma, allergies, and skin infections. Fluctuations in atmospheric pressure may trigger migraines and joint pain, while strong winds can spread allergens and pollutants, leading to respiratory issues. Heavy rainfall and flooding contribute to the spread of waterborne and vector-borne diseases like cholera and dengue. Prolonged exposure to solar and ultraviolet (UV) radiation can cause sunburn, eye damage, and increase the risk of skin cancers, despite its role in vitamin D synthesis. As climate patterns become more unpredictable, understanding these health impacts becomes essential. Effective monitoring, public awareness, and preventive strategies are critical to minimizing weather-related health risks and building climate-resilient populations.
______
______
Weather forecasting and agriculture:
Agricultural Meteorology is a branch of applied meteorology which investigates the physical conditions of the environment of growing plants or animal organisms. It is a known fact that variable weather plays a dominant role in year-to-year fluctuation in crop production; both in rain fed or irrigated agriculture. Though complete avoidance of farm losses due to weather is not possible, however losses can be minimized to a considerable extent by making adjustments, through timely agricultural operation and accurate weather forecasts.
Cool season crops: The crops which grow best in cool weather period are called cool season crops and are generally grown in winter season (November to February). Most of the cool season crops cease to grow at an average temperature of 30 to 38 ºC. These crops are also called temperate crops
Warm season crops: The important warm season crops are rice, sorghum, maize, sugarcane, pearl millet, groundnut, pigeon pea, cowpea, etc. These crops are also called tropical crops. These crops are generally grown in monsoon and some also in summer season. The cardinal temperature ranges for warm season crops are maximum temperature 45-50 ºC, minimum temperature 15-20 ºC and optimum temperature 30-38 ºC.
_
Need for Weather Forecasts for Agriculture:
Weather plays an important role in agricultural production systems through its influence on the growth, development and yields of a crop, incidence of pests and diseases, water needs and fertilizer requirements in terms of differences in nutrient mobilization due to water stresses and timeliness and effectiveness of prophylactic and cultural operations on crops. Weather aberrations may cause (i) physiological under performance by the crop plants, (ii) physical damage to crops, (iii) soil erosion and (iv) may render the agricultural inputs ineffective. The quality of crop produce during movement from field to storage and transport to market depends on weather. Bad weather may affect the quality of produce while lying in the fields/indoor storages or during transport and may adversely impact the viability and vigour of seeds and planting material during storage. There is no aspect of crop operations that is devoid of the impact of weather.
_
The importance of weather forecasting in agriculture:
-1. Enhancing Farm Output with Weather Forecasting
Weather forecasting is directly linked to increased productivity by allowing farmers to take proactive rather than reactive actions. With access to reliable forecasts, growers can better manage inputs, protect their crops, and avoid costly mistakes.
For example:
- Anticipating a heatwave gives farmers the opportunity to adjust irrigation schedules to maintain adequate soil moisture and prevent heat stress in crops.
- Expecting a heavy rainfall event might prompt the delay of planting or harvesting operations, helping to avoid soil compaction, seed washout, or spoilage of mature produce.
- Wind forecasts can influence the decision to apply or delay pesticide and herbicide spraying to reduce drift and maximize effectiveness.
These insights turn weather from a source of risk into a strategic advantage. They allow for the optimization of resources such as water, fertilizers, and labor, resulting in better yields, improved quality, and reduced environmental impact. Without accurate forecasting, farm operations become vulnerable to sudden disruptions, increasing the likelihood of crop failure, wasted inputs, and financial losses.
Weather windows—short periods of favorable conditions—can also be identified in advance for tasks like mechanical weeding, pruning, or spreading compost, ensuring operations are done efficiently and at the right time.
-2. Optimizing Crop Management
Effective crop management is deeply interwoven with weather. From the moment a seed is planted to the time a crop is harvested, each growth stage depends on specific environmental conditions. Weather forecasts provide the insight necessary to optimize decision-making at every step of the crop life cycle.
-3. Sowing and Germination
Sowing success is highly weather-dependent. Forecasts of soil temperature, surface moisture, and expected rainfall are vital to choosing the right planting window. Poor timing can have cascading effects:
- Planting in cold, wet soils can lead to low germination rates, root diseases, or slow early growth.
- Planting too late in the season may expose seedlings to heat stress or reduce the crop’s ability to reach full maturity before the end of the growing season.
Knowing the forecast helps farmers avoid these pitfalls, enabling optimal seedbed preparation and improving crop establishment.
-4. Irrigation Scheduling
Efficient water use is becoming increasingly important due to growing concerns over water scarcity and rising irrigation costs. Weather forecasts support precise irrigation scheduling by predicting rainfall, evapotranspiration rates, temperature, and wind speed—all factors that influence plant water needs.
Benefits include:
- Preventing overwatering, which can cause nutrient leaching, root rot, and increased fungal pressure.
- Avoiding underwatering, which can lead to drought stress, stunted growth, and lower yields.
- Reducing energy use for irrigation systems by avoiding unnecessary pump operation when rain is imminent.
Modern systems can even automate irrigation based on weather forecasts, increasing both efficiency and sustainability.
-5. Pest and Disease Prevention
Although insects, pathogens, mites, nematodes, weeds, vertebrates, and arthropods are different in many ways, they are regarded as pests. They are a major constraint to crop productivity and profitability around the world caused by direct and indirect damage to valuable crops. Insect pests, pathogens, and weeds account for an estimated 45% of pre- and post-harvest losses worldwide (Pimentel, 1991), in addition to losses caused by vertebrate pests (Strand, 2000).
Weather-based pest forecasting uses meteorological data like temperature, humidity, and rainfall to predict insect and disease outbreaks before they damage crops. Weather information is critical for developing pest models and decision tools that are useful for managing pest problems. It is particularly important for efficient scheduling of pesticide applications, reducing unintended consequences of chemical residues on the ecosystem, and preventing the emergence of pest resistance that follows repeated use of chemical pesticides. Weather-based pest forecasting is therefore crucial for efficient use of pesticides, the overall protection of valuable crops, crop productivity, and economic returns for the farmer.
Many crop pests and diseases are strongly influenced by weather conditions. Forecasting models can predict outbreaks based on temperature, humidity, leaf wetness, and precipitation levels.
For instance:
- Fungal diseases such as powdery mildew and downy mildew thrive in warm, moist conditions.
- Insect pests like aphids or armyworms may proliferate rapidly during specific climatic windows.
We can use weather data to forecast the timing of pest attacks. Forecasting systems have been developed for many insects. Timely forecasts enable farmers to take preventive action, such as adjusting planting dates, selecting disease-resistant varieties, or applying protective treatments ahead of high-risk periods.
-6. Harvest Timing
Harvesting is a race against time and weather. The quality and quantity of a crop at harvest can be dramatically affected by short-term weather conditions.
Forecasting helps answer critical questions:
- Will a frost event threaten sensitive crops?
- Is heavy rain likely to cause spoilage or make machinery access impossible?
- Can strong winds lead to lodging or physical crop damage?
With timely information, farmers can harvest early to preserve quality or delay harvest to avoid field damage from machinery. Additionally, forecasts support post-harvest planning by informing storage decisions, drying schedules, and transportation logistics.
__
Some Unique Aspects of Agricultural Weather Forecasts:
Weather forecasts for agriculture need to be distinct from general weather forecasts due to their applications for specialised operations/decisions. Preparation of field for sowing and sowing of crop with adequate availability of seed zone soil moisture requires copious rains. Rains that do not contribute to root zone soil moisture of standing crops are less effective and therefore need to be provided in quantitative terms. The adequacy of rainfall, for example, needs to be indicated in conjunction with evaporative power of the atmosphere which in turn requires forecasts for other weather variables such as temperature, humidity, wind and sun shine. While clear weather is required for sowing operations it must be preceded by antecedent seed zone soil moisture storage. Thus, forecasts of clear weather following a wet spell are crucial. Such forecasts of dry spells following a wet spell are also required for the initiation of disease control measures. There are areas where frequent thunderstorm activity precedes the arrival of rains associated with well-defined weather systems. In such cases the agronomic strategy should be to utilize pre-seasonal rains for land preparation and resort to dry sowings in anticipation of rain in the next few days. In temperate regions frost can cause severe menace to agricultural productivity. Frosts normally occur when the screen temperatures are 3-4 degrees Celsius above freezing temperature. Appropriate indications for such temperatures need to be given in the forecasts meant for agricultural use.
__
Numerical weather prediction (NWP) models use mathematical equations to simulate atmospheric behavior. These models can provide:
- Short-term forecasts (0–3 days): Useful for tactical decisions like spraying or harvest timing.
- Medium-range forecasts (3–10 days): Support planning of planting, irrigation, and labor scheduling.
- Seasonal forecasts (1–3 months): Inform strategic choices about crop selection, rotation planning, and input procurement.
______
______
Weather Forecasting and Business:
Accurate weather forecasting plays a crucial role in shaping business operations across various industries. By leveraging precise weather predictions, businesses can improve efficiency, reduce costs, and enhance customer satisfaction. Embracing robust forecasting systems allows businesses to minimize risk and capitalize on opportunities that arise due to shifting weather patterns. Additionally, integrating weather insights into supply chain management, staffing, and marketing strategies helps organizations respond proactively rather than reactively, ensuring smoother operations, stronger resilience, and a competitive edge in rapidly changing markets.
_
Businesses strive to maintain timeliness in deliveries, and accurate weather forecasting plays a pivotal role in achieving this goal. By predicting weather events, companies can reroute deliveries to avoid adverse conditions, ensuring goods reach their destinations on time. For instance, during heavy snowfalls or rainstorms, delivery paths can be altered to prevent delays and minimize fuel consumption. Moreover, advanced algorithms that integrate weather data enable logistic teams to plan more reliable and cost-effective routes. This not only leads to financial savings but also bolsters customer satisfaction by meeting delivery commitments.
_
Weather forecasts play a significant role in inventory management, especially for businesses dealing with seasonal products. Predictive analytics help retailers anticipate changes in consumer demand based on weather conditions, allowing for optimal stock levels. For instance, an impending heatwave might signal increased demand for cooling products, prompting businesses to adjust their inventory accordingly. This proactive approach minimizes wastage and reduces storage costs by aligning stock levels with anticipated market needs. Ultimately, integrating weather data into inventory strategies enhances responsiveness and financial performance.
_
Weather conditions greatly influence cold chain logistics, which require precise temperature control to maintain product integrity. Accurate weather forecasting guides the transportation of perishable goods by identifying the best times for shipment to prevent spoilage. Businesses can plan their logistics to ensure optimal conditions throughout transit, reducing the risk of temperature-sensitive items deteriorating. This is particularly crucial for the pharmaceutical and food industries, where product quality is paramount. By integrating weather data, companies uphold the quality of goods while minimizing spoilage costs.
_______
_______
Wind energy forecasting:
Wind forecasting for renewable energy is the prediction of future wind speeds and power output to help operators manage power grids and electricity markets efficiently. Wind energy forecasting is defined as the process of predicting wind power generation over short-term periods (hours to days) using methods such as NWP, ensemble and machine learning forecasting, which improves energy market efficiency and system reliability.
_
In response to the increased global energy demand, intensified energy crisis and accelerated climate change, the share of renewable energy is growing exponentially in global energy market. As a promising resource with abundant reserves and wide distribution, wind energy has attracted lots of attention both in academic research and in industrial applications. However, the inherent weather-dependent instability of wind resource would adversely affect the security and reliability of the power grid. Because large-scale electricity storage is still costly, effective wind energy prediction is essential to facilitate wind power grid integration, further promoting the development of wind energy applications. So far, numerous models for wind forecasting have been proposed, serving different purpose. It should be noted that the wind forecasting includes both wind speed prediction and wind power prediction.
_
Although wind forecasting methods can be classified in terms of forecast horizon, spatial scale, step size, and optimization objective, these criteria are sometimes overlapping and thus fail to systematically subdivide the existing prediction models. Therefore, based on the nature of predictive algorithms, the forecasting methods are most widely classified as deterministic and probabilistic forecasting methods. The deterministic forecasting methods are those who output predicted deterministic point values corresponding for varies forecast horizons and spatial scale, whereas probabilistic forecasting method can obtain the upper and lower boundaries of wind energy in the form of probability density or probability interval, which in turn can provide supplemental information related to wind fluctuations to decision-maker.
______
______
Weather forecasting and power outages:
A forecast high of 102°F versus 105°F may seem trivial to an average consumer checking the weather. For an enterprise operator managing real-time demand across a power grid, that tiny three-degree variance changes everything. It dictates load forecasting, alters grid-balancing operations, and significantly elevates localized outage risks. Because ambient environmental conditions impact everything from renewable energy thresholds to crew mobilization and physical restoration timelines, modern utilities can no longer afford to simply consume basic weather data — they must actively operationalize weather intelligence. By treating precision forecasting as a core asset, utilities can effectively bridge the gap between grid resilience and community expectations.
_
Weather-related power outages are disruptions to the electrical grid caused by environmental conditions like storms, high winds, and extreme heat that damage exposed power lines and electrical equipment. NOAA data reveals that billion-dollar extreme weather events are occurring roughly three times more frequently than in the 1980s, placing unprecedented pressure on grid reliability forecasting and distribution outage response planning. That pressure is increasingly visible across daily operations. Weather-related events caused 80% of major U.S. power outages reported between 2000 and 2023, with outages occurring twice as often over the last decade compared to the early 2000s. Additionally, the average annual number of weather-related power outages has increased by nearly 80% since 2011.
Key drivers of weather-related disruptions:
- Severe weather (58%): High winds, heavy rain, and severe thunderstorms cause the majority of disruptions.
- Winter weather (23%): Snow, ice, and freezing rain cause prolonged physical grid strain.
- Tropical cyclones (14%): Hurricanes drive some of the longest-lasting regional outages nationwide.
To mitigate these risks, The Weather Company delivers actionable insights through an integrated ecosystem of Weather Data APIs, Forecasts on Demand™ (FOD) technology, and a centralized briefing desk model. Together, these capabilities can help utilities move past static, reactive forecasts to protect power grid reliability proactively.
Grid reliability forecasting requires more than a single deterministic forecast value. Operators need to visualize the full spectrum of possible outcomes associated with an approaching weather front. This is why probabilistic forecasting has become essential. Rather than relying on a single baseline metric, utilities evaluate multiple simulated scenarios to calculate statistical likelihoods. Instead of treating weather forecasts as a single number, treat forecasts as a probability distribution. By thinking in terms of probability, an operator shifts from asking ‘what will happen?’ to asking ‘what do I need to be ready for, and at what cost?’. That turns weather uncertainty into a risk management problem – which grid operators are well equipped to solve.
_______
_______
Section-11
Accuracy in weather forecasting:
Weather impacts nearly every aspect of our daily lives, from what we should wear, whether we should hold events indoors or outdoors, how we commute to work, and even our health. Weather also has an impact on how businesses operate, such as when farmers should plant or harvest crops, how airlines schedule flights, and how retailers manage inventory. In the four years, the United States alone saw a total of 93 individual billion-plus-dollar weather and climate disasters (20 in 2021, 18 in 2022, 28 in 2023, and 27 in 2024). Prior to 2020, the most for a single year was 16.
_
As extreme weather events become more common, people and businesses rely on weather forecast accuracy more than ever to try to mitigate losses, influence safety measures, increase productivity, and improve business-related decisions. If weather forecasts are not accurate, the risks to life and property increase, and the perception of forecasting value decreases. It is also imperative for weather forecast providers themselves to evaluate the accuracy of past forecasts to identify areas for which improvement is needed. In a world where the weather is constantly changing and reaction time may be limited, precision forecasting can make all the difference.
Weather forecast accuracy is necessary but not enough. The most accurate forecast means nothing if it doesn’t aid decision making. A highly accurate forecast has no value on its own. Its value is created only when it changes what you do. Translating weather forecast accuracy into context-aware, decision-ready intelligence for your specific activity, location, and moment is where real value is created.
_
Why are reliable weather forecasts important?
In 2024 alone, there were more than 150 unprecedented climate disasters globally, and $182.7 billion in U.S. weather-related damages – the fourth-highest year on record. As extreme weather events become more common, people and businesses rely on weather forecast accuracy more than ever to try to mitigate losses, influence safety measures, increase productivity, and improve business-related decisions.
It’s this critical need that underscores why accurate weather forecasting helps instil confidence, drive informed decisions, and propel the world forward. From rerouting flights to adjusting supply chains, better forecasts reduce risk and support operational confidence.
_
Impacts of Forecasting Errors:
Forecasting errors can have significant impacts on various industries and aspects of our lives. Inaccurate forecasts can lead to economic losses, risks to public safety and health, and consequences for industries reliant on weather forecasts.
- Economic Losses due to Inaccurate Forecasts:
Inaccurate forecasts can lead to significant economic losses, particularly in industries such as agriculture, aviation, and construction. For example, a study by the National Oceanic and Atmospheric Administration (NOAA) found that weather-related disasters cost the US economy over $300 billion between 2015 and 2019 1.
- Risks to Public Safety and Health:
Inaccurate forecasts can also pose risks to public safety and health. For example, failing to predict a severe weather event can lead to loss of life and property damage. A study by the World Meteorological Organization (WMO) found that weather-related disasters resulted in over 600,000 deaths between 1970 and 2019.
- Consequences for Industries Reliant on Weather Forecasts:
Many industries rely on weather forecasts to inform their operations. Inaccurate forecasts can have significant consequences for these industries, including disruptions to supply chains, impacts on crop yields, and changes to consumer behavior.
__
Benefits of accurate weather forecasting:
Weather affects nearly every sector — from supply chains and staffing to safety and customer engagement. It impacts an estimated $3 trillion of the U.S. economy annually and influences 30% of global GDP. Even a 1ºC temperature shift can cause a 1.2% swing in consumer spending.
Simply, better accuracy means better decisions. Accurate weather forecasting can deliver measurable value across industries:
- Aviation: For airlines, accurate forecasts are crucial for planning routes, minimizing delays, and enhancing safety. Weather is responsible for nearly 75% of flight delays, highlighting the importance of accurate, proactive forecasting for keeping flights on schedule and passengers safe. Turbulence prediction, wind shear detection, and runway condition forecasts enable flight crews to make informed decisions that protect passengers and optimize fuel consumption.
- Advertising: Weather impacts consumer behavior, and accurate forecasts enable brands to align their messaging with what people are experiencing in the moment.
- Media: Reliable forecasts built into broadcast media solutions keep viewers informed and engaged. Localized, timely forecasts build trust, improve viewer retention, and support higher ad revenue. Broadcasters can promote their accuracy, backed by The Weather Company, as a differentiator in competitive media markets.
- Government & defense: From storm response to mission planning, government and defense agencies rely on accurate forecasts for operational readiness. Whether preparing for hurricanes or managing logistics during winter storms, accurate data helps leaders act decisively and allocate resources efficiently.
______
______
What is accurate weather forecasting?
The accuracy of a weather forecast is a measure of how closely predicted weather conditions match actual recorded reality. An accurate weather forecast is a measure of how closely the forecast matches reality. To produce an accurate forecast, scientists combine complex data analysis, modeling, and human expertise. Forecasts can range from short-term to long-range predictions, each with varying degrees of accuracy. Accurate weather forecasting combines real-time data, advanced models, and expert interpretation. High-resolution models, such as GRAF®, multi-model ensembles like WxMix, and new AI methodologies are transforming forecast precision on a global scale.
Short-range weather forecasts:
Short-range forecasts (1–14 days) are typically generated by physics-driven models that ingest global weather data and simulate outcomes using advanced techniques, with AI increasingly contributing to the precision of these forecasts within this timeframe. These are considered more reliable due to their frequent model updates and high-resolution input data.
Long-range weather forecasts:
Long-range forecasts (15+ days) are largely based on historical data and pattern recognition to predict what’s ahead. Forecasts beyond 15 days are inherently less precise because of how rapidly the atmosphere can change. This means accuracy is likely to decrease the further out the forecast goes.
How reliable are weather forecasts?
The answer largely depends on the forecast range. Generally, short-term forecasts demonstrate high accuracy:
- A 7-day forecast can accurately predict the weather about 80% of the time.
- A five-day forecast can accurately predict the weather approximately 90% of the time.
Accuracy drops as the forecast range increases, but advanced models and AI can help improve even long-range predictions.
__
There is a misconception that weather forecasts are inaccurate, but meteorology has improved a lot in recent decades. For example, 5-day forecasts from NOAA now have 90% accuracy.
- Time is one of the main factors that limits accuracy: as the timeframe for a weather forecast is increased, accuracy is lost. In the case of NOAA, if the forecast is increased from 5 to 10 days, the accuracy drops to 50%.
- Accuracy also depends on what aspect of the weather you are trying to predict. For example, hurricanes can be forecast several days in advance, but thunderstorms have only been predicted successfully a few hours before they occur.
- Construction companies can use weather forecasts to plan short-term operations. To compensate for the accuracy limitations of forecasts, they can use direct weather monitoring at project sites.
When dealing with hurricanes, predicting the landfall location is key to prevent damage. Modern weather science can calculate landfall locations within 220 miles, five days in advance. For a 24-hour forecast, the accuracy improves to 47 miles.
______
Forecast Horizons and Reliability:
Timeframe Typical Accuracy Primary Constraint
0–24 Hours High Local convective shifts and sudden radar-undetectable cells
1–7 Days Moderate to High Small errors compounding in regional pressure systems
14+ Days Low to None Total loss of initial condition memory due to chaotic dispersion
- Reliable predictions typically extend from 7 to 10 days.
- In best-case scenarios, forecasts can be made up to 14 days in advance, but accuracy diminishes significantly beyond this range.
As detailed by the European Centre for Medium-Range Weather Forecasts, advancing computing power and machine learning continue to refine short-range models, but the fundamental chaotic nature of the atmosphere imposes a hard ceiling on predictive horizon.
________
Table below shows Comparative Analysis of Forecasting method’s accuracy:
|
Duration/Model |
Persistence |
Physical |
Statistical |
Hybrid |
|
Very Short Term (0-6 hour) |
Good |
Poor |
Good |
Good |
|
Short Term (6 Hour to -1months) |
Average |
Good |
Good |
Good |
|
Medium term (1 months to 1 year) |
Poor |
Average |
Good |
Good |
|
Long Term (1 year to up) |
Very Poor |
Average |
Poor |
Very Good |
When it comes persistence model in picture, its accuracy decreases with the time horizon and is generally not adequate for more than 1 h. An improved version of this model is the scaled persistence model. The so-called naïve predictions of persistence models are sufficiently accurate for very short-term prediction horizons. The “hybrid modeling” (ANFIS system)-based method is one of the extremely short-term forecasting techniques examined. For a 5 to 15 minute forward period, it offers a noticeable improvement over the persistence strategy.
_
Physical models frequently perform satisfactorily for long-term prediction (more than 6 hours in the future), but due to the difficulties of information acquisition and complex computation, they are unsuitable for short-term prediction (a few minutes to an hour) alone. There are several different strategies available for short-term forecasting. When used for various time periods, the capabilities of time-series models—the majority of which are ARMA-based—differ. These are typically replaced by alternative methods like NNs and hybrid strategies. Incorporating numerous variables, hybridizing alternative time-series models, or using modern techniques like wavelet transforms, generalized projection, or Bayesian estimation to combine time-series models have all produced promising results. Using NNs in combination with other techniques results in very accurate forecasts.
Since medium range and long-range forecasting employ relatively similar strategies, their respective methods have been evaluated together. Simple models are not able to be as accurate over extended periods of time as they do for short term forecasting, since they produce the best results for these time-scales, NWP and hybrid NWP models are therefore commonly used. In hybrid NWPs, forecasting data from NWPs is provided as input along with generating data from utilities to NN or fuzzy structures or other hybrid structures like ANFIS or their combination with other statistical time-series approaches, which provide good downscaling and forecasting.
Significant findings for these periods include the use of non-Gaussian error distribution functions and entropy-based standards for assessing NN training effectiveness.
______
When is a forecast reliable?
The reliability levels are explained as follows:
- A reliability of under 30% is considered to be low. The predicted weather type is the most probable of all possible weather scenarios. However, when planning weather-dependent activities, reliance on this forecast is not recommended. It is recommended that you consult later forecasts.
- A reliability of between 30% and 70% is considered to be average. The forecast may serve as a basis for planning, but you should also prepare for alternative weather.
- A reliability greater than 70% is considered high. This forecast can be taken at its word. However, surprises are always possible.
Even a 70% Accurate Forecast is valuable. Forecasts do not need to be perfect to be useful. Even partially accurate forecasts help users manage risk. Farmers can delay fertiliser application if heavy rainfall is expected. Disaster management agencies can evacuate vulnerable communities ahead of cyclones. Energy companies can prepare for increased electricity demand during heatwaves. In this way, forecasts function as risk-management tools, helping societies make better decisions despite uncertainty. For forecasts to truly support decision-making, however, they must reach people in a timely and understandable form.
______
The world’s most accurate forecaster:
Many claim it, but only one forecaster can prove it: The Weather Company is the world’s most accurate forecaster. According to ForecastWatch, the premier organization for evaluating weather forecast accuracy, The Weather Company consistently leads the industry. ForecastWatch’s 2021-2024 global forecast accuracy study found The Weather Company to be the world’s most accurate forecaster during that period. The Weather Company operates The Weather Channel app, which is available on iOS and Android devices. It provides live local forecasts, severe weather alerts, interactive radar maps, and health insights like air quality and allergy trackers. Company officials cited investments in artificial intelligence technology and advanced forecasting as key to helping people and businesses make more informed weather decisions.
AccuWeather is also recognized in independent studies for temperature accuracy and long-range predictions. It is highly regarded for its patented “RealFeel” index and minute-by-minute local precipitation forecasts.
______
How accurate are IMD monsoon Predictions:
The Indian Meteorological Department (IMD) has recently faced controversy and criticism regarding its monsoon predictions. Many believe that the IMD is not as efficient as its counterparts in Western countries, and social media has been filled with jokes about the accuracy of IMD forecasts. While these are valid concerns, the IMD has clarified that its predictions are the best under the given circumstances. According to data gathered by the Data Intelligence Unit (DIU) of India Today spanning 20 years, IMD’s seasonal monsoon predictions have often been inaccurate.
The Indian monsoon is a complicated weather phenomenon which depends on multiple factors influencing each other to strike a fine balance. To assess monsoon behaviour in India, experts study four major factors:
- The first is the analysis of El Nino and La Nina conditions – which are two phases of the El Nino Southern Oscillation (ENSO) phenomenon in the equatorial Pacific Ocean. El Nino is characterised by warmer temperatures, while La Nina refers to a cooling period.
- The second factor is the Indian Ocean Dipole (IOD), a climate pattern that affects the Indian Ocean.
- The third factor is the assessment of snowfall in the Eurasian region. A favourable IOD and less snowfall in Eurasia indicate a greater possibility of a favourable monsoon in India.
- The fourth factor is Himalayas block freezing Central Asian winds and trap moisture-laden monsoon winds, creating the ideal temperature differences and pressure gradients needed for strong monsoon rainfall.
_
While the predictions have marginally improved in the last five years, they still require further enhancement. Predicting weather developments relies heavily on data collected by specialised equipment such as Doppler radars, satellite data, radiosondes, and surface observation centres. India lags behind advanced countries in Europe and America in these areas. However, experts argue that comparing the accuracy of weather forecasts across countries is not meaningful since India’s tropical climate and diverse geographical features make weather prediction more challenging. Factors like the climate crisis, landmass, coastal regions, and local weather phenomena further complicate the accuracy of forecasts in India.
______
How forecasters track forecast accuracy:
With all of the knowledge of the atmosphere and sophisticated computer modeling tools that have been developed, just how good are weather forecasts? Well, for starters, we have to set some expectations on what exactly is a “good” forecast. If your idea of a “good” forecast is that every single aspect of the weather forecast is perfect (everything is timed to the exact minute, temperatures are exactly right, etc.), then by those unrealistic standards, all weather forecasts are wrong in some way. A forecast for the exact landfall location of a hurricane a week into the future, for example, is unlikely to be exactly correct. But, most weather forecasts, when properly expressed and communicated, are accurate enough to be useful.
There are a couple of definitions that describe some common ways that forecasters track forecast accuracy:
- absolute error tells us about the size of the forecast error based on the difference between the forecast conditions and what actually happens. Using temperature as an example, note that absolute error does not tell you whether the forecast was warmer or cooler than what actually happened; it only tells you about the size of the error. In other words, a forecast that is 5 degrees Fahrenheit too high would have the same absolute error as a forecast that is 5 degrees Fahrenheit too low.
- skill compared to climatology: Forecast skill compared to climatology measures how much better a weather or climate prediction is than simply guessing using long-term historical averages. Forecasts that have “skill” are more accurate than a generic “climatology” forecast of 30-year normal conditions. If the forecast is less accurate than using a forecast of climatological normals, then the forecast has no skill and is essentially useless.
_
Temperature forecasts are often reasonably accurate (have absolute errors of 3 degrees Fahrenheit or less) a couple of days into the future, but the further into the future the forecast goes, generally the less accurate it will be. In other words, if you see a weather forecast for a high of 85 degrees Fahrenheit tomorrow, much more often than not, the actual high will be within a few degrees of that. But, as time goes on, accuracy suffers. If you see a forecast for a high temperature of 85 degrees Fahrenheit on a day a few weeks into the future, the absolute error is likely to be much larger (possibly 10 degrees Fahrenheit or more). Based on what you learned about forecast errors growing in time in computer models, it should come as no surprise that specific forecasts eventually become erroneous to the point where the forecasts are no longer useful. For this reason, for longer-range forecasts (say, more than a week into the future) meteorologists often evaluate forecast quality based on skill compared to climatology instead of absolute errors.
_______
The quality of the forecasts:
The quality of the numerical weather forecasts varies according to the parameter considered and the lead-time. At short notice the temperature is generally predicted with an error not exceeding a few degrees, and the wind with an error not exceeding a few metres per second, except in stormy areas. For rainfall, especially thunderstorms, this level of quality is not reached, as small errors on previous quantities result in larger errors on rainfall.
Precisely predicting the precise location of a storm and the amount of rainfall associated with it or the risk of hail remains extremely difficult, even a few hours in advance. The same is true for the amount of snow in winter, especially when the temperature is close to 0°C on the ground, and a small temperature error can lead to an error in the nature of precipitation (rain or snow). This is also the case for fog, which remains very difficult to predict, even a few hours in advance, because its formation depends on the humidity, which is very variable. For tornadoes, only a risk of occurrence should be indicated.
On the other hand, the forecasting of severe winter storms such as Xynthia (night of 27-28 February 2010) has made great progress, the risk can now be indicated 72 to 120 hours in advance, and on the basis of very accurate forecasts made 24 to 48 hours in advance, public authorities can take the necessary measures to protect people and property (closure of certain traffic routes, cancellation of outdoor events, etc.). The same applies to the beginning and end of cold waves or heat waves, which are now planned several days in advance, with very correct reliability as seen in figure below.
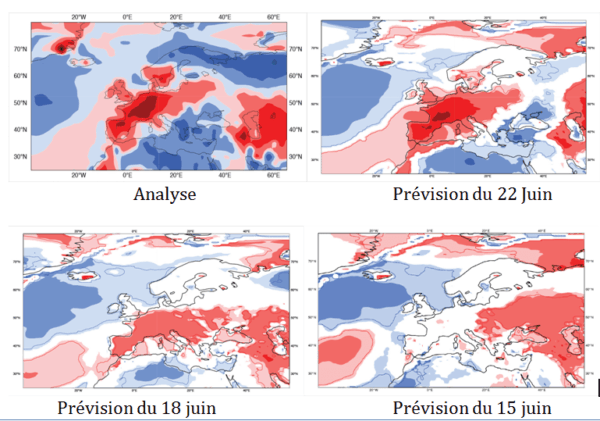
Figure above shows forecast of the heat wave at the beginning of July 2015 using the ECMWF model. This major event was observed between 29 June and 7 July, with temperature records broken in several European countries. The figures show the average temperature anomaly over the week in question (+10°C for dark red), as observed (Analysis), and predicted on June 22, June 18, and June 15. It can be seen that the first forecast giving a relevant indication was issued 11 days before the start of the event (June 18).
_
Floods are quite predictable in slow-dynamic river basins, where floods develop in several hours, but almost unpredictable in small basins with rapid dynamics, which can react in a few tens of minutes to heavy storm rain (for example the disaster of 3 October 2015 in Cannes). Improving the forecasting of flash flood risks in the Mediterranean regions is therefore one of the most important objectives of Météo-France (see figure below). This will probably require the development of ensemble forecasts to characterize the probability that precipitation will exceed certain critical thresholds in the following hours.
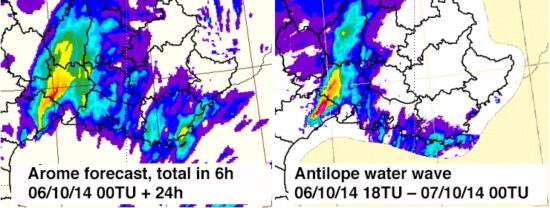
Figure above shows the state of the art of intense rainfall forecasting in the Mediterranean arc (so-called “Cévennes” episodes): on October 6, 2014, 260mm were recorded in 6 hours in Prades-le-Lèz in Hérault. On the left, forecast of rain accumulation between 18hTU and 24hTU by the AROME model of Météo-France (from the initial state of 00hTU) compared on the right to the cumulations observed by weather radars and rain gauges for the same time slot. The forecast was sufficiently relevant for “orange – flood and rain” vigilance to be declared (appropriately) for the departments of Hérault and Gard, however the model underestimated the maximum rain intensity, and gave a position slightly shifted to the northeast of the maximum rainfall.
The quality of the forecasts with monthly to seasonal lead-times is still very modest. In tropical regions, some phenomena such as El Niño are predictable several months in advance. On the other hand, in Europe, it is still impossible to predict the temperature more than a few weeks in advance.
______
______
Variability of weather forecast: Shifting Predictions:
Weather forecasts are valuable tools for planning outdoor activities, making travel arrangements, and preparing for changing weather conditions. However, weather forecasts are not always set in stone, and they can change within a relatively short timeframe.
_
Factors Influencing Weather Forecast Variability:
- Atmospheric Dynamics: Weather patterns are influenced by complex interactions between air masses, pressure systems, and other atmospheric phenomena. Small changes in these dynamics can lead to significant variations in weather conditions.
- Frontal Systems: The movement and intensity of cold fronts, warm fronts, and stationary fronts can affect local weather conditions and contribute to forecast uncertainty.
- Temperature Gradients: Variations in temperature gradients can lead to the development of convective processes such as thunderstorms, which can produce rapid changes in weather conditions.
- Topography: Local geography, elevation, and terrain features can influence weather patterns and contribute to microclimates, leading to localized forecast variability.
_
Sources of Forecast Uncertainty:
- Model Variability: Numerical weather prediction models use mathematical algorithms to simulate atmospheric processes and predict future weather conditions. However, different models may produce varying forecast outcomes due to differences in model physics, initialization, and resolution.
- Data Limitations: Weather forecasts rely on observational data from weather stations, satellites, and other sources. Incomplete or inaccurate data can lead to forecast errors and uncertainty.
- Chaos Theory: Weather is inherently chaotic, meaning that small changes in initial conditions can lead to significant differences in forecast outcomes over time. This sensitivity to initial conditions contributes to forecast uncertainty, especially for longer time horizons.
_
Variability due to different models:
With many different agencies worldwide offering forecasting services, typically mainly for a region or country, many different models have been developed and each requires their own set of observational data as initial conditions from which to extrapolate the forecast. While forecasts are shown as singular entities, the reality is far more complex.
Figure below shows an example of the “Spaghetti Lines” averaged to form a forecast.
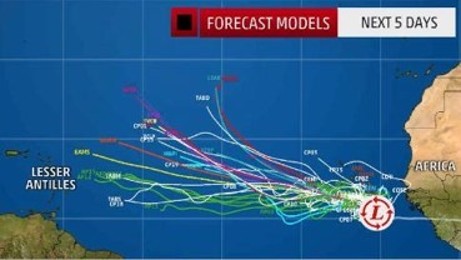
In Figure above, each line is labeled with the name of a different forecast model and shows the low pressure system path over five days. For storms like hurricanes, typically this is shown as a cone representing where the storm center is expected to be over time. This complexity shows that each model has biases based on what physics was included as well as the initial data and the model initialization parameters. In some cases, these parameters may include a pseudorandom number seed to offer a less rigidly fixed model. Over a series of runs, this variability can offer a better model in aggregate as it shows many more possible outcomes enabling forming a consensus averaged in some way from all of the forecast model runs. A combination of both numerical averaging tools as well as forecaster experience will generate the final predictions.
As should be expected based on the above information, not all models and not all parts of the world for each model will generate the same quality forecasts. Initial condition observations are a significant consideration.
_
Note:
What does the forecast cone mean?
The cone represents the most probable track of the center of a tropical depression, storm or hurricane over the next five days, assuming the storm lasts that long. The cone of uncertainty represents the margin of error. The cone of uncertainty shows the probable track of the centre of a tropical cyclone. It’s essentially the margin of error in a storm’s official track forecast.
_
Weather forecasts are valuable tools for planning and decision-making, but they are subject to variability and uncertainty. While weather forecasts can change within a 24-hour period due to factors such as atmospheric dynamics, frontal systems, and temperature gradients, meteorologists continually update forecasts to provide timely and accurate information to the public. By understanding the factors influencing forecast variability and staying informed about short-term forecast updates, you can make informed decisions and adapt plans in response to changing weather conditions effectively.
______
______
Causes of inaccurate weather forecasting:
Weather forecasting is a complex and challenging task that involves the use of sophisticated software and computational models to predict atmospheric conditions. While weather forecasts have improved significantly over the years, there are still several factors that contribute to inaccuracies in predictions. Here is a detailed analysis of some key reasons why weather forecasts can be wrong:
-1. Complexity of the Atmosphere
The Earth’s atmosphere is a highly dynamic and chaotic system with numerous interacting components, such as air pressure, temperature, humidity, and wind patterns. Predicting the behavior of these elements accurately is challenging due to the inherent complexity and non-linear nature of atmospheric processes.
-2. Modeling Limitations
Weather forecasting relies on numerical weather prediction (NWP) models that simulate the atmosphere’s behavior based on mathematical equations. However, these models have limitations in representing small-scale features, such as local wind patterns, precipitation, and atmospheric turbulence. Improving the resolution of models is computationally demanding and can be limited by available resources.
-3. Data Assimilation Challenges
Weather models heavily depend on accurate and timely observational data. Gaps or inaccuracies in data, especially in remote or less-monitored areas, can lead to errors in predictions. Incorporating real-time observational data into the models through data assimilation techniques is a complex task and introduces uncertainties.
-4. Parameterization of Processes
Many atmospheric processes occur at scales smaller than the resolution of global or regional weather models. These processes, such as cloud formation, convection, and turbulence, are often parameterized or approximated in models. The accuracy of these parameterizations can affect the overall forecast quality.
-5. Initial Condition Sensitivity
Small errors in the initial conditions used to start the models can amplify over time, leading to significant deviations from the actual atmospheric state. This sensitivity to initial conditions is a characteristic of chaotic systems, as even tiny discrepancies can result in vastly different outcomes.
-6. Uncertainties in Boundary Conditions
The behavior of the atmosphere is influenced by various factors, including interactions with the oceans, land surfaces, and ice. Uncertainties in predicting these boundary conditions, such as sea surface temperatures, land cover changes, and ice melt, contribute to inaccuracies in weather forecasts.
-7. Limited Observational Coverage
Some regions, such as the open ocean or remote areas, have limited observational coverage. Lack of data from these regions can lead to uncertainties in predicting global weather patterns, affecting the accuracy of forecasts.
-8. Advancements in Technology
While technology has significantly improved weather forecasting, rapid advancements may introduce new challenges. Upgrading models, assimilating new types of data, and adapting to evolving computational capabilities require careful validation and testing to ensure accuracy.
-9. Extreme Events and Nonlinearities
Extreme weather events, such as hurricanes, tornadoes, or heatwaves, involve highly nonlinear processes that are challenging to predict accurately. Slight variations in the initial conditions or model parameters can lead to large differences in outcomes for these events.
-10. Distance From Weather Station
Most weather stations are located around cities. If you live far from the weather station or in a rural area, the forecast may be inaccurate because it’s not actually based on your location. This problem is amplified if you live in an area with more unpredictable weather events or localized storms.
-11. Geography
Local terrain, such as mountains or coastlines, can make forecasts less accurate in specific regions, as seen in Hawaii where traditional forecasts may be unreliable due to sun and mountain effects.
The inherent complexity of the atmosphere, coupled with modeling limitations, observational challenges, and uncertainties, contributes to the inaccuracies in weather forecasts. Ongoing research and advancements in technology continue to address these issues, but perfect weather predictions remain an elusive goal due to the inherent chaotic nature of the Earth’s atmosphere.
_____
_____
Causes of inaccurate monsoon prediction in India:
Predicting rainfall in India is particularly challenging due to the complex interaction of atmospheric, oceanic, and geographical factors.
- Monsoon Complexity: India’s rainfall is dominated by the Indian summer monsoon, a highly dynamic system influenced by interactions between land, ocean, and atmosphere. Small variations in temperature, pressure, or wind circulation can significantly affect rainfall patterns.
- Global Climate Influences: Large-scale climate phenomena such as the El Niño–Southern Oscillation and the Indian Ocean Dipole influence monsoon rainfall by altering atmospheric circulation and moisture transport.
- Complex Geography: India’s diverse landscape also shapes rainfall patterns. The Himalayas block cold air masses and influence atmospheric circulation, while the Western Ghats generate intense orographic rainfall (rainfall occurs when moist air is forced upward over rising terrain like mountains) along the west coast. Regions such as the Deccan Plateau experience rainfall patterns very different from those in coastal areas.
- Localised Convective Storms: Much of India’s rainfall occurs through short-lived thunderstorms that develop rapidly and affect small areas. These events are difficult for weather models to capture accurately.
- Active and Break Phases: The monsoon alternates between active rainfall periods and break phases. Predicting the timing of these shifts remains a major forecasting challenge.
- Data Limitations and Climate Change: Limited observational coverage in some regions and increasing climate variability further complicate rainfall prediction, especially for short-duration and localised rainfall events. Climate change is also increasing the frequency of short-duration extreme rainfall events, which are particularly difficult to forecast.
Rainfall prediction in India is influenced by the complex interactions among the Indian summer monsoon system, global climate drivers, topography, such as the Himalayas and Western Ghats, and localized convective storms.
______
______
Forecast Verification:
Forecast verification is the systematic process of assessing the quality, accuracy, and predictive power of a forecast by comparing predictions against actual observed outcome. Verification is the process of comparing forecasts to relevant observations. Verification is one aspect of measuring forecast goodness. It measures the quality of forecasts (as opposed to their value).
A forecast is like an experiment – given a set of initial conditions, a hypothesis is made that certain weather shall prevail after a certain time at a given place. One wouldn’t consider an experiment to be complete until its outcome is known. In the same way, one can’t consider a forecast experiment to be complete until it is found out whether the forecast was successful or not. The three most important reasons to verify forecasts are:
-1. To monitor forecast quality – how accurate are the forecasts and are they improving over time?
-2. To improve forecast quality -the first step toward getting better is discovering what wrong you are doing.
-3. To compare the quality of different forecast systems – to what extent does one forecast system give better forecasts than another and in what ways is that system better?
Verifying forecast accuracy is crucial for building confidence in forecasting models. By comparing forecast outputs with observational data, forecasters can assess the accuracy of their forecasts and identify areas for improvement. This is typically done using metrics such as mean absolute error (MAE) or Brier score, which provide a quantitative measure of forecast accuracy.
There are many techniques for verification of weather forecast issued. Among them some important techniques are: Verification Skill Scores for Probability of Precipitation, Verification Skill Scores for Yes/No Rainfall Forecast, Verification Skill Scores for Quantitative Precipitation Forecast and Verification Skill Scores for Temperature Forecasts.
________
What is being verified?
Data accuracy by data source:
The simulations (numerical models) are verified, because these offer the widest spatial and temporal coverage.
Observations and measurements can (and must) also be verified.
_
Accuracy by variable:
The accuracy of a weather simulation model significantly depends on the chosen meteorological variable. Meteorological variables like the 2m air temperature, surface pressure or the 500hPa geopotential height are typically calculated with high accuracy, whereas other variables such as precipitation and wind gusts have a lower accuracy, typically caused by small-scale spatial variations, which are not resolved in weather models.
The following are the key variables being verified:
- Air temperature (°C) at 2 meters above ground
- Wind speed (m/s) at 10 meters above ground
- Solar radiation (W/m²) at ground level
- Precipitation amount (mm) at 2 meters above ground
- Dew point temperature (°C) at 2 meters above ground
Variables such as wind direction, sunshine time, cloud cover, evapotranspiration, among others, are much more difficult to be verified, due to the lack of comprehensive measurement data and the interaction of some of these variables with local conditions (e.g. cloud cover depends on the topography and exposure, evapotranspiration depends on the growth state of plants). Such variables can be verified in the form of specific, focussed projects.
_
Accuracy by region:
The accuracy of simulations depends on the following factors:
- Topography of the area
Mountains produce a far more varied distribution of states than plains.
- Land cover
The type of surface (water, swamps, fields, forests, rocks, sand, etc.) influences the variability of the weather, and consequently the simulation accuracy.
- Weather events
Weather events vary from macro-scale (trade winds, fronts, hurricanes) to microscale (convection, fog, thunderstorms, tornadoes). The frequency of such events depends on the regional climate.
- Measurement accuracy
Although measurements are independent of geography, the regional distribution varies, with generally more measurements being available from regions with high population density. You can see real-time measurements on our maps.
All these factors vary by region.
_
Accuracy by season:
The seasons have an influence on the accuracy of the simulations (and even of measurements), mainly because certain seasons produce more micro-scale events (such as thunderstorms, tornadoes) which are more difficult to simulate and measure.
_
Accuracy by technologies:
The accuracy of simulations depends on the technology used. The main approaches are the following:
- Models, which produce raw output in different model resolutions
- MOS (Model Output Statistics), a method using local measurements to correct model output by statistical post-processing. Its results depend on the proximity to measurement locations.
- MultiModel (MM) approach. The advanced version uses a learning approach, which selects the most suitable out of many models using weather measurements. It can be applied to larger areas, since models cover entire regions.
_
Accuracy compared with other providers:
You have to compare your data with other weather data providers:
_
Accuracy over time:
Numerical weather forecast models have been continuously improved in the last decades. Around 1980, the 24-hour ahead forecast of the air temperature was calculated with an accuracy of around 70%, which had increased to around 90% by 2018: the 72h forecast nowadays is as good as the 24h forecast was 40 years ago. The accuracy of the 500 hPa geopotential height (around 5 km altitude) from numerical weather forecast models is even higher than the accuracy of the 2 m air temperature simulation.
_______
Various types of forecasts and their verification methods are given in tables below:
Nature of Forecast and Verification Methods:
|
Specificity of Forecast |
Example (s) |
Verification Methods |
|
Dichotomous (Yes/No) |
Occurrence of Fog |
Visual, dichotomous, probabilistic, spatial, ensemble |
|
Multi-category |
Cold, Normal or warm conditions |
Visual, probabilistic, spatial, ensemble, multi category |
|
Continuous |
Maximum temperature |
Visual, continuous, probabilistic, spatial, ensemble, |
|
Object or event-oriented |
Tropical cyclone motion and intensity |
Visual, dichotomous multi category, continuous, probabilistic, spatial |
_
Specificity of Forecast and Verification Methods:
|
Nature of forecast |
Example (s) |
Verification Methods |
|
Deterministic (non-probabilistic) |
Quantitative precipitation forecast |
Visual, dichotomous, multicategory, continuous spatial |
|
Probabilistic |
Probability of precipitation, ensemble forecast |
Visual, probabilistic, ensemble |
|
Qualitative (worded) |
5-day outlook |
Visual, dichotomous, multi category |
|
Time series |
Daily maximum temperature forecasts for a city |
Visual, dichotomous , multi category, continous, probabilistic |
|
Spatial distribution |
Map of geopotential height, rainfall chart |
Visual, dichotomous, multicategory, continuous, probabilistic, spatial, ensemble |
|
Pooled space and time |
Monthly average global temperature anomaly |
Dichotomous, multicategory, continuous, probabilistic, ensemble |
______
______
Improved weather forecasting accuracy:
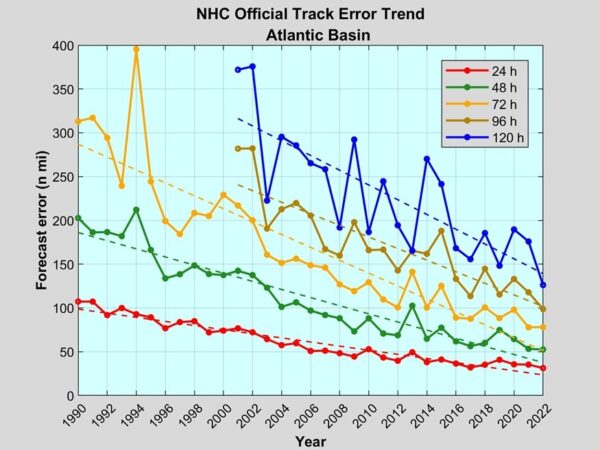
Figure above shows Trends in track accuracy for official forecasts from the National Hurricane Center. Some of the best forecasters in the world work for the National Hurricane Center in Miami. This is the office within NOAA that is charged with forecasting hurricanes and issuing warnings for the entire Atlantic basin, including the United States.
_
Technology improves the accuracy of weather forecasts by upgrading every step of the process, from gathering global data to running faster computer models. A modern five-day forecast is now as accurate as a three-day forecast was in the year 2000.
-1. Better Data Collection
- Next-Generation Satellites: Space instruments scan the globe continuously. They track cloud movements, ocean heat, and severe storms.
- Doppler Radar: Dual-polarization radar tools spot hail, wind shifts, and heavy rain inside a storm.
- Autonomous Stations: Unmanned posts and drones gather environmental data from hard-to-reach areas like deserts and oceans.
-2. Faster Supercomputing with smaller grids
- High-Performance Computers: Supercomputers crunch massive physics equations much faster than older systems.
- Smaller Grids: Computers divide the atmosphere into tinier 3D blocks. This fine detail helps pinpoint local weather conditions.
-3. Artificial Intelligence (AI)
- Pattern Recognition: AI looks at decades of past weather data to spot warning signs instantly.
- Speed: AI models generate forecasts in minutes instead of the hours traditional physics equations require.
- Hyper-Local Details: Deep learning helps scale broad forecasts down to specific neighborhoods.
__
Weather forecasting accuracy has dramatically improved over time.
According to the Met Office, the UK’s national meteorological service, their four-day forecasts are now as accurate its one-day forecasts were 30 years ago. It’s not just forecast agencies. Global computer models, such as the “EURO” and “GFS,” have seen dramatic improvement in their error and verification scores.
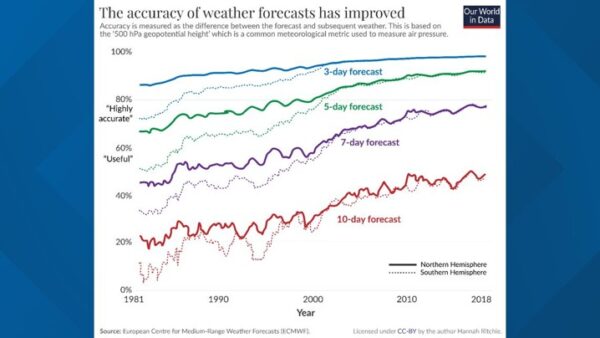
By the early 2000s, five-day forecasts were in the skill territory considered “highly accurate.” Today, seven-day forecasts are reaching that threshold, in many cases. This applies not just to day-to-day weather but also big events, such as hurricane forecasting.
Predictions have gotten much better in the United States, too. We can see this in some of the most important forecasts: the prediction of hurricanes. The National Hurricane Center publishes data on the “track error” of hurricanes and cyclones — the error in where the hurricane hits. This track error — especially for longer-term forecasts — has decreased a lot over time. In the 1970s, a 48-hour forecast had an error between 200 and 400 nautical miles; today this is around 50 nautical miles.
__
Why have weather forecasts improved?
The first big change is that the data has improved. More extensive and higher-resolution observations can be used as inputs into the weather models. This is because we have more and better satellite data and because land-based stations are covering many more areas around the globe and at a higher density. The precision of these instruments has improved, too.
These observations are then fed into numerical prediction models to forecast the weather. That brings us to the next two developments. The computers on which these models are run have gotten much faster. Faster speeds are crucial: the Met Office now chunks the world into grids of smaller and smaller squares. While they once modelled the world in 90-kilometer-wide squares, they are now down to a grid of 1.5-kilometer squares. That means many more calculations need to be run to get this high-resolution map. The methods to turn the observations into model outputs have also improved. We’ve gone from very simple visions of the world to methods that can capture the complexity of these systems in detail.
The final crucial factor is how these forecasts are communicated. Not long ago, you could only get daily updates in the daily newspaper. With the rise of radio and TV, you could get a few notices per day. Now, we can get minute-by-minute updates online or on our smartphones.
________
Low-income countries have much worse forecasts and often no early warning systems:
There are large differences in weather forecasts across the world, with a large gap between rich and poor.
As the researchers Manuel Linsenmeier and Jeffrey Shrader report in a recent paper, a 7-day forecast in a rich country can be more accurate than a one-day forecast in some low-income ones.
While national forecasts have improved over time across all income levels, the quality gap today is almost as wide as it was in the 1980s.
There are a few reasons for this. First, far fewer land-based instruments and radiosondes measure meteorological data in poorer countries. Second, the frequency of reporting is much lower. Third, lack of advanced supercomputers. Only a small number of countries operate their own global numerical weather-prediction models. Most national weather services rely instead on forecasts produced by a handful of international centers, which they then refine using regional models, local observations and the expertise of their own forecasters. Doing so requires skilled staff, reliable data and substantial computing resources.
With extensive computational resources, the developed world continuously not only offers models, but also checks forecasts against measurements to find gaps and errors in the models. As these are identified, they are being tweaked continuously improving forecasting models for that country or group that supports the forecasting center. This persistent need for extensive, high capacity high performance computing (HPC) resources to better protect the population is not available to developing countries that lack the resources to even operate a basic forecasting model. For example, on the African continent, the most advanced HPC resource, by far, is the Lengau machine in South Africa installed in 2016. It is now old and far behind the needs of current forecasting models. The rest of Africa has been receiving machines as donations from the developed world and redeploying them, generally in much smaller pieces, across the continent. Even with these resources, the forecasting models are too complex to complete their calculations to offer timely forecasts for the areas in which these machines are installed.
60% of workers in low-income countries are employed in agriculture, arguably the most weather-dependent sector. Most are small-scale farmers, who are often extremely poor. Having accurate weather forecasts can help farmers make better decisions. They can get information on the best time to plant their crops. They know in advance when irrigation will be most needed or when fertilizers might be at risk of being washed away. They can receive alerts about pest and disease outbreaks so they can either protect their crops when an attack is coming or save pesticides when the risk is low. That means they can use precious resources most efficiently if they have access to accurate weather forecasts. Good weather forecasts are most crucial for the poorest people in the world.
They’re also crucial for protecting against cyclones, heat waves, flooding, and storm surges. Having accurate forecasts several days in advance allows cities and communities to prepare. Housing can be protected, and emergency services can be on standby to help with the recovery.
But accurate forecasts alone don’t solve the problem: they’re only useful if they are disseminated to people so they can respond. Many of the deadliest disasters over the last few decades were accurately forecasted ahead of time. The common failure was poor communication.
_
Improving forecasts in low-income countries:
Proper investment and financial support will be essential to close the gaps. There also emerging technologies that could accelerate this. A recent paper published in Nature documented a new artificial intelligence (AI) system — Pangu-Weather — that can perform forecasts as accurately (or better) than leading meteorological agencies up to 10,000 times faster. It was trained on 39 years of historical data. The speed of these forecasts would make them much cheaper to run and could provide much better results for countries with limited budgets.
Faster and more efficient technologies can also fill the gaps where land-based weather stations aren’t available. Sensor-carrying drones can run surveys over specific areas to build higher-resolution maps. With lower-cost and more efficient ways of turning that into forecasts, mobile technologies can disseminate this information quickly. Some companies are already sending messages to farmers in low-income countries to advise them on the best time to plant their crops.
This innovation is crucial to making countries more resilient to weather today. But it’s also essential in a world where weather is likely to get more extreme.
_______
_______
Accuracy of NWP vs AI models:
For decades, scientists used traditional physics-based models to predict future weather conditions, using complex mathematical equations to simulate the dynamics at work in the atmosphere. New AI-based models instead identify patterns in decades of historical data to forecast weather outcomes. That new technology uses less computing power than traditional models – which must run thousands of mathematical equations to work – and has been found to outperform traditional models for some aspects of weather forecasting. But it also seems to have major shortcomings, experts have found. Crucially, when it comes to predicting extreme weather events, new models still “underperform”, according to a study published in Science Advances. Because their forecasts are based on past weather events, the authors found, they seem to have trouble simulating the record-breaking weather events that are becoming increasingly common amid the climate crisis, instead tending to predict weather more similar to historical events. Traditional physics-based models don’t have this problem, because they assess and predict the weather outcomes that certain physical conditions yield.
Accuracy Breakdown:
- Short-Range (0–24 hours): NWP models usually lead. They capture local surface details, mesoscale convection, and short-term heavy precipitation better.
- Medium-Range (3–10 days): AI models (such as Google’s GraphCast or Huawei’s Pangu-Weather) match or outperform traditional physics-based baselines like ECMWF HRES on large-scale atmospheric flow and standard statistical metrics like RMSE.
- Tropical Cyclones: AI models excel at predicting storm tracks and long-lead typhoon paths.
______
______
14 days accuracy limit:
Traditional weather forecast skill typically tops out at around 14 days due to the chaotic nature of the atmosphere and initial-state errors. Factors affecting the accuracy of numerical predictions include the density and quality of observations used as input to the forecasts, along with deficiencies in the numerical models themselves. Post-processing techniques such as model output statistics (MOS) have been developed to improve the handling of errors in numerical predictions. A more fundamental problem lies in the chaotic nature of the partial differential equations that describe the atmosphere. It is impossible to solve these equations exactly, and small errors grow with time (doubling about every five days). Present understanding is that this chaotic behavior limits accurate forecasts to about 14 days even with accurate input data and a flawless model. In addition, the partial differential equations used in the model need to be supplemented with parameterizations for solar radiation, moist processes (clouds and precipitation), heat exchange, soil, vegetation, surface water, and the effects of terrain. In an effort to quantify the large amount of inherent uncertainty remaining in numerical predictions, ensemble forecasts have been used since the 1990s to help gauge the confidence in the forecast, and to obtain useful results farther into the future than otherwise possible. This approach analyzes multiple forecasts created with an individual forecast model or multiple models.
_
Weather forecasting skill drops significantly around the 14-day mark due to the chaotic nature of Earth’s atmosphere, a phenomenon famously known as the “butterfly effect.” While computing power and satellite data have drastically improved 1- to 7-day forecasts, pushing past the two-week barrier remains one of modern meteorology’s greatest challenges.
Why the 14-Day Limit Exists:
- Exponential Error Growth: Even a 0.0001% error in initial atmospheric data (like wind speed or temperature) multiplies over time. By day 14, these tiny gaps grow large enough to make a forecast no more accurate than historical averages.
- Small-Scale Chaos: Features like local thunderstorms or sudden wind shifts cannot be perfectly modelled weeks in advance, yet they eventually alter large-scale weather systems.
Where Improvement is Happening:
Meteorologists and data scientists are actively working to bridge this gap through several advanced approaches:
- Machine Learning & AI: AI models (like Google’s GraphCast or Huawei’s Pangu-Weather) process global weather patterns in seconds rather than hours. They are currently being tested to see if they can spot long-range trends faster and more accurately than traditional physics models.
- Ensemble Modeling: Instead of running one forecast, supercomputers run dozens of simulations (ensembles) with slightly tweaked starting data. If 80% of the models show a storm in 12 days, confidence increases.
- Subseasonal-to-Seasonal (S2S) Focus: Subseasonal-to-seasonal (S2S) forecasting bridges the gap between traditional short-term weather predictions (up to 2 weeks) and long-term climate projections (seasons to a year), typically covering lead times from two weeks to two months (or up to six months in broader use) .
_______
_______
Heavy water isotopes make weather predictions more accurate:
For predicting weather, water vapour isotopes integrate key information on the history of their evaporation, condensation, mixing and transport. Heavy water (containing either deuterium or oxygen-18) exists in the atmosphere and the way that these water isotopes condense and evaporate is different to that of normal water molecules.
The release and absorption of latent heat when water condenses and evaporates is the primary energy source for atmospheric circulation. The vertical heating profile plays a major role in large-scale circulation, wave propagation, storm track positioning, cloud development and precipitation patterns. However, vertical heating structures and convective activity cannot be measured directly by satellite networks and have to be inferred instead, leading to biases and inconsistencies that degrade the accuracy of weather models.
_
Stable heavy water isotopes can provide a direct physical link between the latent heating processes in weather patterns through isotopic fractionation. Heavier water isotopes preferentially condense into the liquid phase because they have a greater binding energy and lower diffusive velocity. Additionally, heavy water doesn’t evaporate as easily as normal water.
Even though these water isotopes exist in small quantities, their relative abundance alters during evaporation and condensation. Observing this change in abundance of the isotopes allowed the researchers to understand where the water came from and what happened to it along the way – providing insights into the atmospheric conditions.
_
The research team – led by Kinya Toride from University of Colorado Boulder, NOAA and the University of Tokyo – examined data from the Infrared Atmospheric Sounding Interferometer (IASI), which provides large amounts of accurate long-term data on water vapour isotope ratios in the mid-troposphere. The researchers fed the data collected from satellite observations into a weather model using a technique called data assimilation. This approach takes the different isotope signals and translates them into the atmospheric variables that are used in weather forecasting – as the vapour behaviour alone was not sufficient to reveal atmospheric variables such as temperature, wind and humidity.
They found that inclusion of these data improved the estimation of wind, temperature and water vapour in the atmosphere, leading to more accurate weather forecasts. This included improving forecasts for up to five days ahead and providing more accurate predictions on heavy rainfall across many regions.
______
______
Section-12
Challenges and limitations in weather forecasting:
Weather Forecasting Challenges:
Weather forecasting is a complex task that involves predicting the future state of the atmosphere. Despite significant advances in technology and modeling, meteorologists still face numerous challenges in accurately forecasting the weather. These challenges have significant impacts on various industries and aspects of our lives, from aviation and agriculture to public safety and health.
-1. Butterfly effect
One of the primary factors that make weather forecasting difficult is the chaotic nature of the atmosphere. The atmosphere is a complex system that is sensitive to even the smallest changes in its initial conditions. This sensitivity is known as the butterfly effect, where a small change in one part of the system can have significant effects on other parts of the system. In weather forecasting, this means that small errors in our measurements or initial conditions can lead to large discrepancies in our predictions.
-2. Challenges in Data Collection
One of the primary challenges in weather forecasting is collecting accurate and comprehensive data. Meteorologists rely on a range of data sources, including weather stations, radar, satellites, and weather balloons. However, there are several limitations to these data sources that can impact the accuracy of forecasts.
-3. Limited Availability of Observational Data
One of the main challenges in data collection is the limited availability of observational data in remote or hard-to-reach areas. Many parts of the world, such as oceans and mountainous regions, have sparse observational networks, making it difficult to accurately predict weather patterns in these areas.
- Limited weather stations in remote areas
- Inadequate radar coverage over oceans and mountains
- Insufficient satellite data in certain regions
-4. Inaccuracies in Satellite and Radar Data
Satellite and radar data are crucial for weather forecasting, but they are not without their limitations. Satellites can be affected by factors such as cloud cover, atmospheric interference, and sensor calibration issues, which can lead to inaccuracies in the data. Radar data can also be impacted by factors such as beam blockage and signal attenuation.
-5. Insufficient Density of Weather Stations
The density of weather stations is another critical factor in weather forecasting. In areas with sparse weather station networks, it can be challenging to accurately predict local weather conditions. Weather station density in developing nations is critically low, often falling many times below World Meteorological Organization (WMO) recommended standards.
-6. Complexity of Weather Systems
Weather systems are inherently complex and involve non-linear dynamics, multiple interactions, and various scales. This complexity makes it challenging to accurately predict the behavior of weather systems. Weather is fundamentally nonlinear. This means small changes do not simply add up; they interact, amplify, or cancel out in unpredictable ways. Nonlinear interactions between temperature, wind, humidity, and other variables make forecasting complex — and explain why a seemingly calm day can suddenly turn stormy. Nonlinear interactions mean that variables like heat, moisture, and wind do not just add up cleanly; they amplify small changes.
-7. Influence of Topography and Land Use on Local Weather
Topography and land use can have a significant impact on local weather conditions. For example, mountains can block or redirect airflow, leading to changes in precipitation patterns. Similarly, urban areas can experience unique microclimates due to the urban heat island effect.
-8. Local Weather Phenomena
While large-scale weather systems like hurricanes, cold fronts, and high-pressure systems can be modelled with relative accuracy, smaller, more localized weather phenomena—like thunderstorms, tornados, or lake-effect snow—are more difficult to predict. These events can develop rapidly and are influenced by very localized conditions.
________
________
Limitations of weather forecasting:
An important goal of all scientific endeavour is to make accurate predictions. The physicist or chemist who conducts an experiment in the laboratory does so in the hope of discovering certain fundamental principles that can be used to predict the outcome of other experiments based on those principles. In fact, most of the laws of science are merely very accurate predictions concerning the outcome of certain kinds of experiments. But few physical scientists are faced with more complex or challenging prediction problems than the meteorologist.
_
In the first place, the meteorological laboratory covers the entire globe, so that even the problem of measuring the present state of the atmosphere is tremendous. Furthermore, the surface of the earth is an irregular combination of land and water, each responding in a different way to the energy source – the sun. Then, too, the atmosphere itself is a mixture of gaseous, liquid, and solid constituents, many of which affect the energy balance of the earth, one of them, water, is continually changing its state. Also, the circulations of the atmosphere range in size from extremely large ones, which may persist for weeks or months, to minute whirls, with life spans of only a few seconds.
_
According to Miller and Thompson (1975) and Ayado and Burt (2001) the problem of forecasting then, involves an attempt to observe, analyze and predict the many interrelationships between the solar energy source, the physical feature of the earth, and the properties and motions of the atmosphere. This is the basis on which weather forecasts still go wrong today. Ackerman and Knox (2003) point out reasons why forecasts still go wrong today by stating that the limitations which directly relates to today’s numerical forecast models are as follows:
-1. Imperfect data:
The data of today’s numerical models still includes a large helping of radiosonde observations. However, the number of radiosonde sites in the World over has actually declined over the past few decades. Developed countries in the world today, spend more money in launching weather satellites than for boring weather balloons.
Satellite data are global in average, but researchers in data assimilation are still trying to figure out how this data can be “digested” properly by the models. In addition, important meteorological features still evade detection, especially over the oceans. The model results are only as good as the data in its initial conditions.
-2. Faulty “vision” and “fudges”:
Today’s forecasts also involve an inevitable trade-off between horizontal resolution and the length of the forecast. This is because fine resolution means lots of point at which to make calculations. This requires a lot of computer time. A forecast well into the future also requires millions or billions more calculations. If fine resolution is combined with a long range forecast, the task would choke the fastest supercomputers today. One would not get forecasts for weeks. Future improvement in computing will help speed things up.
In the meantime, however, some models are still not able to pick or “see” small-scale phenomena such a clouds, raindrops, and snowflakes. To compensate for this fuzzy “vision” of models, the computer code includes crude approximations of what is not being seen. These are called parameterizations. Even though much science goes into them, these approximations are nowhere close to capturing the complicated reality of the phenomena. This is because; the smallest scale phenomena are often the most daunting to understand. Therefore, it is not an insult to meteorologists’ abilities to say that parameterizations are “fudges” of the actual phenomena.
-3. Chaos:
It will be surprising to note that, even if a supercomputer which could do quadrillions of calculations each second were to be invented, no better forecasting result would still be gotten. Brute force numerical weather forecasting with extremely fine resolution has its limits.
The reason for these limits is a curious property of complex, evolving systems like the atmosphere. It is called “Sensitive dependence on initial conditions”, and is a hallmark of what is popularly known as chaos theory. Chaos in the atmosphere does not mean that everything is a mess; instead, it means that the atmosphere both in real life and in a computer model may read very differently to initial conditions that are only slightly different. Because we do not know the atmospheric conditions perfectly at any time, chaos means that the resemblance between a model’s forecast and reality will be less and less with each passing day.
________
Weather forecasting is powerful but inherently limited by physical, observational, computational, and human factors. The limits fall into several clear categories:
-1. Chaotic nature of the atmosphere
- Sensitive dependence on initial conditions (butterfly effect): tiny errors in measured state grow nonlinearly, limiting predictability. For synoptic scales (days), forecasts are useful; for precise, small-scale details beyond ~10–14 days they become unreliable.
- Predictability varies with scale: large-scale patterns (planetary waves) persist longer than mesoscale (thunderstorms) or microscale (gusts).
-2. Imperfect observations and sampling
- Observations are sparse in space and time (over oceans, polar regions, upper atmosphere). Remote sensing fills gaps but has retrieval errors.
- Incomplete measurement of key variables (e.g., soil moisture, ocean subsurface temperatures, small-scale turbulence) introduces initial-condition uncertainty.
- Instrument errors, timing offsets, and data latency degrade assimilation quality.
-3. Numerical model limitations
- Discrete approximations: models solve fluid dynamics and thermodynamics with finite resolution and timestep, causing truncation and numerical diffusion errors.
- Parameterizations: sub-grid processes (convection, cloud microphysics, boundary-layer mixing, radiation, surface fluxes) are approximated with empirical schemes that introduce systematic biases.
- Coupling complexities: atmosphere–ocean–land–ice–chemistry interactions are imperfectly represented, affecting forecasts at seasonal-to-subseasonal ranges.
-4. Computational constraints
- Higher resolution and larger ensembles reduce uncertainty but require exponentially more computing power. Trade-offs force limits on resolution, physics complexity, and ensemble size.
- Real-time operational constraints (data ingestion, forecast production deadlines) restrict model sophistication.
-5. Model bias and systematic error
- Models exhibit persistent biases (temperature, precipitation amounts, storm tracks) that need calibration. Bias correction helps but cannot recover missed dynamical events.
- Tuning for one regime can worsen another; model skill is context-dependent.
-6. Limited predictability of specific phenomena
- Convective storms, tornadoes, and exact precipitation timing/placement are inherently hard beyond short lead times (hours).
- Tropical cyclone intensity changes, rapid extratropical transition, and mesoscale convective system initiation remain challenging.
- Extreme events (flash floods, localized severe wind/gusts) are often dominated by small-scale processes and local conditions.
-7. Data assimilation and ensemble limitations
- Data assimilation reduces initial errors but cannot create information where none exists. Assimilation schemes introduce their own approximations.
- Ensembles estimate uncertainty but are sensitive to how initial perturbations and model errors are represented; ensembles are finite samples and can under/over-estimate risk.
-8. Observation-to-model mismatch
- Differences between what instruments measure and what models represent (e.g., radiances vs. model variables) require complex retrievals and forward operators that add uncertainty.
-9. Communication and decision thresholds
- Even accurate probabilistic forecasts can be misinterpreted or poorly communicated, producing ineffective decisions. Translating probabilistic output into actionable guidance (warnings, watch thresholds) is nontrivial.
_
Practical implications and how forecasters manage limits:
- Use of ensembles and other probabilistic forecasts to express uncertainty and risk.
- Multi-model blends and statistical post-processing (bias correction, calibration) to reduce systematic errors.
- Targeted high-resolution modeling for high-impact events and nowcasting (radar/lightning-based short-term forecasts).
- Observing-system improvements (more satellites, drones, ocean floats) and better data assimilation to reduce initial-condition uncertainty.
- Continuous model development: improved physics, adaptive meshes, machine-learning emulators for sub-grid processes.
_
Forecast limits arise from atmospheric chaos, incomplete observations, approximate models, computational trade-offs, and communication challenges. Progress comes from denser observations, larger ensembles, better physics and coupling, machine-learning enhancements, and clearer probabilistic communication—but fundamental predictability ceilings remain for small-scale and long-lead details.
______
______
Section-13
AI in weather forecasting:
The increasing complexity and unpredictability of global weather patterns necessitate more advanced forecasting methods. As we face new norms of extreme weather, weather forecasting technology must continue to adapt to new weather dynamics and the sheer volume of data generated daily. As a result, there is a pressing need for innovative solutions to enhance the accuracy and efficiency of weather predictions.
Artificial Intelligence (AI) has emerged as a transformative force in meteorology, offering the ability to process vast datasets and generate accurate forecasts with unprecedented speed and precision. By leveraging AI, meteorologists can now harness the power of machine learning algorithms, neural networks, and deep learning models to improve their forecasting capabilities. These technologies not only handle large volumes of data but also uncover patterns and relationships within the data that traditional methods might miss.
_
Weather forecasting involves predicting atmospheric conditions such as temperature, humidity, precipitation, and wind speed over a given time frame. Accurate predictions are crucial for mitigating the impacts of extreme weather events and optimizing resource allocation. Traditional methods based on physical and statistical models have limitations in accuracy and computational efficiency. Traditional forecasting relies on numerical weather prediction (NWP) models, which solve complex mathematical equations describing atmospheric behavior. These models, however, are computationally intensive and limited by uncertainties in initial conditions and parameterizations. AI and ML offer an alternative by leveraging data- driven approaches to identify patterns in vast datasets, enabling faster and often more accurate predictions. By integrating AI/ML with existing forecasting systems, meteorologists can achieve enhanced precision and timeliness in their forecasts. Pure AI weather models rely on historical pattern recognition, whereas hybrid models blend machine learning speed with the fundamental laws of physics to improve accuracy during extreme events. State-of-the-art (SOTA) AI weather models use deep learning to predict future weather in seconds instead of running slow physics equations on massive supercomputers.
_
AI meteorology powers operational platforms that demonstrate both speed and precision across multiple weather phenomena. Google’s DeepMind GraphCast achieves 97.2% accuracy across 6–10 day horizons, while NVIDIA’s FourCastNet provides high-resolution visualizations of atmospheric dynamics comparable to GFS outputs. Huawei’s Pangu-Weather integrates ocean-atmosphere coupling to simulate El Niño events ahead of traditional models, highlighting the growing capability of AI-driven weather technology. Google’s GenCast achieved a 60%-reduction in error compared to ECMWF’s leading ensemble forecasting model over 97.2% of assessed targets, making it one of the most accurate AI based meteorological forecasters ever created, and was reported on in ‘Nature’, which published the study.
__
What is AI?
Artificial Intelligence (AI) refers to the simulation of human intelligence processes by machines, especially computer systems. These processes include learning (acquiring information and rules for using it), reasoning (using rules to reach approximate or definite conclusions), and self-correction. AI encompasses a broad range of technologies that enable machines to perform tasks that typically require human intelligence, such as problem-solving, understanding natural language, recognizing patterns, and learning from experience.
_
AI, in its broadest sense, refers to any machine that can mimic cognitive functions such as learning and problem-solving. It includes a variety of techniques and approaches designed to create intelligent systems capable of performing tasks without explicit human intervention.
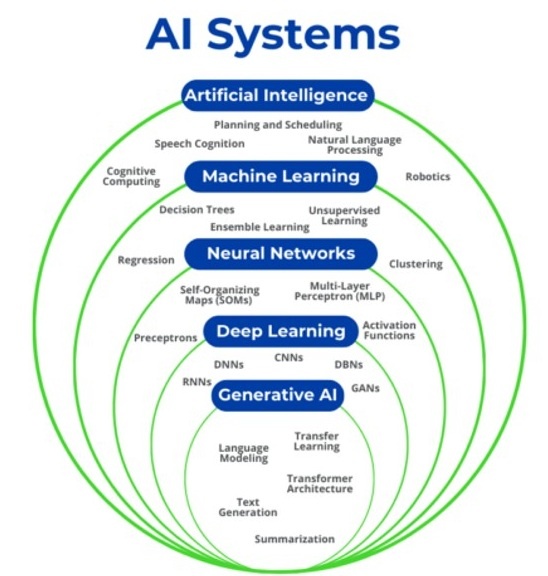
Machine Learning?
Machine Learning (ML) is a subset of AI that involves the use of algorithms and statistical models to enable systems to improve their performance on a specific task with experience (data). Unlike traditional programming, where specific instructions are coded, ML allows systems to learn from data and make decisions based on it.
Neural Networks?
Neural Networks are a series of algorithms that attempt to recognize underlying relationships in a set of data through a process that mimics the way the human brain operates. They consist of interconnected nodes (neurons) that process information in layers.
Deep Learning?
Deep Learning is a subset of ML involving neural networks with many layers (deep networks) that can learn and make intelligent decisions on their own. These models are particularly effective at handling large and complex datasets.
Generative AI?
Generative AI involves algorithms that can generate new content, including synthetic data, by learning from a dataset. These models can create realistic simulations and augment training datasets.
_
Earth system forecasts are indispensable tools for human societies, as evidenced by recent natural events such as the floods in Valencia, the air quality crisis in New Delhi, and hurricanes Helene and Milton in the eastern United States. Such systems not only provide crucial early warnings for extreme events, but are also invaluable for diverse fields ranging from agriculture to healthcare to global commerce. Modern Earth system predictions rely on complex models developed over centuries of accumulated physical knowledge, providing global forecasts of diverse variables for weather, air quality, ocean currents, sea ice, and hurricanes.
Despite their vital role, Earth system forecasting models face several limitations. They are computationally demanding, often requiring purpose-built supercomputers and dedicated engineering teams for maintenance. Their complexity, built up over years of development by large teams, complicates rapid improvements and necessitates substantial time and expertise for effective management. Finally, forecasting models incorporate numerous approximations, such as those for sub-grid scale processes, limiting accuracy. These challenges open the door for alternative approaches that may offer enhanced performance.
_
Traditional forecasting is based on a system of Numerical Weather Prediction (NWP), which uses physics equations to simulate atmospheric behaviour. As sophisticated as these models are, there are major limitations to what can be done with them.
They require:
- Massive supercomputers
- Huge amounts of electricity
- Hours of processing time
- Continuous updates
Even then, the weather remains chaotic. A small measurement error at the time of its taking can lead to an important forecasting mistake some days later. Consider it similar to trying to guess where a leaf blows through the wind. No matter how comprehensively you understand the laws of physics, a million tiny variables impact where that leaf finally lands.
One of those challenges is that a developed line knows fully well how direct learning from real weather behaviour is more useful than inferring solely based on predictive equations. It is not as if we ask the question: “What should happen in accordance with physics?” AI additionally says, “What do we usually notice after we have had a climate like this earlier? This extra perspective applies to massively improved forecasting accuracy.
_
There are several challenges that hinder NWP models (Abraham et al., 2002).
First, due to the chaotic nature of atmospheric phenomena (Abraham et al., 2002), slight variations in initial conditions can substantially influence model outputs. The measurement of initial conditions that are input into the model, data assimilation, and an incomplete understanding of the atmospheric physical processes all inevitably lead to errors. As time goes on, the precision of prediction reduces with a growing gap between current time and predicted time.
Secondly, an outpouring of meteorological data is now available. For example, sensors and autonomous observing platforms have collected petabytes of meteorological data (Agapiou, 2017). In contrast, NWP models generate several terabytes of simulation results daily. Additionally, various types of uncertainties are present in the datasets, and there are spatiotemporal correlations between datasets that pose unprecedented problems to NWP.
Thirdly, there is a substantial computation cost associated with numerical solutions to theory-based nonlinear equations, which is mainly dependent on supercomputer capability.
Last but not least is the fact that grid resolutions are smaller than certain atmospheric processes’ natural scales, typically given in kilometers. However, convection, radiative transfer, and cloud formation at small scales are not explicitly solved but treated with parameterization (Milton and Wilson, 1996; Delage, 1997).
_
Artificial Intelligence (AI) is particularly prominent in overcoming challenges across diverse domains, especially post-processing tools for correcting systematic errors in NWP output data, enhancing resolution, and accounting for topographic effects (Aznarte and Siebert, 2017; Buehner et al., 2010). Besides, AI provides an opportunity to assess predictability considering the uncertainty of ensemble forecasting (Wilks, 2002; Foley et al., 2012; Mallet et al., 2009) and addressing problems related to extreme events such as hailstorms, gale storms, or cyclones (McGovern et al., 2017; Williams et al., 2008; Herman and Schumacher, 2018). Although innovative methodologies are developing, NWP simulations remain relevant, and their impact on improving output quality is significant because AI-based models work based on the input data (Wilks, 1995). All these issues, combined with the availability of petabyte-scale climate and weather data on a global scale and the recent reduction in computational demands for Machine Learning (ML) and Deep Learning (DL) models, have sparked interest in integrating AI-based methods into weather and climate modeling among weather scientists and AI researchers. Many of ML algorithms that are used in the core of AI-based weather forecasting models help in correcting the systematic errors that arise out of NWP outputs and improve spatial and temporal resolution. AI does not replace conventional models but enhances them with the ability to model the complexities governing atmospheric dynamics.
_
Several recent review papers have explored the intersection of AI and weather forecasting, each contributing valuable insights but with notable limitations in scope and coverage. Camps-Valls et al. (2025) focus on the use of AI for modeling and understanding extreme weather and climate events, emphasizing explainability, ethical concerns, and stakeholder engagement. Waqas et al. (2024) provide a technically detailed survey on integrating AI into NWP systems, particularly in areas such as data assimilation, and post-processing. Similarly, Zhang et al. (2025) present a taxonomy of ML techniques and discuss their general applicability in weather forecasting. While informative, these reviews tend to concentrate on specific aspects or applications without delivering a comprehensive, systematic, and comparative evaluation of recent AI-based weather forecasting models. Notably, they do not analyze state-of-the-art (SOTA) models such as FengWu, ClimaX, Pangu-Weather, FourCastNet, GraphCast, GenCast, and the Artificial Intelligence Forecasting System (AIFS), nor assess their performance across real-world forecasting scenarios.
_
One of the advantages of AI-based weather forecasting models is their computational efficiency. They could be trained using accessible hardware like GPUs, TPUs, or specialized AI hardware, while NWP models need HPC clusters. Speed is another notable advantage of these models. They can forecast weather phenomena significantly faster than NWP models, with latencies typically in the order of seconds. However, it’s important to note that while AI-based models may offer faster processing, they might not resolve as many physical processes as higher-resolution NWP models. Despite this, AI-based models remain independent of certain resolution constraints and offer advantages in terms of computational efficiency and speed.
_______
How AI is used in weather forecasting:
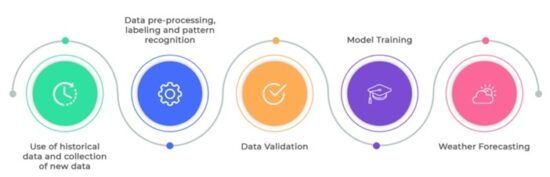
_
The first thing to understand about a deep-learning forecast model is that it uses no physics-based modeling of the atmosphere at all. It is also not a large language model. It is not like asking Chat GPT to predict the weather.
Essentially, a deep-learning model works by learning. A snapshot of the Earth and its weather conditions is shown to the model—values like temperature, pressure, humidity, winds, and much more at various levels of the atmosphere. Then the model is shown what conditions were like six hours later around the Earth. The model then “learns” this relationship between weather now and conditions a few hours later.
The process is repeated many times over. This is where the ERA5 data is incredibly valuable. It has nearly six decades of high-quality data for every day, every few hours, and for points all around the world. By ingesting all this data, the model gets better and better at recognizing patterns and making connections about conditions now—say, a large, low-pressure system over the Northern Atlantic Ocean—and what that means for weather downstream over Europe and Asia over the coming week to 10 days.
One of the initial concerns about this approach was whether there was enough data in ERA5 to make robust forecasts. But given the improving performance of the models, it appears there is indeed enough information.
Deep learning weather models have proven to be excellent at forecasting the tracks of hurricanes. But while these models are better at predicting where hurricanes will go, they tend to be lower-performing on the intensity changes of such storms relative to physics-based models.
Artificial intelligence (AI) models trained on the ERA5 dataset (ECMWF Reanalysis v5) can now outperform IFS-HRES (the reference numerical weather prediction model developed by the ECMWF (European Center for Medium-Range Weather Forecasting), in a wide range of scores. At the same time, computing costs for making a forecast are orders of magnitude lower. At ECMWF, this shift is embodied by the Artificial Intelligence Forecasting System (AIFS), which became operational in early 2025. The AIFS is based on graph neural networks and transformers to deliver global forecasts. The ensemble version, AIFS ENS, which was introduced in mid-2025, offers probabilistic forecasts with remarkable speed and efficiency, using up to 1,000 times less energy than traditional physics-based models.
For now, physics-based weather models aren’t going anywhere. They’re incredibly powerful tools that have significantly improved our ability to make five-, seven- and occasionally even 10-day weather forecasts for major events. They’re trusted by forecasters around the world.
But what does the future look like?
The first step is potentially changing the way data is assimilated into AI-based models. At present, they almost universally use a set of initial conditions produced by a physics model. That is, a model like the ECMWF spends an enormous amount of computing power to collect data from buoys, surface stations, weather balloons, airplanes, ships, satellites, and many other sources and then synthesizes a set of initial conditions for grid points across the planet. All models then take this as the beginning “state” of the planet’s weather and forecast from that. Researchers are working on techniques for AI models to ingest current observations and thereby perform both the data assimilation and forecasting parts of weather modeling. This is actually a harder problem than training AI models. Something like that may be possible a decade from now.
Note:
ERA5 is the fifth-generation global climate and weather reanalysis dataset from the European Centre for Medium-Range Weather Forecasts (ECMWF).
__
AI meteorology is revolutionizing weather prediction by processing massive datasets, including satellite imagery, radar scans, and IoT sensor inputs. Traditional numerical models, while reliable, struggle to capture chaotic atmospheric behavior quickly, but machine learning can simulate these systems thousands of times faster. Weather model technology now uses advanced neural networks to detect subtle patterns that humans often miss, improving lead times for hurricanes, tornadoes, and other extreme events. These capabilities help communities respond proactively, saving lives and reducing economic losses caused by unpredictable weather events.
Machine learning techniques also enhance the precision of ensemble forecasts by blending historical reanalysis with real-time observations, creating a highly calibrated system. By integrating AI meteorology into operational frameworks, forecasters can detect storms earlier, optimize evacuation strategies, and improve emergency preparedness at local and regional scales. The combination of speed, accuracy, and adaptability makes AI-driven weather forecasting a transformative tool for modern meteorology.
_
How does AI improve Weather Forecasting?
AI meteorology leverages convolutional neural networks and other deep learning architectures to analyze hyperspectral satellite data that reveal cloud microphysics invisible to human eyes. Weather model technology such as FourCastNet generates multi-day forecasts in seconds, compared to hours for traditional physics-based IFS models, while maintaining ensemble reliability. Deep learning ensembles combine ERA5 reanalysis with real-time inputs from thousands of IoT weather stations, allowing regional calibration for accurate, localized predictions.
- CNNs analyze GOES-16 hyperspectral scans detecting microphysical cloud structures.
- FourCastNet produces 15-day forecasts in seconds versus hours for legacy models.
- Deep learning ensembles integrate data from 10,000 IoT sensors regionally.
- AI detects small vorticity patterns to forecast tornado touchdowns earlier.
- Machine learning predicts hurricane paths 72 hours ahead with high accuracy.
- Ensemble blending reduces forecast uncertainty and improves reliability.
- AI models identify trends invisible to conventional statistical methods.
- Real-time adjustments enhance predictive accuracy during extreme weather events.
_
What are the Latest Advancements in AI Meteorology?
Weather model technology has advanced through probabilistic forecasting, diffusion models, and transformer architectures that outperform traditional ensemble systems. AI meteorology now incorporates foundation models like ClimaX, trained on decades of climate data, to project extreme events under specific scenarios. These innovations dramatically improve the detection and tracking of tropical cyclones, heatwaves, and European windstorms. By simulating spatiotemporal dynamics at high resolutions, AI offers unprecedented accuracy in predicting complex atmospheric phenomena.
- GenCast probabilistic forecasts outperform ECMWF by 15% on cyclone tracks.
- ClimaX models extrapolate extreme heatwaves under RCP8.5 scenarios.
- Transformers forecast 99% of European windstorms versus 85% with legacy regressions.
- AI predicts ocean-atmosphere interactions for early El Niño warnings.
- Machine learning improves extreme rainfall and flash flood forecasts.
- Spatiotemporal sequence modeling captures jet stream meanders precisely.
- Diffusion models refine tropical cyclone path predictions.
- High-resolution simulations enhance risk assessment and emergency planning.
_______
Why AI forecasting matters now:
The physics-based weather prediction models used by major meteorological centers around the world are powerful but costly. They simulate atmospheric physics to forecast weather conditions ahead, but they require expensive computing infrastructure. The cost puts them out of reach for most developing countries.
Moreover, these models have mainly been developed by and optimized for northern countries. They tend to focus on temperate, high-income regions and pay less attention to the tropics, where many low- and middle-income countries are located.
A major shift in weather models began in 2022 as industry and university researchers developed deep learning models that could generate accurate short- and medium-range forecasts for locations around the globe up to two weeks ahead.
These models worked at speeds several orders of magnitude faster than physics-based models, and they could run on laptops instead of supercomputers. Newer models, such as Pangu-Weather and GraphCast, have matched or even outperformed leading physics-based systems for some predictions, such as temperature.
AI-driven models require dramatically less computing power than the traditional systems.
While physics-based systems may need thousands of CPU hours to run a single forecast cycle, modern AI models can do so using a single GPU in minutes once the model has been trained. This is because the intensive part of the AI model training, which learns relationships in the climate from data, can use those learned relationships to produce a forecast without further extensive computation – that’s a major shortcut. In contrast, the physics-based models need to calculate the physics for each variable in each place and time for every forecast produced.
While training these models from physics-based model data does require significant upfront investment, once the AI is trained, the model can generate large ensemble forecasts — sets of multiple forecast runs — at a fraction of the computational cost of physics-based models.
Even the expensive step of training an AI weather model shows considerable computational savings. One study found the early model FourCastNet could be trained in about an hour on a supercomputer. That made its time to presenting a forecast thousands of times faster than state-of-the-art, physics-based models.
The result of all these advances: high-resolution forecasts globally within seconds on a single laptop or desktop computer.
Google DeepMind’s GraphCast model was trained on almost 40 years of weather data from all over the world, allowing the AI to make predictions regarding more than 220 atmospheric variables in under one minute.
For comparison, traditional numerical weather models typically take hours of computation on powerful supercomputers to complete.
Not only does that speed cut computing costs, but it ultimately gives meteorologists more warning before things become life-threatening.
The new A.I. forecasts are, by leaps and bounds, easier, faster, and cheaper to produce than the non-A.I. variety, using 1,000 times less computational energy. And, in most cases, these A.I. forecasts, powered by machine learning, are more accurate, too. Faster and cheaper forecast production means that poorer countries should be able to produce their own custom forecasts. A.I. is spurring a revolution in the world of meteorology, allowing forecasts that once required huge teams of experts and massive supercomputers to be made on a laptop. Faster and cheaper forecast production means that poorer countries without their own government weather offices or supercomputer access should be able to produce their own custom forecasts. But this approach also has potential drawbacks. Because it’s usually unclear how A.I. makes its decisions, its results can be hard to trust, meteorologists say. And as climate change increasingly pushes weather into previously uncharted territory, they add, the A.I. might fail. For now, meteorologists continue to need both kinds of forecasts:
Research is also rapidly advancing to expand the use of AI for forecasts weeks to months ahead, which helps farmers in making planting choices. AI models are already being tested for improving extreme weather prediction, such as for extratropical cyclones and abnormal rainfall.
_______
What is DL-NWP, and why does it matter?
A new class of AI techniques known as Deep Learning Numerical Weather Prediction (DL-NWP) is reshaping the future of forecasting. These models learn directly from historical weather data and observations, offering a powerful complement to traditional physics-based models.
At The Weather Company, DL-NWP isn’t viewed as a replacement for existing models, but as an accelerant. By integrating deep learning models alongside physics-based systems and advanced weather prediction algorithms, we can:
- Improve forecast skill and spatial detail
- Reduce potential biases
- Run more simulations faster and more cost-effectively
- Explore probabilistic outcomes with greater confidence
While these models exhibit great possibility, they also have limitations: They don’t necessarily have all the variables a conventional model generates, nor are the variables physically consistent with each other in the way they are in a conventional model. Each has their strengths and are best used as complements to one another. The focus is on applying DL-NWP at high resolution and local scale, where better forecasts have the greatest impact on safety, operations, and daily life.
The emergence of Deep Learning Numerical Weather Prediction (DLNWP) represents the most significant shift in this field in decades, allowing us to augment traditional physics based models with incredible speed and spatial resolution. By integrating these techniques with existing proprietary technologies, we can characterize the current state of the atmosphere with unprecedented precision.
_______
How accurately can AI predict weather?
The accuracy of AI weather prediction depends on various factors, including the quality and quantity of data available, the sophistication of the AI model, and the specific weather phenomenon being predicted. For example, as in any weather forecast, short-term AI-powered predictions (up to a few days) tend to be more accurate than long-term ones (weeks or months). However, in some cases, DL-NWP forecasts are more accurate in predicting long-term metrics than traditional models. Furthermore, because AI tools often rely on finding patterns in historical data, it remains difficult for them to predict rare or extreme weather events that don’t follow previous trends, which is part of why human meteorologists have such an important role to play.
_
Where do humans fit into an AI-driven forecast?
AI excels at speed, scale, and pattern recognition. Humans excel at judgment, accountability, and context. While AI plays a vital role in improving the accuracy and efficiency of weather prediction, humans remain essential for interpreting and communicating weather information effectively.
Human oversight is particularly vital during “black swan” events – rare weather scenarios that lack historical precedents in AI training sets. In these moments, the partnership between AI’s computational power and a meteorologist’s scientific intuition helps to ensure that the final intelligence is both accurate and trustworthy.
_______
_______
AI weather model deployment:
AI weather forecasting utilizes machine learning and historical data to analyze atmospheric patterns in seconds, providing rapid, high-resolution predictions that often outperform traditional numerical models. Leading AI systems are continually reshaping how meteorologists and individuals prepare for severe weather, offering advantages in speed, hyper-localized short-term accuracy, and long-term climate predictions.
Key platforms to monitor and use include:
-1. Google’s WeatherNext: Integrated directly into Google’s forecasting ecosystems, it utilizes machine learning from Google DeepMind to deliver improved medium-range predictions.
In a paper published in Nature, WeatherNext AI model has achieved state-of-the-art accuracy in predicting a cyclone’s track, intensity, and wind structure. On average, this model gives forecasters an extra day’s worth of predictive accuracy: this model’s three-day forecasts are as good as what prior models were able to provide for only the next two days.
How WeatherNext predicts weather and cyclones:
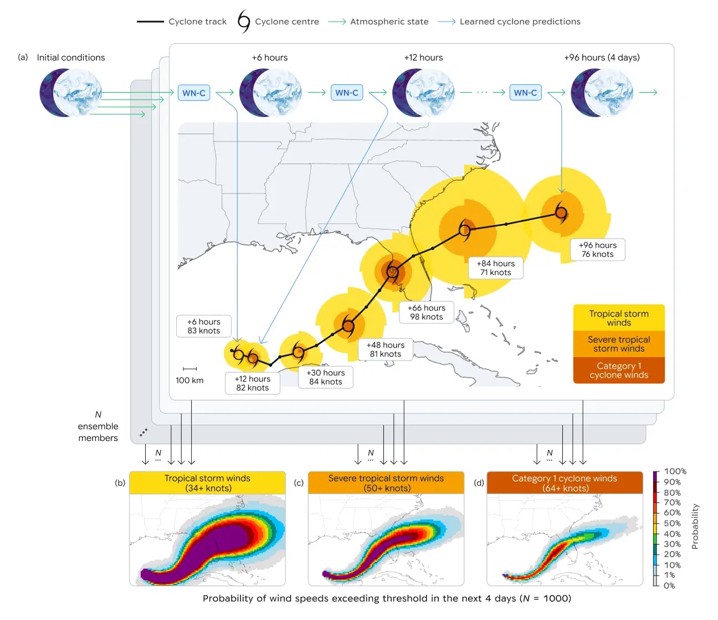
Starting from global atmospheric conditions during Hurricane Milton (October 2024), WeatherNext Cyclones iteratively predicts both global weather patterns and fine-scale cyclone tracks up to 15 days in advance. Running a 1,000-member ensemble generates localised probability maps of tropical storm to hurricane-force winds.
Predicting cyclones has typically forced a trade-off requiring two distinct modeling techniques. A cyclone’s track (where it goes) is steered by massive, global atmospheric currents, which before now have been best modelled by coarser global models. However, a cyclone’s intensity (how strong it gets) is driven by highly localized, fine-scale thermodynamic physical processes around its core, which are best modelled by specialized, higher resolution, local models.
WeatherNext model bridges this gap by improving forecasting for global weather overall as well as cyclones. It is a single AI model that predicts a tropical cyclone’s track, intensity, and wind structure with state-of-the-art accuracy. It achieves this breakthrough through a unique combination of its training, architecture and approach to low resolution inputs.
-2. NVIDIA Earth-2: Focused on climate and weather simulation, it is designed to deliver high-fidelity, hazardous weather forecasts up to 6 hours in advance.
-3. Rainbow Weather: A highly rated engine for short-term, minute-by-minute precipitation nowcasting.
-4. AIFS: The ECMWF AI weather model is called the Artificial Intelligence Forecasting System (AIFS), developed by the European Centre for Medium-Range Weather Forecasts (ECMWF). The AIFS is already outperforming the IFS forecasts in many of the standard forecast scores.
Note:
While AI drastically improves processing speed and pattern recognition, traditional physics-based models from organizations like the ECMWF still serve as essential tools for accurately predicting unprecedented, extreme record-breaking events.
____
NOAA deploys new generation of AI-driven global weather models in 2026:
The new suite of AI weather models includes three distinct applications:
- AIGFS (Artificial Intelligence Global Forecast System): A weather forecast model that implements AI to deliver improved weather forecasts more quickly and efficiently (using up to 99.7% less computing resources) than its traditional counterpart.
- AIGEFS (Artificial Intelligence Global Ensemble Forecast System): An AI-based ensemble system that provides a range of probable forecast outcomes to meteorologists and decision-makers. Early results show improved performance over the traditional GEFS, extending forecast skill by an additional 18 to 24 hours.
- HGEFS (Hybrid-GEFS): A pioneering, hybrid “grand ensemble” that combines the new AI-based AIGEFS (above) with NOAA’s flagship ensemble model, the Global Ensemble Forecast System. Initial testing shows that this model, a first-of-its kind approach for an operational weather center, consistently outperforms both the AI-only and physics-only ensemble systems.
_____
Aurora:
Aurora developed by a team of Microsoft researchers is a large-scale deep learning model that can predict global weather patterns and atmospheric processes like air pollution. It is a type of AI model called a foundation model, which means it was first trained on a huge amount of diverse weather and climate data to build general knowledge, and then fine-tuned to excel at specific prediction tasks. Aurora can produce high-resolution global forecasts much faster than traditional numerical weather models while matching or exceeding their accuracy.
Aurora achieves state-of-the-art performance in the following critical forecasting domains:
- 5-day global air pollution forecasts at 0.4° resolution, outperforming resource-intensive numerical atmospheric chemistry simulations on 74% of targets,
- 10-day global ocean wave forecasts at 0.25° resolution, exceeding costly numerical models on 86% of targets,
- 5-day tropical cyclone track forecasts, outperforming seven operational forecasting centres on 100% of targets, and
- 10-day global weather forecasts at 0.1° resolution, surpassing state-of-the-art NWP models on 92% of targets while improving performance on extreme events.
_
Skilful operational weather forecasting at 0.1° resolution:
Microsoft researchers selected weather forecasting at 0.1° resolution as their application of Aurora because of its operational importance, and the significant demands it places on data driven approaches in terms of the criticality of performance on extreme events and data-efficiency.
To accurately resolve high-impact weather events such as severe storms, hurricanes, and heatwaves, it is essential that weather prediction systems operate at a high resolution to better resolve, among other things, convective effects at smaller scales of motion. The Integrated Forecasting System [IFS-HRES; Malardel et al., 2016], the gold-standard and state-of-the-art numerical medium-term weather forecasting system, operates at
0.1° (approximately 11 km at the equator), at considerable computational cost. Current state-of-the-art artificial intelligence weather prediction (AIWP) models [Lam et al., 2023, Bi et al., 2023, Pathak et al., 2022, Chen et al., 2023a, Bonev et al., 2023] are designed to process and predict global weather states at 0.25° resolution, corresponding to approximately 28 km at the equator and a 2.5 × decrease in resolution compared to IFS-HRES. Adapting AIWP methods to 0.1° resolution faces a series of major hurdles [Chen et al., 2023b]. The most salient issue is that high-resolution training data is scarce only going back to 2016, when IFS was upgraded to 0.1° [Malardel et al., 2016]. Microsoft researchers demonstrate that Aurora can efficiently adapt to this data-scarce setting and surpass the forecasting skill of IFS-HRES under operational evaluation protocols.
________
________
Challenges and Limitations of AI-based Weather Models:
AI meteorology faces limitations related to training data biases, interpretability, and the lack of physical invariance in some models. Sparse Arctic buoy coverage, for example, can skew predictions for sea ice melt, creating errors in downstream forecasts. Weather model technology may hallucinate during unprecedented events, such as extreme floods or record-breaking storms, reducing trust among meteorologists. Black-box deep learning decisions can be technically accurate yet difficult to interpret, leading forecasters to ignore certain AI-generated recommendations. Several challenges persist in AI-based weather forecasting models in achieving optimal performance and accuracy.
_
-1. Limited, low-quality, low resolution data and small-scale forecasting:
The scarcity of high-quality, high-resolution historical meteorological data poses a significant obstacle to the effective application of AI in weather forecasting. Limited and low-quality datasets reduce the reliability of AI models by undermining both the training process and the validation of forecasting algorithms. The success of AI-based models fundamentally depends on training data and initial conditions that are diverse and accurate. Biases and inaccuracies often arise from uneven data coverage or changes in measurement techniques over time and space. For example, historical meteorological records may contain inconsistencies due to evolving sensor technologies or shifting environmental conditions. These factors diminish the representativeness of training data. Therefore, ensuring that AI-based models are trained on data that are high-quality, diverse, and representative is essential to reducing errors and improving forecast reliability.
_
Current SOTA AI-based weather models primarily rely on nearly four decades of ECMWF ERA5 data for both training and validation. For single-step forecasting, these models use ERA5 data as the initial condition. In multi-step forecasting, the process begins with ERA5 data at the initial time. The model then recursively uses its own previous predictions, which are generated at the same 0.25° (∼30 km) resolution, as input for subsequent time steps. This autoregressive approach represents a significant advancement. Nevertheless, the relatively coarse resolution of ERA5 limits the models’ ability to resolve small-scale atmospheric phenomena, particularly convection. Accurately predicting convection remains a major challenge because the ∼30 km resolution is insufficient to capture convective processes, which are key drivers of severe weather events such as thunderstorms (Gustafsson et al., 2018; Buschow et al., 2024). Without adequate resolution, forecasts struggle to represent small-scale dynamics that influence localized weather outcomes. This limitation highlights the urgent need to incorporate high-resolution, high-quality humidity data, at least in initial conditions, and ideally throughout all training and validation stages. Such data are critical for improving small-scale weather forecasts.
_
Current AI models typically rely on NWP outputs and their data assimilation pipelines, limiting their ability to fully replace conventional forecasting. Emerging data-driven models, such as Aardvark system, demonstrate promising results by learning direct mappings from raw observational data to forecasts, thereby reducing computational costs and complexity. However, these models face challenges including underperformance in predicting extreme weather events, reliance on ERA5 data for training, and the lack of standardized evaluation benchmarks.
__
-2. Explainability
AI-based models, particularly those used in weather forecasting, often face significant challenges related to explainability. They frequently function as “black boxes” with limited transparency. Understanding complex weather dynamics is essential for accurate forecasting. eXplainable AI (XAI) methods such as SHapley Additive exPlanations (SHAP), Local Interpretable Model-agnostic Explanations (LIME), and Gradient-weighted Class Activation Mapping (Grad-CAM) help improve transparency by clarifying how AI models generate their predictions (Bhattacharya, 2022; Yang et al., 2023; Van Zyl et al., 2024). These techniques enable meteorologists to identify patterns, evaluate correlations, and assess the relative influence of input variables. The opaque nature of many AI-based forecasting models raises concerns among meteorologists about their reliability and trustworthiness. When it is unclear how meteorological factors contribute to predictions or why certain results are produced, it becomes difficult to evaluate outputs critically or detect faulty correlations. XAI techniques, when used alongside standard statistical evaluation methods, provide an opportunity to demonstrate the reliability of AI-based weather models. By offering logical and verifiable explanations, XAI allows experts to validate model predictions against established meteorological knowledge, which fosters greater confidence in AI-based forecasts.
__
-3. Uncertainties and extreme weather prediction
Weather forecasts are inherently uncertain due to the complex and chaotic nature of the atmosphere. This uncertainty requires predicting a range of possible weather scenarios instead of relying on a single deterministic forecast. Recent AI-based weather models have improved forecast accuracy but mainly focus on deterministic predictions and often lack reliable uncertainty quantification. The GenCast model addresses this limitation by providing probabilistic forecasts that are both faster and more skilful than leading operational ensemble systems. This method captures forecast uncertainty effectively and improves decision-making in weather-sensitive fields. However, probabilistic approaches like this are not yet widely adopted in other AI-based models. One important benefit of ensemble-based weather forecasting is the opportunity to increase the accuracy of extreme weather predictions. Evaluation of AI-based models in extreme weather prediction remains incomplete. Despite progress in forecasting specific extremes such as hail size (Billet et al., 1997), tornadoes (Adrianto et al., 2009), and extreme precipitation (Radhika and Shashi, 2009; Herrmann and Schumacher, 2018), and improvements in forecasting tropical cyclone tracks and wind power production with GenCast, significant challenges still persist. Meteorologists also identify prediction of out-of-distribution severe weather events as a major problem for AI-based forecasting. In addition, as mentioned earlier, the quality and resolution of input data, especially initial conditions, are often insufficient for predicting convective-scale processes, which are key to many extreme weather events. Therefore, increasing the reliability and resolution of critical parameters such as humidity in the initial conditions could significantly enhance forecast skill.
__
-4. Temporal adaptation and generalization
Given the dynamic nature of atmospheric systems, forecasting models must continuously adapt to accurately capture changing weather patterns. Without mechanisms to address temporal dynamics, models risk becoming less effective, especially as environmental conditions deviate from historical norms. Ongoing refinement is essential to ensure precise and timely forecasts amid emerging climate trends. Moreover, AI models often face limitations in generalizing to unseen or extreme weather events beyond their original training data. This constraint reduces the robustness and reliability of such models, especially in critical scenarios where accurate prediction is paramount. Addressing these challenges by integrating temporal adaptation and enhancing generalization capabilities is crucial to advancing AI-based weather forecasting and improving its practical utility. Previous research has insufficiently addressed these critical aspects. To advance the field of weather forecasting, it is imperative that these oversights be rectified.
_
-5. Rare Weather Events are Hard to Predict:
Machine learning models are trained on historical weather patterns. But then what if the atmosphere does something entirely new? Due to climate change forced unprecedented conditions of weather patterns, a number of events do not have any historical data available for AI to learn from. To do this, researchers are creating a hybrid system by combining traditional physics-based forecasting models with AI to achieve both speed and scientific accuracy.
_
-6. AI doesn’t replace Meteorologists:
Despite rapid advances in AI, scientists stress that human forecasters remain essential. Tallapragada emphasizes that experienced meteorologists are still needed to interpret model data, understand local weather patterns, and recognize when forecasts may be wrong. He says, “I believe the role of human forecasters is even more important in these AI models.” Like other forms of artificial intelligence, weather AI can sometimes produce unrealistic or unreliable results. Tallapragada says, “We believe AI models can also hallucinate or produce something unphysical.” For example, researchers must ensure the systems do not generate impossible atmospheric conditions or unrealistic storm structures. Scientists are continuing to develop safeguards and “trustworthy AI” standards to catch those errors before forecasts reach the public. Tallapragada emphasized that AI should be viewed as another forecasting tool — not a replacement for meteorologists or traditional physics-based models.
_______
_______
Is AI-based model better than NWP model?
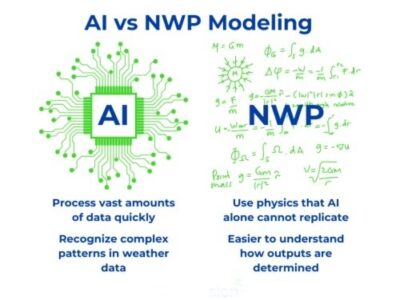
_
Physical models, of which currently operational weather forecasting models are an example, are built based on expert knowledge of the functioning of the system under study (the atmosphere, in the case of weather), most often translated into equations. These models have the advantage of being physically interpretable, but they remain approximations of the real system, limited by our understanding of the processes at play and by the constraints imposed by the computational resources.
AI models work in a very different way since they learn themselves, from very large datasets, the best statistical relationships, allowing them to move from the input data to the output data. Compared to physical models, AI models are less interpretable (often referred to as a “black box”) and do not offer a guarantee that physical laws will be respected, but they can make it possible to discover complex relationships that have not yet been understood or identified by scientists.
_
Traditional forecasting uses numerical weather prediction, which is based on physics equations and run on supercomputers. In contrast, Artificial Intelligence (AI) weather models use a vast amount of training data to identify patterns and develop accurate weather forecasts. Both traditional forecasting methods and AI models play valuable roles in predicting weather patterns, but they have different strengths based on time scale, required accuracy, and available forecast data. Organizations like the European Centre for Medium-Range Weather Forecasts (ECMWF) and the National Oceanic and Atmospheric Administration (NOAA) have begun combining both in their own forecasts. Each tool has its place in extreme weather prediction and operational decisions, showing that the future will embrace both methods.
_
Workflow comparison between traditional physics-based weather forecasting models and AI forecasting systems is depicted in figure below.
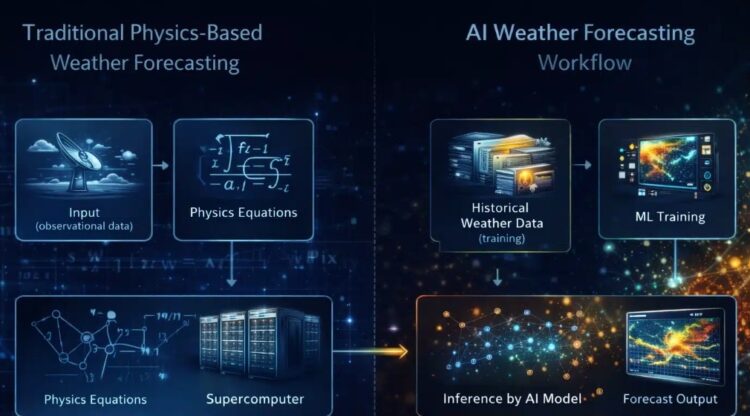
_
AI Advantages:
AI models offer advantages that traditional weather forecasting methods may lack:
- Data Processing Speed: AI can process vast amounts of data quickly, providing faster and more accurate forecasts. Traditional methods often involve manual data analysis and can be time-consuming.
- Pattern Recognition: AI excels in recognizing complex patterns in weather data. This capability allows AI to make more accurate predictions by understanding the nuanced interactions between different weather variables.
AI Limitations:
While AI offers numerous benefits, there are challenges and limitations in its application to weather forecasting:
- Data Biases: AI models can inherit biases present in the training data, leading to skewed predictions. Ensuring diverse and representative datasets can help mitigate this issue.
- Computational Resources: AI models require significant computational power and resources for training and deployment. Investing in robust infrastructure and optimizing models for efficiency can address this challenge.
- Understanding Physics: AI alone cannot fully understand the physics of weather systems, while NWP models can. AI models rely on data-driven approaches and may overlook fundamental physical principles governing atmospheric processes and therefore must be trained on NWP models.
- Black Box Problem: The decision-making process of AI models can be opaque, making it difficult to understand how outputs are determined. This lack of transparency can be a barrier to trust and acceptance among meteorologists and decision-makers.
_
During 2023’s Hurricane Lee, Google DeepMind’s GraphCast predicted the Nova Scotia landfall 9 days ahead of time, while the ECMWF’s model only determined landfall 6 days in advance.
DeepMind’s speed, hyperlocal support, and rapid update cycle were invaluable for protecting people and property. AI weather models are also more scalable, as algorithms can downscale or upscale as necessary.
While this demonstrated an AI model’s ability to forecast such events, it relies on large volumes of past data for training. Without this, it cannot produce its own predictions. Machine learning also struggles to predict rare extreme weather events like numerical weather prediction can because it does not run its own physics equations.
AI is highly valuable for operational weather forecasting, particularly for very short-term predictions that support immediate decision-making. By using training data to predict weather patterns, these models can provide a single forecast within seconds rather than hours.
Traditional forecasting models are stronger for predicting extreme weather events that require in-depth knowledge of atmospheric behavior. They are also better for long-range prediction, which can be very valuable for certain industry sectors. For example, if an event planner needs to know the weather for a given date in a year, a traditional model will provide a better prediction than an AI model.
Organizations like the NOAA and ECMWF are now combining numerical weather prediction and artificial intelligence to get the best of both worlds.
Physics models can train AI models on the subtleties of atmospheric physics, while AI can use inference to correct or enhance model outputs.
For example, ECMWF collaborated with Huawei Technologies and other meteorological agencies to create Pangu Weather, which was trained on decades of meteorological data to provide surprisingly accurate predictions for a range of weather scenarios. It is 10,000 times faster than supercomputers, offering almost immediate outputs.
However, Pangu still struggles with extreme weather forecasting, which is where traditional models can come into play. By using both, weather agencies can choose which option will provide the highest resolution for the given circumstances.
_
The Advantages of Incorporating AI with NWP Forecasting:
While AI and NWP models may have their shortcomings alone, together they significantly enhance weather forecasting in several ways. For example, while AI may not be able to understand physics alone, it can help advance NWP modeling by uncovering better parameterizations. AI technology can enhance the speed and accuracy of NWP. AI algorithms analyze vast datasets from satellites, weather stations, and other sensors to identify patterns and trends. By refining predictive models, AI leads to more accurate weather forecasts. For example, AI can improve the accuracy of temperature, precipitation, and wind predictions by learning from NWP models and continuously updating based on new information.
_______
ML weather forecasting works:
The performance of ML-based forecasts is now well documented in the peer-reviewed literature. Deterministic ML models have achieved medium-range skill comparable to state-of-the-art NWP, with anomaly correlation coefficients for upper-air fields surpassing or matching those of traditional models out to 10–15 days (Price et al., 2025; Lang et al., 2024). At ECMWF, the Artificial Intelligence Forecasting System (AIFS), implemented in 2025, produces medium-range forecasts using deep neural networks trained on reanalysis and operational data (Lang et al., 2024). AIFS runs alongside the physics-based model of the Integrated Forecasting System (IFS), providing deterministic and ensemble probabilistic forecasts that match or exceed the skill of traditional models in many metrics (Lang et al., 2024; Moldovan et al., 2025; Lang et al., 2025). Examples of performance scores are provided in Figure below, for a whole season.
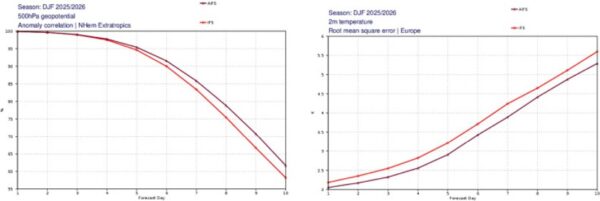
Figure above shows Comparative verification plots of forecast skill (anomaly correlation and root-mean-square errors) for traditional IFS in red and ML-based AIFS model in purple, illustrating lead time gains and improvements for 500hPa geopotential (first panel) and 2-meter temperature (second panel) averaged over the winter season 2025/2026.
Such improvements are highly significant in a field where advances are hard-won and have huge societal impact. For example, extending the useful forecast range by even a single day can provide earlier warnings for extreme weather, improve disaster preparedness, and enhance decision-making in sectors such as agriculture and energy (Venuti et al., 2025).
Examples where ML forecasts have worked
- Tropical Cyclone Tracks: AIFS surpasses the IFS in predicting the tracks of tropical cyclones, capturing both the timing and path of storms with high fidelity (Lang et al., 2024; Moldovan et al., 2025). In some cases, AIFS provided more consistent day-to-day forecasts, reducing the “jumpiness” that can challenge forecasters.
- Sudden Stratospheric Warming (SSW): These events affect surface weather patterns for weeks. During a major SSW event in 2025, the AIFS ensemble predicted the onset and intensity of the event earlier and with greater confidence than the traditional ensemble, with nearly half of ensemble members signalling the event seven days in advance compared to less than 10 % for the conventional system (Moldovan et al., 2025).
- Madden–Julian Oscillation (MJO): ML models have improved the forecast skill for the MJO, extending the useful range at weeks 3–4 in several systems (Chen et al., 2023).
- Heavy Rainfall Events: For day 5 forecasts of heavy rainfall (e.g., exceeding 10 mm/day), ML models have shown slightly better discrimination between rain and dry events, improving early warnings for high-impact precipitation (Moldovan et al., 2025).
- Ability of ML models to forecast out-of-distribution events: during a rare winter snowfall (U.S. Gulf Coast, Jan 2025), AIFS captured an extreme, out of distribution snowfall/blizzard for this specific region up to 10 days ahead, despite minimal analogues in the training record, demonstrating learned transfer beyond climatology. Similarly, ML models, when learning from strong storm events in only one oceanic basin, have been shown to skilfully forecast strong events in another “unseen” basin (Sun et al., 2025).
______
The Pangu-Weather A.I. system outperformed the conventional European model in predicting the path of 2018’s Typhoon Yutu.
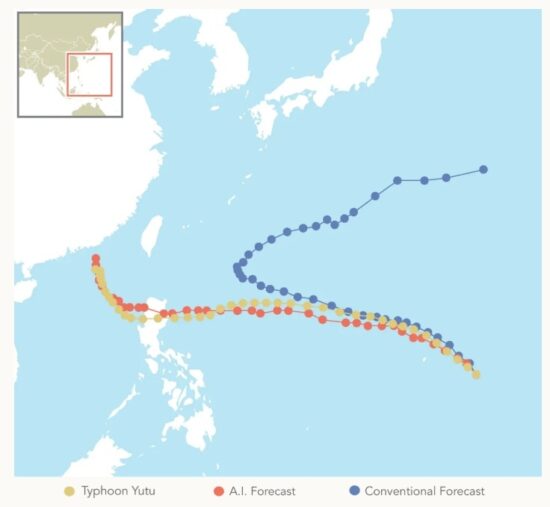
______
AI model Aurora correctly forecast four days in advance where and when Doksuri – the most costly typhoon ever recorded in the Pacific – would hit the Philippines.
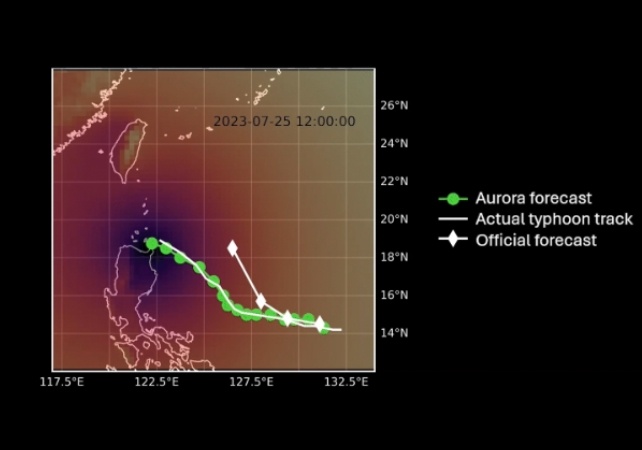
Aurora correctly predicts that Doksuri will make landfall in the Northern Philippines. Data showing the actual typhoon track is from the International Best Track Archive for Climate Stewardship project. Official forecasts at the time, in 2023, had it heading north of Taiwan.
______
______
Is NWP better than AI weather models?
Extreme weather events, such as floods, heatwaves and storms, drive hundreds of billions of dollars in damages every year through the destruction of cropland, impacts on infrastructure and the loss of human life. Many governments have developed early warning systems to prepare the general public and mobilise disaster response teams for imminent extreme weather events. These systems have been shown to minimise damages and save lives. For decades, scientists have used numerical weather prediction models to simulate the weather days, or weeks, in advance. These models rely on a series of complex equations that reproduce processes in the atmosphere and ocean. The equations are rooted in fundamental laws of physics, based on decades of research by climate scientists. As a result, these models are referred to as “physics-based” models.
However, AI-based climate models are gaining popularity as an alternative for weather forecasting.
Instead of using physics, these models use a statistical approach. Scientists present AI models with a large batch of historical weather data, known as training data, which teaches the model to recognise patterns and make predictions. To produce a new forecast, the AI model draws on this bank of knowledge and follows the patterns that it knows.
There are many advantages to AI weather forecasts. For example, they use less computing power than physics-based models, because they do not have to run thousands of mathematical equations. Furthermore, many AI models have been found to perform better than traditional physics-based models at weather forecasts.
However, these models also have drawbacks. AI models “depend strongly on the training data” and are “relatively constrained to the range of this dataset”. In other words, AI models struggle to simulate brand new weather patterns, instead tending forecast events of a similar strength to those seen before. As a result, it is unclear whether AI models can simulate unprecedented, record-breaking extreme events that, by definition, have never been seen before.
_
Record-breaking weather extremes, such as the 2021 Pacific Northwest, 2010 Russian and 2003 European heatwaves, and winter storms Lothar in 1999 and Kyrill in 2007, have caused numerous fatalities and severe impacts on society, the economy, and ecosystems. The level of disaster preparedness and adaptation to extreme events is strongly influenced by events observed in recent decades. Consequently, after extended periods without major events, or when events substantially exceed previous record levels, socioeconomic impacts tend to be particularly large.
_
In addition to long-term disaster preparedness, accurate physics-based numerical weather prediction (NWP) is critical for early-warning systems to save lives and reduce the impacts of climate extremes. Recently, a new generation of artificial intelligence (AI) weather models has reached and sometimes exceeded forecast skills of state-of-the-art physics-based NWP systems. These models offer considerable advantages in speed and energy efficiency, raising important questions about their potential to supplement or eventually replace traditional physics-based NWP systems. Models like GraphCast, Pangu-Weather, and Fuxi are already better than traditional physics-based climate models at predicting some daily weather conditions. However, they are far from perfect. A 2026 study ‘Physics-based models outperform AI weather forecasts of record-breaking extremes’ published in the journal Science Advances reports that AI often fails to predict record-breaking extreme weather events.
_
Thanks to our changing climate, extremes such as record heat waves and windstorms are becoming more frequent. Accurate warnings are vital to help protect lives, property, and infrastructure. However, the unprecedented nature of these events poses a problem for AI. To understand why, scientists pitted leading AI models against HRES (High Resolution Forecast), considered one of the world’s leading physics-based weather prediction systems. They first built a large database of record-breaking heat, cold, and wind events from 2018 and 2020. The researchers then checked the forecasts that HRES and the AI models had already made for those years to see which system got closest to the real-world outcomes. Their findings consistently show that current AI models underperform HRES in forecasting record-breaking events.
_
AI underestimating the risk:
For everyday weather forecasting, AI models were often more accurate and much faster than HRES. But in record-breaking events, HRES clearly outperformed artificial intelligence across all types. For example, during record-breaking heat waves, the AI models consistently predicted temperatures much lower than those observed as seen in figure below. Not only that, the more a record was broken, the less accurate the AI became.
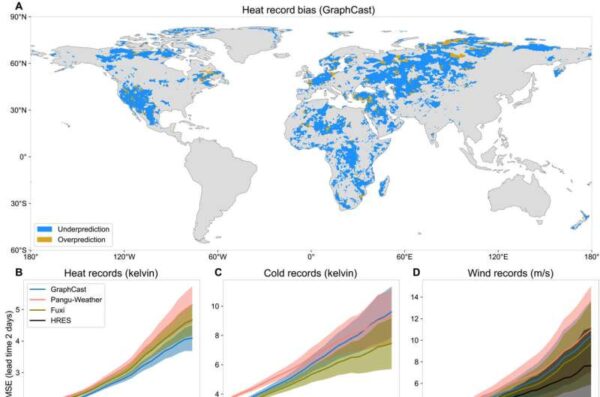
Figure above shows Forecast bias against record exceedance.
_
According to the scientists, the superiority of HRES in these high-stakes situations comes down to its reliance on the laws of physics. Because they never change, physics-based models can better simulate scenarios the world has never seen before. The AI models were dealing with events outside their training data and were trying to pull their forecasts back toward more typical historical averages.
“Our findings underscore the current limitations of AI weather models in extrapolating beyond their training domain and in forecasting the potentially most impactful record-breaking weather events,” commented the research team in their paper ‘Physics-based models outperform AI weather forecasts of record-breaking extremes’.
Given the expectation that extreme events will become more frequent in the coming years, the researchers caution against relying solely on AI for such important work. Instead, they suggest a hybrid approach that combines the speed of AI with the strong foundation of the fundamental laws of physics.
_______
_______
Hybrid weather model combines NWP with AI:
Google’s new weather prediction system combines AI with traditional physics in 2024:
Weather and climate experts are divided on whether AI or more traditional methods are most effective. In this new model, Google’s researchers bet on both. Researchers from Google have built a new weather prediction model that combines machine learning with more conventional techniques, potentially yielding accurate forecasts at a fraction of the current cost. The model, called NeuralGCM and described in a paper in Nature, bridges a divide that’s grown among weather prediction experts in the last several years. NeuralGCM is a hybrid weather and climate model developed by Google Research and Caltech that combines traditional physics-based atmospheric equations with machine learning.
_
While new machine-learning techniques that predict weather by learning from years of past data are extremely fast and efficient, they can struggle with long-term predictions. General circulation models, on the other hand, which have dominated weather prediction for the last 50 years, use complex equations to model changes in the atmosphere and give accurate projections, but they are exceedingly slow and expensive to run. Experts are divided on which tool will be most reliable going forward. But the new model from Google instead attempts to combine the two.
_
“It’s not sort of physics versus AI. It’s really physics and AI together,” says Stephan Hoyer, an AI researcher at Google Research and a coauthor of the paper. The system still uses a conventional model to work out some of the large atmospheric changes required to make a prediction. It then incorporates AI, which tends to do well where those larger models fall flat—typically for predictions on scales smaller than about 25 kilometers, like those dealing with cloud formations or regional microclimates (San Francisco’s fog, for example). “That’s where we inject AI very selectively to correct the errors that accumulate on small scales,” Hoyer says.
_
The result, the researchers say, is a model that can produce quality predictions faster with less computational power. They say NeuralGCM is as accurate as one-to-15-day forecasts from the European Centre for Medium-Range Weather Forecasts (ECMWF), which is a partner organization in the research.
But the real promise of technology like this is not in better weather predictions for your local area. Instead, it’s in larger-scale climate events that are prohibitively expensive to model with conventional techniques. The possibilities could range from predicting tropical cyclones with more notice to modeling more complex climate changes that are years away. It’s so computationally intensive to simulate the globe over and over again or for long periods of time. That means the best climate models are hamstrung by the high costs of computing power, which presents a real bottleneck to research. AI-based models are indeed more compact. Once trained, typically on 40 years of historical weather data from ECMWF, a machine-learning model like Google’s GraphCast can run on less than 5,500 lines of code, compared with the nearly 377,000 lines required for the NWP model from the National Oceanic and Atmospheric Administration.
_______
_______
Section-14
Communicating weather forecast:
The National Weather Service of the United States and the Atmospheric Environment Service of Canada issue weather forecasts, watches, warnings, and advisories to the public through regional forecast offices. The public accesses this information through radio and television broadcasts, newspapers, and the Internet.
When hazardous weather threatens, forecasters issue outlooks, watches, warnings, and advisories. An outlook provides advance notice of a general weather trend. For example, the outlook for spring flooding due to expected snowmelt is usually available many weeks in advance. A weather watch is issued when hazardous weather is possible based on current or predicted atmospheric conditions. A weather warning applies when hazardous weather is taking place nearby. Watches and warnings are issued for severe thunderstorms, tornadoes, floods, hurricanes, and winter storms, such as blizzards and ice storms.
Weather advisories refer to expected weather hazards that are less serious than those covered by a warning. An example is a winter weather advisory.
Weather advisories are also issued for low wind chill temperatures and for a high heat index. Wind chill is a measure of the cooling power of a combination of low air temperature and strong winds. Even if the air temperature remains constant, the human body loses increasing amounts of heat to the environment as wind speed increases. At low wind chill temperatures, people need to take special precautions to prevent frostbite (the freezing of skin tissue) and hypothermia (a dangerous drop in body temperature).
Heat index is a measure of the stress produced by a combination of high air temperature and high relative humidity. During excessively hot and muggy weather, the human body may not be able to release sufficient heat to prevent hyperthermia (a dangerous rise in body temperature). High humidity reduces the rate at which perspiration evaporates from the skin’s surface. The cooling that accompanies this evaporation represents one of the body’s main ways to release heat.
__
National Weather Service issues forecasts for sky condition, temperature, wind, and precipitation probability on a routine basis. Because the weather is always changing, the terminology used in these forecasts is also quite variable. The amount of information contained in weather reports varies considerably. The most straightforward and brief weather report provides only one piece of information: the current temperature. This is the sort of report that is frequently broadcast on the radio. Additionally, more thorough weather reports include data on precipitation, wind speed and direction, relative humidity, and air pressure, among other things.
_
Elements which are covered under Weather Forecast:
-1. Rainfall
-2. Temperature
-3. Thunder storm, Dust storm
-4. Clouds
-5. Cyclonic Storms (their courses and stages)
-6. Heavy Rainfall Warnings
-7. Frost Warning
-8. Squall Warning
-9. Heat Waves, cold waves etc.
_
Weather circles:
A weather circle provides five pieces of information about the weather in a location:
- temperature
- precipitation
- wind speed
- wind direction
- cloud coverage
They display information observed from many different weather stations, aeroplanes, balloons and satellites. The information is put into categories with symbols used to show the different types of weather.
_
Successful Weather Service:
A weather service is successful when recipients:
-Receive the weather forecast;
-Understand the information presented;
-Believe the information;
-Personalize the information;
-Make correct decisions; and,
-Respond in an adequate manner,
-Feedback, lessons learnt.
_
Prime Users:
- General Public
- Agricultural Sector
- Aviation and Navigation Sectors.
- Fisheries Operations
- Construction Business
- Transportation
- Defense Services
- Mountaineering and Tourism.
- Energy Sector etc
______
Anatomy of weather forecast:
Forecasters are tasked with synthesizing observations, output from numerical weather prediction (NWP) models, scientific theory, and experience-based intuition to arrive at a forecast. Whether in the public or private sector, these forecasts are often made collaboratively among teams of meteorologists that routinely integrate new information as it becomes available. Forecasters are also increasingly responsible for effectively communicating forecasts and anticipated impacts to end users and stakeholders in collaboration with affected sectors.
_
Analyses of weather data:
Weather forecasting begins with an analysis of the current state of the atmosphere, ocean, and land surface. Reliable observations drawn from many platforms, including satellites, radar, weather balloons, surface stations, and aircraft (both crewed and uncrewed) are crucial for generating accurate analyses. Because forecast quality is partially reliant on the quality of the underlying analysis, scientists continue to develop techniques to integrate observations into four-dimensional model representations of the Earth system. In addition to their vital role in weather forecasting, these analyses support scientific investigations designed to help develop improved weather prediction tools and techniques.
_
Forecast techniques:
Meteorologists have traditionally used their intuition and available observations to create forecasts up to a few hours ahead of time. Thorough human diagnosis of some complex scenarios, such as severe-thunderstorm environments, remains necessary to optimize situational understanding and to make and communicate high-quality forecasts. In addition, rapidly updating numerical models, as well as statistical tools and artificial intelligence–based models that blend observations with NWP outputs, are increasingly used to make short-term forecasts, whether those issued by official forecast agencies or those available through popular smartphone applications.
Beyond a few hours ahead of time, NWP has long been the dominant forecasting tool. Modern NWP models start from an initial analysis of meteorological conditions produced through data assimilation and then apply the physical and dynamical equations that govern atmospheric evolution to predict the weather. Such models are continuously developed and collaboratively maintained by multiple entities. Despite their increasing skill and ability to depict progressively smaller-scale phenomena, NWP models are imperfect. Model shortcomings exist due to limited observations, imperfect data assimilation methods, and the approximations required to represent small-scale physical processes such as energy exchanges between the surface and atmosphere as well as phase changes of water. Approaches such as statistical bias correction, model blending, ensemble forecasts, and artificial intelligence/machine learning are increasingly used to mitigate NWP models’ shortcomings while improving forecast skill.
_
Role of humans:
Forecasters apply their expertise to create forecasts by interpreting and adding meaning to the abundant and complex data and information drawn from observations and NWP. Humans add value to the forecast process by utilizing this expertise and maintaining situational awareness, which can build trust and deepen valuable relationships with end users while creating a solid foundation for the enhanced communication of predicted weather impacts.
The effective translation of a forecast relies on three key dimensions: 1) scientific understanding and information interpretation; 2) data access and the skilled use of forecast tools; and 3) an understanding of the needs of the diverse community of end users reliant upon weather information, developed through ongoing collaboration between forecasters and end users. Forecasters must frequently interact with and gain understanding of stakeholders, end users, and partners. This enables weather information to be tailored to user needs and enables users to be more engaged in the dissemination process. In addition, forecasters must devote time to completing training, reviewing best practices, and engaging local communities to learn how to best communicate actionable forecast information underpinning life- and property-saving decisions.
Humans are not necessarily involved with all forecasts that are disseminated to end users. For example, many popular smartphone applications provide users with accessible, often graphically appealing forecasts drawn from computer-based weather prediction systems. Furthermore, private- and public-sector forecast entities increasingly rely on computer-based weather prediction systems to develop a baseline forecast that humans are primarily responsible for disseminating and communicating rather than making themselves. Humans’ roles in the forecast process are likely to continue to evolve toward communication as predictive abilities continue to improve.
_
Forecast dissemination and communication:
As technology improves, methods for disseminating weather information and forecasts continue to evolve. For example, location-specific information including hourly forecasts, storm-based severe weather warnings, and radar data now can be directly delivered to smartphones and other smart devices. Forecasters must also consistently collaborate with end users and stakeholders to better optimize forecast dissemination methods and tools.
Forecast products have historically provided users with the best estimate of what may potentially happen, such as high temperature and snowfall amounts. However, because users often consider the range of possible scenarios beyond just the most likely outcome when evaluating risk, they also require forecast confidence and uncertainty information to make optimal decisions to protect life and property. Since each user’s requirements are unique to their specific operations, optimal decision-making requires effective and continual communication between forecasters and users. Recent advances in forecast skill and technology allow for increasingly reliable, although still imperfect, uncertainty information to be provided to end users.
_______
Dissemination and Communication: Key Components of Warning System:
- Effective dissemination:
-Need to cover as large an audience as possible:
-Backups and redundancies
-Must reach Hazards Community
- Media: indispensable partner in warning process; multiple channels:
-Traditional (TV, Radio, Sirens, Public Address systems etc.)
-mobile and Social networking (Email, SMS, Web, face book)
- Public education: to avoid reinterpretation (FAQs, Do’s and Don’t are published along with leaflets on specific hazards)
_
Warning Dissemination service:
Dissemination mode
- Websites
- Internet (e-mail),
- Telephone,
- Mobile Phones (SMS),
- Satellite based warning dissemination System,
- Global telecommunication system,
- Radio (AM, FM, Community Radio,
- TV (Govt and Private TV),
- Social media (Mobile apps, Facebook and Tweeter)
______
Weather Broadcasts:
The first-ever daily weather forecasts were published in The Times on August 1, 1861, and the first weather maps were produced later in the same year. In 1911, the Met Office began issuing the first marine weather forecasts via radio transmission. These included gale and storm warnings for areas around Great Britain. In the United States, the first public radio forecasts were made in 1925 by Edward B. “E.B.” Rideout, on WEEI, the Edison Electric Illuminating station in Boston. Rideout came from the U.S. Weather Bureau, as did WBZ weather forecaster G. Harold Noyes in 1931.
_
The world’s first televised weather forecasts, including the use of weather maps, were experimentally broadcast by the BBC in November 1936. This was brought into practice in 1949, after World War II. George Cowling gave the first weather forecast while being televised in front of the map in 1954. In America, experimental television forecasts were made by James C. Fidler in Cincinnati in either 1940 or 1947 on the DuMont Television Network. In the late 1970s and early 1980s, John Coleman, the first weatherman for the American Broadcasting Company (ABC)’s Good Morning America, pioneered the use of on-screen weather satellite data and computer graphics for television forecasts. In 1982, Coleman partnered with Landmark Communications CEO Frank Batten to launch The Weather Channel (TWC), a 24-hour cable network devoted to national and local weather reports. Some weather channels have started broadcasting on live streaming platforms such as YouTube to reach more viewers.
______
Weather apps:
A weather app is a software program on a phone, computer, or watch that gives current conditions and forecasts for the atmosphere. Weather apps rely on global networks of satellites, weather stations, buoys, and aircraft to collect data, which is then processed by supercomputers running predictive models. Accuracy varies by app due to differences in computer simulations, resolution, and forecasting algorithms. Studies show the Met Office app is slightly more accurate for temperature forecasts than the BBC Weather app, while BBC Weather may perform better for rain prediction. Both apps tend to over-predict rain slightly, but overall, modern apps provide highly reliable forecasts, with four-day forecasts today as accurate as 24-hour forecasts 30 years ago.
_
Finding the most accurate and reliable one can be a challenge. With various options boasting different features and capabilities, making the right choice becomes crucial. There are three top contenders: AccuWeather, Weather Underground, and The Weather Channel.
AccuWeather:
AccuWeather is renowned for its detailed and accurate forecasts, making it a popular choice among users. Its standout features include MinuteCast, which offers minute-by-minute precipitation forecasts localized to your exact location, and RealFeel Temperature, providing a more accurate indication of how the weather truly feels outside. Additionally, the app offers severe weather alerts and interactive weather maps for comprehensive weather tracking.
Weather Underground:
Weather Underground stands out for its unique approach, sourcing data from a vast network of personal weather stations for hyper-local forecasts. Users benefit from detailed and precise weather information, including air quality, UV index, and flu outbreaks. The app’s interactive weather maps and crowd-reporting feature enhance its reliability and usability.
The Weather Channel:
As one of the most recognizable names in weather forecasting, The Weather Channel offers comprehensive weather information with detailed forecasts, severe weather alerts, and interactive radar maps. Its additional features, such as allergy and flu reports, cater to health-sensitive users. Despite occasional ads and performance concerns, the app remains a reliable choice for staying informed about weather conditions.
Choosing the Best Weather App for You:
While accuracy is a key factor in selecting a weather app, individual preferences and needs also play a significant role. Consider factors such as location precision, frequency of updates, and additional features like air quality reports or integrations with other services.
Remember, the “best” weather app is subjective and depends on what matters most to you. Whether it’s reliability, user interface, or specialized features, prioritize what aligns with your requirements and preferences.
_______
Stay Safe during Severe Weather:
To stay safe during severe weather, move to a basement or a small interior room on the lowest floor away from windows immediately.
Before the Storm:
- Stay informed: Monitor local news or weather alerts on your phone or a battery-operated radio.
- Secure your yard: Move patio furniture, trash cans, and loose items indoors so the wind does not blow them away.
- Prepare a kit: Keep flashlights, extra batteries, a first-aid kit, and a charged phone ready.
During the Storm:
- Stay inside: Keep away from exterior walls, doors, and glass windows.
- Avoid plumbing and electronics: Do not use corded phones, take a bath, or shower, as metal pipes and wires can conduct lightning. Unplug sensitive appliances to prevent damage from power surges.
- Protect yourself: Use heavy blankets, pillows, or a helmet to shield your head and body from flying debris if a tornado or high winds strike.
- Never drive through water: Turn around if you see flooded roads. Just six inches of moving water can make you lose control of your car.
After the Storm:
- Watch for hazards: Stay away from downed power lines and flooded areas.
- Listen to authorities: Do not return to evacuated areas or damaged zones until officials give the all-clear.
_
The safest way to drive in heavy rain is to slow down, increase your following distance, and turn on your low-beam headlights. Do not start a car that has been submerged in water, as doing so can cause permanent, catastrophic engine damage.
______
______
Moral of the story:
_
-1. Atmosphere:
Atmosphere is the envelope of gases surrounding Earth held in place by gravity; and divided into layers: troposphere, stratosphere, mesosphere, thermosphere, and exosphere. The Earth’s atmosphere is the origin of the weather phenomena studied in meteorology. Atmospheric composition, temperature, and pressure vary across a series of distinct sublayers including the troposphere and stratosphere. Most of the atmosphere is concentrated at the bottom and, in fact, 3/4 of the mass of the atmosphere is located within the lowest 11 kilometers/7 miles. Almost all weather occurs within this lowest part of the atmosphere called the troposphere.
By mole fraction (i.e., by quantity of molecules), dry air contains 78.08% nitrogen, 20.95% oxygen, 0.93% argon, 0.04% carbon dioxide, and small amounts of other trace gases. Air also contains a variable amount of water vapor, on average around 1% at sea level, and 0.4% over the entire atmosphere.
_
-2. Atmospheric circulation:
Atmospheric circulation is the large-scale movement of air that distributes heat and moisture across the Earth, driving global climate and day-to-day weather systems. It is powered by uneven solar heating, air pressure differences, and the rotation of the Earth. The atmospheric circulation can be viewed as a heat engine driven by the Sun’s energy. The strong temperature contrast between polar and tropical air gives rise to the largest scale atmospheric circulations: the Hadley cell, the Ferrel cell, the polar cell, and the jet stream. These interacting convective loops shape global wind belts, precipitation patterns, and climate zones. The westerlies and trade winds are also part of the Earth’s atmospheric circulation.
_
-3. Weather:
Weather is the state of the atmosphere at a specific time and location, determined by a combination of variables: temperature, humidity, air pressure, wind speed and direction, cloud cover, and precipitation. Together, these variables (components) describe the weather at any given time. These variables (parameters) are in constant motion and interaction, differing between one place and another, and changing from minute to minute, hour to hour, and day to day. Most weather occurs in the troposphere, or the lowest layer of the atmosphere. This is the restless arena where warm and cold air masses collide, where clouds form and dissipate, where storms gather their strength. The troposphere’s depth varies. Near the equator, it can be as thick as 15 kilometers; near the poles, it’s only about 8 kilometers.
Weather is primarily driven by the uneven heating of Earth’s surface by the Sun, which creates differences in temperature, air pressure, and moisture. Uneven heating occurs due to the planet’s curved shape, tilt and rotation as well as different earth surfaces (such as oceans, lands, forests, ice sheets, or human-made objects) have differing physical characteristics such as reflectivity, roughness, or moisture content. Additionally, weather phenomena like clouds and precipitation itself cause uneven heating. All weather is caused by interaction of solar energy with Earth’s air, water, and land; but gravity also plays important role by reducing pressure as altitude increases which is responsible for adiabatic lapse rate and gravity pulls cold dense air down and releases warm light air to rise.
Weather system is an organized set of atmospheric conditions—such as wind, pressure, temperature, and moisture—that interact to create specific weather patterns over a region. For example, high/low pressure, fronts etc.
_
-4. Seasons:
Season is any division of the year marked by changes in weather, ecology, and the duration of daylight. Seasons result from the Earth’s orbit around the Sun and its 23.5-degree axial tilt relative to the ecliptic plane. In temperate and polar regions, four calendar-based seasons – spring, summer, autumn, and winter – are generally marked by significant changes in the intensity of sunlight that reaches the Earth’s surface; these changes become less dramatic as one approach the Equator, and so many tropical regions have only two or three seasons, such as a wet season and a dry season. In certain parts of the world, the term is also used to describe the timing of important ecological events, such as hurricane seasons, flood seasons, and wildfire seasons.
A monsoon season is a major shift in wind direction that brings a long period of heavy rain to tropical and subtropical regions. It happens because land heats up faster than the ocean in the summer. This draws cool, wet air from the sea onto the land. A monsoon is most powerful in the south and east Asia, because the Asian Continent is the world’s largest land-mass.
_
-5. Weather versus climate:
Weather is the state of the atmosphere at a particular location over the short-term. Climate is the average of the weather patterns in a location over a longer period of time, usually 30 years or more. The main difference between weather and climate is the measure of time. Weather can change quickly, from one moment to the next and over short distances. It can be raining one minute, and snowing the next. It can be pouring on one side of town and sunny on the other. Climate, on the other hand, changes more slowly. It is possible for the weather to be different from that suggested by the climate. More importantly, a change in climate can lead to changes in weather patterns. Scientists determine a region’s climate by examining its vegetation, average monthly and annual temperature, and average monthly and annual precipitation.
_
-6. Severe weather and extreme weather:
Severe weather means any dangerous atmospheric event that poses a risk to human life, causes damage to property, or disrupts normal public activities; and requires intervention by authorities. There are many types of severe weather, including strong winds, heat waves, excessive precipitation, thunderstorms, tornadoes, tropical cyclones, blizzards, and wildfires.
Extreme weather is any weather that is unexpected, unusual, unpredictable, unseasonal, record-breaking or especially severe (i.e. weather at the extremes of an historical distribution).
An event can be severe without being statistically record-breaking, and an extreme event (like an unseasonal multi-month drought) may not trigger a short-term “severe weather” thunderstorm warning.
_
-7. Tropical weather and Extratropical (at higher latitudes) weather:
There are two reasons why tropical weather is different from that at higher latitudes. The sun shines more directly on the tropics than on higher latitudes (at least in the average over a year), which makes the tropics warm. And, the vertical direction (up, as one stands on the Earth’s surface) is perpendicular to the Earth’s axis of rotation at the equator, while the axis of rotation and the vertical are the same at the pole; this causes the Earth’s rotation to influence the atmospheric circulation more strongly at high latitudes than low. The Coriolis force is maximum at the poles and zero at the equator because it depends on the sine of the latitude, meaning the effective rotation component acting sideways on horizontal motion increases from zero at the equator to its full value at the poles.
Because of these two factors, clouds and rain storms in the tropics can occur more spontaneously compared to those at higher latitudes, where they are more tightly controlled by larger-scale forces in the atmosphere. Because of these differences, clouds and rain are more difficult to forecast in the tropics than at higher latitudes. On the other hand, temperature is easily forecast in the tropics, because it doesn’t change much.
_
-8. Weather observations come from many different sources, including land-based observation stations, radar systems, weather balloons, airplanes, ships, and satellites. Currently, there are well over 10000 land-based manned and automatic surface weather stations, 1000 upper air stations (weather balloons with radiosondes), 7000 ships, 100 moored and 1000 drifting buoys, hundreds of weather radars and 3000 specially equipped commercial aircrafts that measure key parameters of the atmosphere, land and ocean surface every day. Additionally, there are some 30 meteorological and 200 research satellites in the global network for meteorological, hydrological and other geophysical observations. Each day in the United States over 210 million weather observations are processed and used to create weather forecasts.
_
-9. Gravity:
Of the factors influencing atmospheric behavior, gravity is the single most important one. The atmosphere is contained by the gravitational field of the planet, which prevents atmospheric mass (gases) from escaping to space. Because it is such a strong body force, gravity determines many atmospheric properties.
Most immediate is the geometry of the atmosphere. Atmospheric mass is concentrated in the lowest 10 km—less than 1% of the planet’s radius. Gravitational attraction has compressed the atmosphere into a shallow layer above the earth’s surface, in which mass and constituents are stratified vertically. Through stratification of mass, gravity imposes a strong kinematic constraint on atmospheric motion. Circulations with dimensions greater than a few tens of kilometers are quasi-horizontal, so vertical displacements of air are much smaller than horizontal displacements. Under these circumstances, constituents like water vapor and ozone fan out in layers or “strata.” Vertical displacements are comparable to horizontal displacements only in small-scale circulations like convective cells and fronts, which have horizontal dimensions comparable to the vertical scale of the mass distribution.
Atmospheric pressure decreases with altitude because gravity pulls most air molecules close to the Earth’s surface, leaving fewer air molecules and less weight pressing down from above at higher elevations.
Gravity also pulls cold dense air down and releases warm light air to rise. The cycle of warm air going up and cold air going down creates convection currents, which drive weather patterns and circulate heat.
_
-10. Pressure and Temperature:
The mass of the column of the atmosphere above any point is measured by atmospheric pressure. For instance, when a weather map says the pressure is 1010 millibars, that means that the weight of the column of air above that point is about 1010 millibars or 14.6 pounds per square inch. Pressure drops off rapidly with altitude to the point where once you reach 15 kilometers, only 10% of the pressure remains (or about 1.5 pounds per square inch).
Atmospheric temperature is a measure of the thermal energy or average kinetic energy of air molecules in the Earth’s atmosphere. Air temperature generally decreases with altitude in troposphere.
_
-11. Relationship between pressure, temperature, density and humidity in atmosphere (troposphere):
(1. There are various mechanisms by which air rises. Heated by sunshine warmed air starts to rise because, when warm, it is lighter and less dense than the air around it. Air rises when wind blows into the side of a mountain range or other terrain and is forced upward, higher in the atmosphere. Air is also forced upward at areas of low pressure system where pressure is lower than in surrounding areas. Air also rises when two large masses of air collide at the Earth’s surface. Air cools as it rises because air pressure decreases with altitude. As a pocket of air goes higher, less air weighs down from above, allowing the parcel to expand. This expansion uses up energy, which drops the temperature of the air through a process called adiabatic cooling. Higher altitudes are typically cooler than lower altitudes, which is the result of higher surface temperature and radiational heating, which produces the adiabatic lapse rate.
(2. Warm air rises and cold air sinks because of differences in density and gravitational displacement caused by temperature. Heating air gives its molecules more energy, making them move much faster. Fast-moving molecules bounce off each other and spread further apart. This expansion means fewer molecules fit into the same amount of space, making the warm air lighter or less dense than the cooler air around it. Gravity pulls heavily on the dense, cold air surrounding the warm air. The heavier, cooler air slides underneath the warm air and pushes it upward. Because cold air packs tightly together and has a higher density, gravity pulls it down toward the ground. This continuous cycle of warm air going up and cold air going down creates convection currents, which drive weather patterns and circulate heat.
The pressure of a given amount of gas is directly proportional to its absolute temperature, provided that the volume does not change. However, atmospheric pressure and temperature are inversely related in the open atmosphere because warming air expands, becomes less dense, and rises to create low surface pressure. Cold air is relatively dense — that is, it has more air molecules per unit volume – and it sinks, forming high pressure.
While you may often hear wet, humid weather described as “heavy”, counterintuitively, humid air is less dense than dry air. This is because water vapor molecules actually weigh less than the oxygen or nitrogen molecules they replace. The impact, however, is relatively small.
In a nutshell, warm humid air rises, cold dry air sinks.
(3. Higher atmospheric pressure squeezes molecules closer together, which increases air density. Lower pressure allows molecules to spread out, reducing density. Temperature and air density have an inverse relationship, meaning that when air temperature goes up, air density goes down. Heat gives air molecules high energy. They move fast and spread far apart. This expansion means fewer molecules fit in the same volume, creating lower density. Cold removes energy from molecules. They move slowly and pack tightly together. More molecules fit into that same space, creating higher density.
Both air pressure and air density decrease as you climb higher because there is less air pressing down from above and gravity holds fewer molecules near the surface.
(4. Temperature and relative humidity share an inverse relationship: as air temperature goes up, relative humidity goes down, assuming the actual amount of water vapor stays the same. Warm air can hold more water vapor than cool air. Warmer air has more energy and a larger capacity to hold water vapor than cold air. Cooler air holds less moisture, meaning even a small amount of water vapor can result in a high relative humidity percentage. The higher the temperature, the more moisture the air can contain. For example, at zero degrees Celsius, a cubic meter of air can’t contain more than five grams of moisture. At fifteen degrees, it is up to thirteen grams. Saturation vapor pressure increases non-linearly as temperature rises. Warm air has a significantly higher saturation vapor pressure—and can hold much more water vapor—than cold air. Air pressure has no direct effect on relative humidity but humid air is actually less dense than dry air causing a very small drop in air pressure.
(5. The dew point is the temperature to which air must be cooled to become completely saturated with water vapor and begin forming condensation. Condensation in the atmosphere is the process where invisible water vapor (gas) turns into liquid water droplets or ice crystals. The dew point is always equal to or lower than the air temperature, representing the exact temperature to which air must be cooled to become fully saturated with water vapor. The difference between the air temperature and the dew point is called the “spread”. A small spread means the air is humid and close to saturation, which often leads to fog or dew. A large spread indicates dry air.
(6. A sea breeze is a cool wind that blows from the sea to the land during the daytime. The sun warms both the land and the water, but land heats up much quicker than water. The air above the land gets hot, becomes lighter, and rises into the atmosphere. This creates a low-pressure area over the land. Cooler, heavier air sitting over the sea rushes in toward the land to fill the empty space, creating a refreshing sea breeze. After the sun sets, the land loses its heat quickly, while the sea retains heat longer. The air above the now-cooler land becomes cool and dense, creating a high-pressure zone. The air above the sea is warmer and rises, creating a low-pressure area, which causes the wind to blow from the land out toward the sea.
Note:
Temperature, pressure, density and humidity interact in complex, nonlinear ways. This means small changes do not simply add up; they interact, amplify, or cancel out in unpredictable ways. Nonlinear interactions between temperature, pressure, density, humidity, and other variables make forecasting complex.
_
-12. Wind:
Wind is the movement of air in horizontal direction, caused by differences in pressure, affected by Earth’s rotation and friction. Wind forms because of differences in temperature and atmospheric pressure between nearby regions. Winds tend to blow from areas of high pressure, where it’s colder, to areas of low pressure, where it’s warmer. Wind occurs on a wide range of scales, from very strong thunderstorm flows lasting tens of minutes to milder local breezes lasting a few hours to global atmospheric circulations caused by the differential heating of the Equator and the poles and the Earth’s rotation. Winds are often referred to by their strength and direction; the many types of wind are classified according to their spatial scale, their speed, the types of forces that cause them, the regions in which they occur, and their effects.
_
-13. Precipitation:
Precipitation is any product of the condensation of atmospheric water vapor in the clouds that falls by gravity, the main forms of which include rain, sleet, snow, hail, and graupel.
Clouds usually form where air moves upward. As air ascends, it encounters lower and lower pressure. Air responds to lower pressure by expanding. Whenever gases expand, they cool. As air cools, its relative humidity increases until it reaches saturation and clouds form. Where air moves downward, clouds usually do not develop. Descending air is compressed, it warms up, and its relative humidity decreases. Saturation is not possible, and so clouds do not form.
_
-14. Low pressure and high pressure:
We often hear the terms high pressure and low pressure in weather reports. Low pressure means that the atmospheric pressure of a region is lower than the surrounding area; when the situation is reversed, it is called high pressure. Therefore, the designation of high and low pressure is only relative.
Lows are areas of relatively low air pressure. The winds in a low pressure system bring contrasting air masses together to form fronts. For this reason, lows are sometimes described as the chief weather-makers of regions in the middle latitudes.
In the Northern Hemisphere, due to the rotation of the Earth and surface friction, the air currents surrounding a low pressure system will flow in a counterclockwise direction, toward the center of the low pressure. As a result, air flows will gather from the surrounding area and accumulate at the center of the low pressure system, forcing the air in the center to rise, cooling and condensing the water vapor in the uplifted air, forming clouds and eventually rain. Therefore, regions under a low pressure system usually experience bad weather. Meteorologists use the term cyclone to refer to a synoptic-scale low-pressure area.
High pressure is usually associated with sinking air, and that sinking air suppresses the formation of clouds and precipitation. However, that doesn’t mean that no impactful weather can occur with high pressure systems. Sometimes they can cause strong winds which can be damaging and, because they are usually associated with dry air, they can cause dangerous fire weather conditions.
High pressure is associated with heavy, sinking air, which brings fair, clear, and stable weather. Low Pressure is associated with light, rising air, which cools and forms clouds. So expect unsettled, stormy, and cloudy weather.
A high-pressure system usually brings cool temperatures and clear skies. A low-pressure system can bring warmer weather, storms, and rain. An average low-pressure system, or cyclone, measures about 995 millibars. A typical high-pressure system, or anticyclone, usually reaches 1030 millibars. At sea level, standard air pressure in millibars is 1013.
_
-15. A cloudburst is an extreme amount of precipitation in a short period of time, sometimes accompanied by hail and thunder, which is capable of creating flood conditions. Cloudbursts can dump enormous amounts of water in less than 5 minutes; for example, 25 mm of precipitation falling on one square kilometre, corresponding to 25,000 metric tons of water. This readily generates flood conditions. The term “cloudburst” arose from the notion that clouds were akin to water balloons and could burst, resulting in rapid precipitation. Though this idea has since been disproven, the term remains in use.
_
-16. A tropical cyclone is a rapidly rotating storm that begins over tropical oceans, and they can vary in speed, size, and intensity. Tropical cyclones are the second-most dangerous natural hazards, after earthquakes. Tropical cyclones are also called hurricanes or typhoons, depending on the region. Tropical cyclones typically form over large bodies of relatively warm water. They derive their energy through the evaporation of water from the ocean surface, which ultimately condenses into clouds and rain when moist air rises and cools to saturation. This energy source differs from that of mid-latitude cyclonic storms, such as nor’easters and European windstorms, which are powered primarily by horizontal temperature contrasts. Tropical cyclones are typically between 100 and 2,000 km in diameter. The strong rotating winds of a tropical cyclone are a result of the conservation of angular momentum imparted by the Earth’s rotation as air flows inwards toward the axis of rotation. Tropical cyclones rarely form or cross within 5 degrees of latitude of the equator because the Coriolis force is zero or too weak at the equator to generate the necessary rotational spin.
_
-17. El Nino:
El Niño is a natural climate cycle in the Pacific Ocean that warms surface waters and disrupts weather patterns worldwide. Weather hazards such as heavy rain and typhoons are regional, but they are still shaped by the larger global circulation. El Niño and La Niña are the warm and cool phases of a natural climate pattern across the tropical Pacific known as the El Niño-Southern Oscillation, or “ENSO” for short. The pattern shifts back and forth irregularly every two to seven years, bringing predictable changes in Pacific Ocean temperature and disrupting the normal wind and rainfall patterns across the tropics. These changes in the seasonal climate of the world’s biggest ocean have a cascade of global side effects.
El Niño is characterized by unusually warm ocean temperatures in the central and eastern Pacific, as opposed to La Niña, which is characterized by unusually cold ocean temperatures in the central and eastern Pacific. Atmospheric pressure over Indonesia and the West Pacific is abnormally high and pressure over the East Pacific is abnormally low during El Niño episodes.
The characteristics of El Niño are a reverse of sea temperature differences between the east and west Pacific. An accompanying effect to the atmosphere is the east-west oscillation of the pressure fields. When the sea temperature is higher in the east Pacific, the pressure of the atmosphere will be higher in the west. Conversely if the sea temperature is higher in the west, then the atmospheric pressure will be higher in the east. El Niño is an oscillation of the ocean-atmosphere system in the tropical Pacific having important consequences for weather around the globe. Among these consequences are increased rainfall across the southern tier of the US and in Peru, which has caused destructive flooding; and drought in the West Pacific, sometimes associated with devastating brush fires in Australia. El Niño shifts the primary region of deep tropical thunderstorm activity well eastward across the basin, which is the primary mechanism through which it alters global weather patterns.
Due to the severe damage El Niño can cause to human life and property, weather centers in the world are all devoting themselves to El Niño-related research.
Global warming does not cause El Niño, but rising greenhouse gas emissions supercharge the natural cycle, making its impacts more extreme and adding extra heat to an already warming plane.
_
-18. Meteorology:
Meteorology is the scientific study of the atmosphere: its structure, composition, physical processes, and the phenomena that arise from them (weather and climate). It explains how and why atmospheric conditions change over time and space, and it develops methods to observe, analyze, model, and predict those changes. Meteorology relies heavily on the principles of physics and chemistry to model atmospheric motions and phenomena. The weather forecasting is the single most important practical reason for the existence of meteorology as a science.
_
-19. Weather forecasting:
Weather forecasting is the application of science and technology to predict the state of the atmosphere at a specific time and location. Weather forecasts are made by collecting quantitative data about the current state of the atmosphere by using scientific understanding of atmospheric processes to project how the atmosphere will change. Weather forecasting is the process of making predictions of the future based on past and present data and analysis of trends. From daily temperature forecasts to severe storm warnings, modern forecasting combines observation, physics, and advanced computer models to provide accurate predictions.
_
-20. Why weather forecasting:
According to the World Meteorological Organization, extreme weather, climate, and water extremes have caused an estimated 2 million deaths and $4.3 trillion in economic losses globally over the past 50 years. Weather disasters cost the global economy hundreds of billions of dollars each year in direct damages and up to $2 trillion annually when including wider social and ecosystem losses. In 2024 alone, there were more than 150 unprecedented climate disasters globally, and $182.7 billion in U.S. weather-related damages. Weather affects nearly every sector — from supply chains and staffing to safety and customer engagement. It impacts an estimated $3 trillion of the U.S. economy annually and influences 30% of global GDP. Even a 1ºC temperature shift can cause a 1.2% swing in consumer spending.
Weather-related power outages are disruptions to the electrical grid caused by environmental conditions like storms, high winds, and extreme heat that damage exposed power lines and electrical equipment. Extreme weather events cause roughly 80% of major power outages globally, a frequency that has doubled over the last two decades due to intensifying climate patterns and aging electrical grids.
Weather information and forecasts are of vital importance to many activities like agriculture, aviation, shipping, fisheries, tourism, defence, industrial projects, water management and disaster mitigation. Weather forecasting is critical for saving lives, protecting property, and optimizing global economic operations. As extreme weather events become more common, people and businesses rely on weather forecast accuracy more than ever to try to mitigate losses, influence safety measures, increase productivity, and improve business-related decisions. Weather forecast accuracy is necessary but not enough. The most accurate forecast means nothing if it doesn’t aid decision making. A highly accurate forecast has no value on its own. Its value is created only when it changes what you do.
_
-21. Weather map:
A weather map, also known as synoptic weather chart, displays various meteorological features across a particular area at a particular point in time and has various symbols which all have specific meanings. Weather maps are invaluable tools for a variety of purposes including: Weather Forecasting; Aviation and Navigation; Agriculture; and Emergency Management. Weather map could be surface weather map or upper-air weather map. Weather maps summarize present weather or future weather.
Air pressure on a surface weather map is usually shown using isobars. Isobars connect points of equal atmospheric pressure and are key in identifying pressure systems. Tightly packed isobars indicate a steep pressure gradient, usually translating into high wind speeds. Conversely, isobars that are far apart suggest mild winds. By tracking the movement of isobars, meteorologists can predict changes in weather conditions, including the approach of storms or the onset of calm weather. The general rule is that winds are strongest where the isobars are closest together. Low-pressure systems often have tightly packed isobars because storms and cyclones have intense pressure changes. Winds are normally light near high pressure systems where the isobars are widely spaced.
Upper-air maps use specific pressure level (such as 500 mb) surface and use height contours (geopotential height) to show the altitude of that pressure level in meters or feet. Low heights on these charts represent cold, dense air columns (troughs), while high heights represent warm air columns (ridges). Warm air expands, so pressure surfaces sit higher in the atmosphere over warm regions (like the tropics). Cold air contracts, causing pressure surfaces to lower over cold regions (like the poles).
_
-22. A skew-T log-P diagram is one of four thermodynamic diagrams commonly used in weather analysis and forecasting. P stands for atmospheric pressure plotted on a logarithmic vertical axis, and T stands for temperature plotted on skewed (slanted) lines. A Skew-T log-P diagram is a thermodynamic chart used in meteorology to plot and analyze the vertical profile of temperature, moisture, and wind in the atmosphere from weather balloon data. The Skew-T Log-P offers an almost instantaneous snapshot of the atmosphere from the surface to about the 100 millibar level. It provides an instant snapshot of atmospheric stability, moisture content, and wind shear. By plotting how temperature and dew point change with height, forecasters can determine severe weather potential (e.g., CAPE), cloud formation, and precipitation types (like snow vs. freezing rain).
_
-23. Weather instruments and tools:
Weather instruments are specialized tools designed to measure and record various atmospheric conditions. These devices play a crucial role in meteorology, providing accurate data on temperature, humidity, air pressure, wind speed, and precipitation. By collecting precise measurements, weather instruments enable meteorologists to analyze current conditions, track patterns, and make informed predictions about future weather events. Each instrument serves a specific purpose, capturing data on different aspects of weather such as temperature, humidity, air pressure, wind speed, and precipitation. By utilizing a combination of ground-based and airborne instruments, meteorologists can gather real-time data and make informed predictions about weather patterns and climate trends.
Weather balloons are essential tools for gathering atmospheric data. As they ascend, they collect crucial information on temperature, humidity, air pressure, and wind speed at various altitudes.
Weather radar is an essential weather instrument used to locate precipitation, calculate its motion, and estimate its type (rain, snow, or hail) and intensity (light or heavy). Weather radars can detect the height and thickness of clouds that have not formed precipitation, as well as the physical properties within the clouds, so as to analyze the distribution, movement and evolution of precipitation. Weather radar can also measure the speed and direction of wind within a storm, providing valuable information for detecting tornadoes and other severe weather phenomena.
Weather satellites provide real-time data on cloud cover, precipitation, wind speed and temperature to help forecast extreme weather such as hurricanes, typhoons and thunderstorms. Weather satellites can monitor natural disasters such as volcanic activity, forest fires, and floods, as well as monitor various types of environmental pollution. Weather satellites provide soil and vegetation data to provide scientific management programs. Weather satellites measure sea surface temperature (SST) and SSTs supply the thermal energy and moisture that power tropical cyclones and large-scale periodic oscillations like El Niño and La Niña in the equatorial Pacific.
_
-24. Global warming and weather:
Global warming alters weather patterns by increasing atmospheric moisture and destabilizing major wind currents, which drives more extreme storms, prolonged droughts, and severe heatwaves. Warmer air holds more water vapor. For every degree Celsius the planet warms, the air holds about 7% more moisture. This extra moisture feeds storm systems, causing heavy rain and sudden floods in many regions. Higher temperatures pull moisture from soils and plants at a faster rate. Dry soil heats up faster than wet soil, making heatwaves hotter and droughts last much longer. Global warming reduces the temperature gap between the Arctic and the equator, causing the jet stream to slow down. A slow jet stream makes weather systems linger in one place for days or weeks. This turns normal weather into extreme, prolonged floods or dry spells. Oceans absorb most of the extra heat trapped by greenhouse gases. Warm ocean water acts as fuel for tropical storms. Hurricanes can grow stronger, faster, and drop much more rain than they did in the past.
Global warming affects the water cycle, shifts weather patterns, and melts land ice — all impacts that can make extreme weather worse. As Earth’s climate changes, it is impacting extreme weather across the planet. Record-breaking heat waves on land and in the ocean, drenching rains, severe floods, years-long droughts, extreme wildfires, and widespread flooding during hurricanes are all becoming more frequent and more intense.
Climate change makes it more difficult to predict the weather, because as the Earth heats up, it causes weather patterns to change and get more extreme. Traditionally, weather forecasters relied on their understanding of past weather patterns – basically what “normal” weather looks like for a given place – to predict future weather conditions. But the future no longer looks like the past.
_
-25. Weather and Chaos:
Chaotic systems refer to systems whose behavior is highly sensitive to initial conditions, and this sensitivity can manifest as complex and unpredictable patterns. Chaotic systems are deterministic, meaning they follow specific rules or equations (meaning that when you run it with exactly the same input, the output will always be the same) but their inherent complexity leads to unpredictable behavior over time. Weather is one of the most visible examples of a chaotic system. Temperature, pressure, humidity, wind patterns, ocean currents, and solar radiation interact in complex, nonlinear ways. Weather is fundamentally nonlinear. This means small changes do not simply add up; they interact, amplify, or cancel out in unpredictable ways. Nonlinear interactions between temperature, pressure, wind, humidity, and other variables make forecasting complex — and explain why a seemingly calm day can suddenly turn stormy. A slight rise in temperature in one region can intensify convection currents, shift winds, and eventually change the formation of storms thousands of miles away.
Dynamical equations are deterministic; meaning that given initial conditions, they determine how the process they describe will evolve in the future. But, in the case of the atmosphere (and many other systems as well, chaotic behaviour can be found in every branch of science), you need to enter the exact same data as initial conditions in order to get the same results if you run the model several times. The equations governing the atmosphere are nonlinear fluid-dynamic laws, meaning tiny changes in starting conditions rapidly amplify into completely different outcome. Even seemingly minuscule differences in the initial conditions result in highly different outcomes. This, combined with the fact that observations of the atmosphere are usually slightly erroneous, meant that long-range forecasts would not be possible, as the small errors would build up very quickly and change the outcome considerably. Because of deterministic chaos, small inaccuracies in initial data can lead to large errors in forecasts. This is why short-term weather predictions are fairly accurate, while long-term forecasts become less reliable. Even with satellites, supercomputers, and massive datasets, the atmosphere’s inherent sensitivity to initial conditions ensures that perfect long-term forecasting is impossible. When we complain about how unpredictable the weather can be, we should be pointing the finger of blame at chaos. Meteorologists use ensemble forecasting to account for chaos by running dozens of slightly different computer simulations simultaneously.
_
-26. Methods of weather forecasting:
There are several different methods that can be used to create a forecast. The method a forecaster chooses depends upon the experience of the forecaster, the amount of information available to the forecaster, the level of difficulty that the forecast situation presents, and the degree of accuracy or confidence needed in the forecast.
(1. Synoptic weather forecasting is a method that uses simultaneous weather observations across large regions to predict future atmospheric conditions. The word ‘synoptic’ means “seen together at a common point in time”. Meteorologists plot data onto synoptic weather maps (or synoptic charts) to visualize large-scale patterns. Isobars means lines connecting areas of equal atmospheric pressure. Tightly spaced lines mean strong winds; widely spaced lines mean gentle breezes. High-Pressure Systems are marked with an ‘H’, these areas bring clear skies and calm, stable weather. Low-Pressure Systems are marked with an ‘L’, these areas bring rising air, clouds, storms, and precipitation. Weather Fronts are boundaries separating different air masses. Cold fronts bring abrupt drops in temperature and heavy rain, while warm fronts bring steady, lighter moisture. In the synoptic method, a forecaster attempts to predict the future changes in the state of atmosphere from its initial state using his theoretical knowledge and experience. Comparison and Extrapolation is done to compare current patterns with historical models to see how pressure systems and fronts move and change over time. Based on past experience and other forecasting tools like satellite imagery and radar pictures, forecasters come to a conclusion on the expected weather over a region. The synoptic method of weather forecasting is primarily used for short-range forecasting covering a time period of 24 to 48 hours (up to 3 days). The inadequate human understanding of the various complex atmospheric processes leading to the weather development itself is one of the major problems associated with this method.
(2. Numerical Weather Prediction (NWP) modeling is the most widely used and accurate method for weather forecasting. NWP involves solving a set of mathematical equations that represent the fundamental laws of physics governing the atmosphere. By assimilating vast amounts of observational data, NWP models simulate the behavior of the atmosphere, allowing forecasters to generate detailed forecasts for various weather variables. Numerical Weather Prediction (NWP) uses the power of computers to make a forecast. Complex computer programs, also known as forecast models, run on supercomputers and provide predictions on many atmospheric variables such as temperature, pressure, wind, and rainfall. A forecaster examines how the features predicted by the computer will interact to produce the day’s weather. Numerical weather prediction (NWP) models forecast durations range from a few hours (nowcasting) up to 15 to 16 days ahead for global models, with a general predictability limit of about 10 to 14 days due to atmospheric chaos.
(3. Statistical methods of weather forecasting use historical data and mathematical relationships to predict future atmospheric conditions. Statistical forecast models are routinely used to enhance the results of dynamical (NWP) forecasts at operational weather forecasting centers throughout the world, and are essential as guidance products to aid weather forecasters. In this approach, various statistical methods like regression, contingency tables, probability analysis, and the discriminant analysis are used to prepare the forecast, the future value of a parameter. Historical meteorological data for 30–50 years are used to develop the statistical relationships between the predictand (meteorological parameter to be forecasted) and the predictors (related meteorological parameters). The statistical approach is used successfully for all scales of forecasts from short-range to long-range. For short-range and medium-range forecasts, a statistical approach is often used in conjunction with the NWP method as a way of adding value to NWP forecasts and anchoring them in reality as represented by historical observational data.
(4. An ensemble forecast in Numerical Weather Prediction (NWP) is a method that runs a computer weather model multiple times with slightly different starting conditions or physics to account for atmospheric uncertainties. Although a NWP forecast model will predict weather features evolving realistically into the distant future, the errors in a forecast will inevitably grow with time due to the chaotic nature of the atmosphere and the inexactness of the initial observations. The detail that can be given in a forecast therefore decreases with time as these errors increase. These become a point when the errors are so large that the forecast has no correlation with the actual state of the atmosphere. So looking at a single forecast gives no indication of how likely that forecast is to be correct. Ensemble forecasting entails the production of many forecasts in order to reflect the uncertainty into the initial state of the atmosphere (due to the errors in the observations and insufficient sampling). Instead of one single integration, multiple model integrations are made, initiated with either multiple slightly different ICs and/or based on different model configurations in an ensemble prediction system. The uncertainty in the forecast can then be assessed by the range of different forecasts produced.
_
-27. Types of forecasts:
There are different types of forecasts based on how far into the future they look: Each type uses different models and has different accuracy.
(1. Long-range forecasts extend beyond seven days and can cover periods of several weeks, months, or even seasons. These forecasts rely on statistical methods and large-scale climatological patterns, such as El Niño and La Niña, to make predictions about general weather trends, rather than specific conditions. For example, long range forecasts are given for a season, like for predicting the success or failure of monsoons in case of India.
(2. Medium-range forecasts provide predictions for periods of three to seven days. These forecasts employ global NWP models, such as the European Centre for Medium-Range Weather Forecasts (ECMWF) and the United States’ Global Forecast System (GFS), which cover the entire Earth and are updated regularly.
(3. Short range forecast is made for the time period ranging from few hours to a day or even 72 hours. Short-range weather forecasts rely on a combination of observed weather data (from ground stations, radar, and satellites), along with weather prediction models, and the expertise from meteorologists. Short range weather forecasting has a high level of accuracy compared to the two types discussed above and is based on maps, weather charts, satellite imageries or any change in atmospheric conditions over a particular location. Meteorologists use numerical weather prediction (NWP) models, which simulate the Earth’s atmosphere based on the laws of physics and initial observations, to generate these forecasts. About 80-90% accuracy is seen in forecasts that is done for smaller duration, say 12 hours.
(4. Nowcast is a weather forecast for a very short duration and comprises of detailed description of the current weather along with forecasts obtained by extrapolation usually for a few hours, say about 0-6 hours. Nowcasting primarily relies on real-time observations, such as radar and satellite data, to track and anticipate the development of weather phenomena, such as storms, fog, and showers. This forecast is an extrapolation in time of known weather parameters, including those obtained by means of remote sensing, using techniques that take into account a possible evolution of the air mass. This type of forecast therefore includes details that cannot be solved by numerical weather prediction (NWP) models running over longer forecast periods. Nowcasting by extrapolation excels in delivering high-resolution forecasts of weather phenomena for the immediate (2 hour) future. Advancements in data assimilation systems enable Numerical Weather Prediction (NWP) to outperform nowcast extrapolation thereafter. The use of NWP with data assimilation forms the basis of Very Short Range Forecasting (VSRF) up to 12 hours. In this method, radar and satellite observations of local atmospheric conditions are processed and displayed rapidly by computers to project weather several hours in advance.
(5. A specialist weather forecast is a targeted meteorological prediction tailored for specific industries, such as aviation, marine navigation, or agriculture, rather than the general public. It focuses on specialized atmospheric variables and localized impacts required for high-risk or operations-dependent decision-making.
_
-28. Forecast area and forecast period:
The area covered for forecast is directly proportional to forecast period. Limited area entails short range forecast; entire globe entails long tern forecast. A microscale weather model typically forecasts short time periods ranging from a few seconds up to 24 to 48 hours ahead. A mesoscale weather model typically covers a short-to-medium-range forecast period spanning from 12 hours to 84 hours (about 3.5 days) ahead. Major global weather models provide forecasts ranging from 10 days to 16 days ahead for medium-range predictions, and up to several months for seasonal outlooks.
Short-term forecasts focus on narrow local areas with high precision, while long-term forecasts analyze broader regional or global areas with general trends. Short-term forecasts focus on small areas because tiny details matter in the short run, while long-term forecasts look at large regions because small details fade and only big trends remain. Tiny errors grow fast. Predicting exact weather for one single backyard ten days out is impossible. Long-range outlooks (weeks or months ahead) smooth out daily noise but they only show if a whole region will be warmer, cooler, wetter, or drier than normal. Note that the area from which weather data required increases with the period of forecast made, since weather systems from one part of a region may travel and affect the weather condition over a far-off region in course of time.
_
-29. Primitive equations:
Scientists treat the Earth’s atmosphere as if it were a fluid on a rotating sphere in order to describe large-scale atmospheric processes using the fundamental laws of thermodynamics and hydrodynamics, also called the primitive equations. Primitive equations are simplified Atmospheric Physics Equations that can be handled by computers. Primitive equations are a set of nonlinear partial differential equations used to approximate large-scale global atmospheric flow and weather prediction. One crucial set of equations deals with fluid dynamics, describing air motion → winds, currents, and turbulence, for example, Navier-Stokes Equations. Another set focuses on thermodynamics, addressing temperature changes, heat transfer, and the formation of precipitation, for example, First Law of Thermodynamics. Radiative transfer equations, a third key group, detail how energy from the sun interacts with the atmosphere, influencing temperature and driving weather systems.
In contrast to the original differential equations which describe the whole spectrum of atmospheric motions, the discretized equations describe only processes with certain spatial and temporal scales. Discretization of differential equations is the process of converting continuous mathematical models and operators into discrete algebraic counterparts so they can be evaluated on a digital computer. The derivatives in the primitive equations can be approximated by finite differences, such that the equations can be transformed into a linear equation system. It takes modern supercomputers at the leading weather services quite a while to solve all these equations. All current NWP weather forecasting models are based on the primitive equations — or versions thereof — but each model uses different approximations and assumptions, resulting in slightly different outcomes. Also, the models include equations accounting for the effects of small-scale processes such as convection, radiation, turbulence and the effects of mountains that cannot be represented explicitly by the forecasting models, as their resolution is not high enough. This process is called parameterisation.
Furthermore, before weather data gathered from various observations can be entered into the computer models, they have to be assimilated. During data assimilation, real observations are combined with predicted conditions so as to give the best possible estimate of the actual state of the atmosphere. This process is necessary, as inputting raw data obtained just from observations results in inaccurate forecasts.
_
-30. IC:
To predict what the weather will be, you need to know what it is right now—what meteorologists call initial/ current conditions (IC). This is one of meteorology’s toughest tasks. Each day the NWS takes in 192,000 observations from surface stations, 2,700 observations from ships, 18,000 from weather buoys, 115,000 from aircraft, about 250,000 from balloons, and 140 million from satellites. Other data, in countless bytes, arrive from instrument networks abroad. Converting the billions of data points collected every day around the globe into reliable forecasts requires an incredible supercomputing capacity to process highly-detailed computer models.
_
-31. NWP model:
Numerical weather prediction is the use of computers to model the atmosphere and predict how atmospheric motions change both horizontally and vertically with time by treating it as a fluid that interacts with water bodies, land, and the biosphere. They involve mathematical equations based on physics that characterises how air moves around and how heat and moisture are exchanged between the atmosphere and the Earth’s surface. These equations are nonlinear and are impossible to solve exactly. Digital computers do not “directly” solve differential equations analytically the way a human does with pen and paper; instead, they use numerical approximation methods to calculate values step-by-step. The equations are written in a language that computers can understand, known as computer code. The equations in a weather model are complex and depend on location and time. To solve these mathematically for a time in the future (i.e. to use the equations to predict the weather), we must provide the equations with information about the current state of the atmosphere and Earth’s surface. This information is gained from weather observations recorded by ground sensors, weather balloons, buoys, ships, and remote sensing instruments such as satellites. Weather observations such as pressure, wind, temperature and moisture and fed to the model in a process known as data assimilation Models use systems of differential equations based on the laws of physics, fluid motion, and chemistry, and use a coordinate system which divides the planet into a 3D grid. The atmosphere is divided into horizontal rows/columns and vertical altitude layers as a grid, and equations are solved for each grid to model processes such as temperature changes, air movement, moisture transport, and cloud formation. Finer grids improve accuracy but require more computing power. Global models typically have horizontal grid spacing of 10 to 50 km, while high-resolution regional models can narrow it down to 1 to 3 km. Winds, heat transfer, radiation, relative humidity, and surface hydrology are calculated within each grid and evaluate interactions with neighboring points. The vertical distance of grid points, called layer depth, varies between a few meters close to the surface to several hundred meters at higher altitude.
The current global observations are fed into the supercomputers as a starting point. The computer then divides the atmosphere into a 3D grid—like a massive, layered chessboard covering the globe. For each grid point (which can be as small as 3 km square for high resolution models), it calculates what will happen based on the physics equations, projecting forward in short time steps (e.g., a few minutes). This process creates a numerical weather prediction (NWP), the backbone of all modern forecasts.
A mathematical model begins with the current state of the atmosphere, as determined by the most recent weather observations. The model uses these data to predict the state of the atmosphere for a specific time interval — for example, the next 10 minutes. Using this predicted state as a new starting point, the model then forecasts the state of the atmosphere for another 10-minute period. This process repeats over and over again until the model produces short-range weather forecasts for the next 12, 24, 36, and 48 hours.
The horizontal domain of a model is either global, covering the entire Earth, or regional, covering only part of the Earth. Regional models (also known as limited-area models, or LAMs) allow for the use of finer grid spacing than global models because the available computational resources are focused on a specific area instead of being spread over the globe. This allows regional models to resolve explicitly smaller-scale meteorological phenomena that cannot be represented on the coarser grid of a global model. Meteorology uses pressure as the vertical coordinate and not height. This works out better for thermodynamic computations that are done on a regular basis.
No model can forecast every weather event with high accuracy. Instead, meteorologists make choices about what they want to predict and design the model to have high accuracy for that kind of result. Different weather forecast models can produce varying forecasts due to several factors, even though the models are starting with mostly the same information about the current state of the atmosphere. Besides physics and maths, there are lot of assumptions and approximations in every model.
Different models use different solution methods. Global models often use spectral methods for the horizontal dimensions and finite-difference methods for the vertical dimension, while regional models usually use finite-difference methods in all three dimensions. For specific locations, model output statistics use climate information, output from numerical weather prediction, and current surface weather observations to develop statistical relationships which account for model bias and resolution issues.
There are several types of numerical models depending on the spatial and temporal scales considered. However, all models are based on the same hydrodynamic equations with initial conditions but with different parametrizations and horizontal and vertical resolutions.
Mesoscale models are used for short-range weather forecasts (0-2 days ahead). These models have a non-hydrostatic dynamical core and 1-3 km horizontal resolution. They produce forecasts few hours after observations are made. They are limited area models and their boundary conditions are given by a global model.
The global models are used for medium-range weather forecasts (2-15 days ahead). These models have a hydrostatic dynamical kernel. Both the parametrizations and the assimilation procedure are very important in them. They have more vertical levels than limited area models and the horizontal resolution is around 10-25 km. They produce forecasts several hours after observations are made.
Phenomena smaller than a single grid box—such as individual clouds, turbulence, or raindrops—cannot be explicitly resolved. Calculating the exact physics for every single molecule or microscopic droplet requires more computing power than any supercomputer possesses. Parametrization estimates the net effect of these small events using the large-scale values of the grid box. Each important physical process that cannot be directly predicted requires a parameterization scheme based on reasonable physical or statistical representations.
_
-32. Spatial and temporal resolution of NWP weather model:
The more grid points there are in any model, the finer the resulting detail in the forecast and the greater forecast accuracy. However, as the number of grid points increases, so does the need for more computing power. When we refer to “1 km,” “6 km,” or “10 km” resolution, it actually means km² for the grid cell area. When transitioning from a model with a 1 km² grid, such as EURO1k, to a model with a 6 km² grid, such as ICON EU, or a 10 km² grid, such as ECMWF, the resolution decreases exponentially by factors of 36 and 100, respectively. Today’s forecasts involve an inevitable trade-off between horizontal resolution and the length of the forecast. This is because fine resolution means lots of point at which to make calculations. This requires a lot of computer time. A forecast well into the future also requires millions or billions more calculations. If fine resolution is combined with a long range forecast, the task would choke the fastest supercomputers today.
A model is a computer program that produces meteorological information for future times at given locations and altitudes. Within any model is a set of equations, known as the primitive equations, used to predict the future state of the atmosphere. These equations are initialized from the analysis data and rates of change are determined. These rates of change predict the state of the atmosphere a short time into the future, with each time increment known as a time step. The equations are then applied to this new atmospheric state to find new rates of change, and these new rates of change predict the atmosphere at a yet further time into the future. Time stepping is repeated until the solution reaches the desired forecast time. The length of the time step chosen within the model is related to the distance between the points on the computational grid, and is chosen to maintain numerical stability. Time steps for global models are on the order of tens of minutes, while time steps for regional models are between one and four minutes.
In numerical weather prediction, a time step is the specific time interval (Δ t) between successive computer calculations of atmospheric variables. A weather model uses hundreds to thousands of individual time steps, depending on how far into the future the forecast goes and the size of the model’s grid. The length of the time step greatly affects model accuracy. Smaller time step intervals produce more accurate forecasts as there is less variation in output at the end of each computation. But the cost is that smaller time steps require more computations. Conversely, large time step intervals require less computation time but introduce larger variations in output.
High spatial resolution (finer grid points) and high temporal resolution (smaller time step interval) entail greater accuracy but demands more computational power.
Therefore, a trade-off exists between time step interval lengths and grid sizes verses computational power. In the future, as computing power increases, we will be able to have smaller time step intervals and smaller grid sizes leading to more accurate forecasts. More detailed and more accurate mathematical methods as well as increased computer power will allow meteorologists to increase the resolution of their grids. A finer resolution will in turn allow them to take local weather phenomena such as thunderstorms as well as the effects caused by topographic features such as mountains and lakes into account.
Note that increasing the grid resolution involves the risk that errors in the initial data are multiplied when more grid points are used, so mathematical models will have to take this into account.
_
-33. Ensemble forecasting:
Ensemble forecasting is a method used in or within numerical weather prediction. Instead of making a single forecast of the most likely weather, a set (or ensemble) of forecasts is produced. This set of forecasts aims to give an indication of the range of possible future states of the atmosphere. Because chaos makes single-point forecasts fail after a few days, ensembles map out a range of possible futures. An ensemble forecast runs a computer model multiple times with slightly different starting conditions to create a group of individual forecasts, which are then used to calculate the likelihood of specific future weather events in a probability forecast.
Ensemble forecasting is a form of Monte Carlo analysis. The multiple simulations are conducted to account for the two usual sources of uncertainty in forecast models: (1) the errors introduced by the use of imperfect initial conditions, amplified by the chaotic nature of the equations of the atmosphere, which is often referred to as sensitive dependence on initial conditions; and (2) errors introduced because of imperfections in the model formulation, such as the approximate mathematical methods to solve the equations.
Ensemble forecasting is a technique used to quantify the uncertainty associated with a forecast. The ensemble is comprised of many forecasts or members – anywhere between 12 and 51, depending on the center. If we run the same model twice, with precisely the same IC, then it produces two identical forecasts, which is of no use whatsoever. To produce a set of ensemble forecasts, the IC are changed slightly for each ensemble member. There is uncertainty in the original IC and the new IC are just as likely to match the real world as those used for the DF (determinist forecast) – this is known as sampling the uncertainty. In some models, slight variations are also made to the equations in an attempt to capture some of the model uncertainty. The advantage gained in producing many possible outcomes outweighs the fact that the ensemble members are run at lower resolution – and the Ensemble Average (EA) is often more skilful than the DF at longer lead times. In fact, an ensemble forecast is a vital tool for long range forecasting.
_
-34. Deterministic versus probabilistic:
Weather forecasting models split into two main types: deterministic and probabilistic. Deterministic models predict a single future outcome, probabilistic models project a range of scenarios with odds, and both rely on supercomputers running complex math on atmospheric data. A deterministic system is one in which the chance is not involved in any future states of the system. As a consequence, a deterministic model will always lead to the same final state from identical initial conditions. A probabilistic forecast presents a range of possible outcomes, assigning probabilities to each. This approach acknowledges uncertainty, helping stakeholders assess potential risks and plan for multiple scenarios. Synoptic weather forecasting relies on deterministic principles for its core physical analysis of large-scale pressure systems. NWP, AI and statistical weather forecasting uses both methods, deterministic and probabilistic. Deterministic forecast is highly accurate for the first 1 to 2 days, but skill drops off fast as forecast period increases. Probability forecast is best for medium/long range, and accounts for the chaotic, unpredictable nature of the atmosphere over 3 to 15 days.
Note:
NWP is deterministic and NWP-Ensemble is probabilistic.
Point forecast is a type of deterministic forecast when it predicts a single, specific outcome for a particular location without showing a range of probabilities.
_
-35. Accuracy:
The accuracy of a weather forecast is a measure of how closely predicted weather conditions match actual recorded reality. The inherent complexity of the atmosphere, coupled with modeling limitations, observational challenges, and uncertainties, contributes to the inaccuracies in weather forecasts.
The accuracy of weather forecasts generated by mathematical models declines steadily over time for two main reasons. First, the weather observation data initially fed into the model can never provide a complete picture of the present state of the atmosphere. Not all the data are reliable, due to both technical and human error, and data are missing from vast stretches of the atmosphere over the oceans. Second, mathematical models of the atmosphere are only approximations of the way the atmosphere actually works, and errors in the models tend to grow with each repetition.
Forecasts can range from short-term to long-range predictions, each with varying degrees of accuracy. Generally, short-term forecasts demonstrate high accuracy. Accuracy drops as the forecast range increases. A 3-day forecasts routinely achieve ~90% accuracy. Accuracy declines significantly beyond 7–10 days due to atmospheric chaos. Traditional weather forecast skill typically tops out at around 14 days due to the chaotic nature of the atmosphere and initial-state errors.
Accuracy improvement:
The remarkable improvement in the quality of weather forecasts is one of the great successes of environmental science in the 20th century, which continues at a sustained pace at the beginning of the 21st century. This is due to the progress of numerical prediction systems and the increasing number and variety of observations of the state of the atmosphere and related media (ocean, soils, vegetation, cryosphere), including observations from Earth observation satellites. The rapid development of supercomputers has been one of the keys to this success, which has also required significant scientific work. As computer power increased, the models have constantly been refined (meaning that more layers, a finer grid, more equations, topography and landscape characteristics were included). This dramatically increased both the forecast accuracy and quality. Improvements in models, and a vast increase in the observation data that feeds them, have made a huge difference. A modern five-day forecast is now as accurate as a three-day forecast was in the year 2000 due to better data collection, faster supercomputers, smaller grids and AI.
When dealing with hurricanes, predicting the landfall location is key to prevent damage. Modern weather science can calculate landfall locations within 220 miles, five days in advance. For a 24-hour forecast, the accuracy improves to 47 miles.
_
-36. Weather forecasting limitations:
Forecast limits arise from atmospheric chaos, incomplete observations, approximate models, computational trade-offs, and communication challenges. Progress comes from denser observations, larger ensembles, better physics and coupling, machine-learning enhancements, and clearer probabilistic communication—but fundamental predictability ceilings remain for small-scale and long-lead details. Sudden events like heavy rain or thunderstorms happen on a small scale. They are hard to see with standard radar and hard to predict in exact spots. Shifting weather patterns due to climate change make old historical data less reliable for future forecasts. Absolute precision remains elusive due to the chaotic nature of Earth’s atmosphere. Small changes in initial conditions, like temperature or humidity, can cascade into major variations in weather outcomes, a concept known as the “butterfly effect.” There would always be a limit to how far ahead we could forecast the weather, because however good our observing systems, we could never know all the exact details of the starting conditions. Extreme weather events, such as hurricanes, tornadoes, or heatwaves, involve highly nonlinear processes that are challenging to predict accurately. Slight variations in the initial conditions or model parameters can lead to large differences in outcomes for these events. Despite advanced technology, forecasting has several limitations and that is why forecasts are often updated frequently.
_
-37. Meteorology is most challenging:
Job of meteorologist is more challenging than any other scientist. The meteorological laboratory covers the entire globe, so that even the problem of measuring the present state of the atmosphere is tremendous. Furthermore, the surface of the earth is an irregular combination of land and water, each responding in a different way to the energy source – the sun. Then, too, the atmosphere itself is a mixture of gaseous, liquid, and solid constituents, many of which affect the energy balance of the earth, one of them, water, is continually changing its state. Also, the circulations of the atmosphere range in size from extremely large ones, which may persist for weeks or months, to minute whirls, with life spans of only a few seconds. All weather models are based on assumptions and approximations not to mention imperfect data. Don’t blame meteorologist for inaccurate weather prediction.
_
-38. Even a 70% Accurate Forecast is valuable. Forecasts do not need to be perfect to be useful. Even partially accurate forecasts help users manage risk. Farmers can delay fertiliser application if heavy rainfall is expected. Disaster management agencies can evacuate vulnerable communities ahead of cyclones. Energy companies can prepare for increased electricity demand during heatwaves. In this way, forecasts function as risk-management tools, helping societies make better decisions despite uncertainty. For forecasts to truly support decision-making, however, they must reach people in a timely and understandable form.
_
-39. Rich versus poor:
There are large differences in weather forecasts across the world, with a large gap between rich and poor. A 7-day forecast in a rich country can be more accurate than a one-day forecast in some low-income ones. Predicting weather developments relies heavily on data collected by specialised equipment such as doppler radars, satellite data, radiosondes, and surface observation centres.
First, far fewer land-based instruments and radiosondes measure meteorological data in poorer countries.
Second, the frequency of reporting is much lower.
Third, lack of advanced supercomputers. Only a small number of countries operate their own global numerical weather-prediction models. Most national weather services rely instead on forecasts produced by a handful of international centers, which they then refine using regional models, local observations and the expertise of their own forecasters. Doing so requires skilled staff, reliable data and substantial computing resources. With extensive computational resources, the developed world continuously not only offers models, but also checks forecasts against measurements to find gaps and errors in the models. As these are identified, they are being tweaked continuously improving forecasting models for that country or group that supports the forecasting center. This persistent need for extensive, high-capacity high-performance computing (HPC) resources to better protect the population is not available to developing countries that lack the resources to even operate a basic forecasting model. For example, on the African continent, the most advanced HPC resource, by far, is the Lengau machine in South Africa installed in 2016. It is now old and far behind the needs of current forecasting models. The rest of Africa has been receiving machines as donations from the developed world and redeploying them, generally in much smaller pieces, across the continent. Even with these resources, the forecasting models are too complex to complete their calculations to offer timely forecasts for the areas in which these machines are installed. Developing nations lags behind advanced countries of Europe and America in these areas and ironically, good weather forecasts are most crucial for the poorest people in the world!
About 60% of workers in low-income countries are employed in agriculture, arguably the most weather-dependent sector. Most are small-scale farmers, who are often extremely poor. Having accurate weather forecasts can help farmers make better decisions. They can get information on the best time to plant their crops. They know in advance when irrigation will be most needed or when fertilizers might be at risk of being washed away. They can receive alerts about pest and disease outbreaks so they can either protect their crops when an attack is coming or save pesticides when the risk is low. That means they can use precious resources most efficiently if they have access to accurate weather forecasts.
_
-40. PoP:
Probability of Precipitation (PoP) is a formal measure of the likelihood of precipitation that is often published from weather forecasting models, although its definition varies. There are a number of interpretations of “chance of rain”, but unless a forecast specifically says it is for heavy rain or within a distance, it can be assumed that it is the chance of any rain in the hour at the location. In U.S. weather forecasting, PoP is the probability that greater than 1/100th of an inch of precipitation will fall in a single spot, averaged over the forecast area.
The mathematical definition of PoP
PoP = C × A × 100, where C is the confidence that precipitation will occur somewhere in the forecast area, and A is the percent of the area that will receive measurable precipitation, if it occurs at all. For example, a forecaster may be 40 percent confident that precipitation will occur and that, should rain happen to occur, it will happen over 80 percent of the area. This results in a PoP of 32 percent → 0.4 × 0.8 × 100 = 32.
32% chance of precipitation means there is 32% probability that at least 0.01 inches of measurable rain or snow will fall at any single point in the given forecast area during the specified time period.
There is another definition of PoP
The probability of precipitation (PoP) in an ensemble forecast is calculated as the percentage of individual computer model simulations (ensemble members) that predict measurable rain or snow at a specific location. If an ensemble has 20 total members and 6 of them show rain for a certain spot, the probability of precipitation is 30% (6 ÷ 20). What does a 30% chance of rain mean? Using an ensemble, we see it means 30% of forecast simulations suggest it will rain. It will not rain 30% of the time nor it will affect 30% of the area.
So, there are various ways of looking at PoP.
_
-41. Fog is a low-lying cloud made of tiny water droplets or ice crystals suspended in the air near the ground. It reduces horizontal visibility to less than 1,000 meters (3,281 feet). Fog arises when water vapour condenses into minute liquid droplets suspended in the air near the surface, markedly reducing visibility. Various studies showed that the ensemble-based method can significantly improve the fog forecasting when compared with deterministic style. Low visibility conditions due to fog affect air traffic and, in some cases, are the leading cause of aviation accidents. Accurate forecasting of fog can lead to a significant reduction of human and financial losses.
_
-42. Weather parameters including temperature, humidity, pressure, wind, precipitation, and solar radiation— have significant effects on human health. Extreme temperatures can cause heatstroke, hypothermia, or worsen heart and respiratory conditions. High humidity increases the risk of asthma, allergies, and skin infections. Fluctuations in atmospheric pressure may trigger migraines and joint pain, while strong winds can spread allergens and pollutants, leading to respiratory issues. Heavy rainfall and flooding contribute to the spread of waterborne and vector-borne diseases like cholera and dengue. Prolonged exposure to solar and ultraviolet (UV) radiation can cause sunburn, eye damage, and increase the risk of skin cancers, despite its role in vitamin D synthesis.
_
-43. AI in weather forecasting:
Traditional forecasting relies on numerical weather prediction (NWP) models, which solve complex mathematical equations describing atmospheric behavior. These models, however, are computationally intensive and limited by uncertainties in initial conditions and parameterizations. AI/ML offer an alternative by leveraging data- driven approaches to identify patterns in vast datasets, enabling faster and often more accurate predictions. By integrating AI/ML with existing forecasting systems, meteorologists can achieve enhanced precision and timeliness in their forecasts.
Pure AI weather models rely on historical pattern recognition, whereas hybrid models blend machine learning speed with the fundamental laws of physics to improve accuracy during extreme events. Many of ML algorithms that are used in the core of AI-based weather forecasting models help in correcting the systematic errors that arise out of NWP outputs and improve spatial and temporal resolution. AI does not replace conventional models but enhances them with the ability to model the complexities governing atmospheric dynamics.
AI surpasses NWP in predicting the tracks of tropical cyclones, capturing both the timing and path of storms with high fidelity. For day 5 forecasts of heavy rainfall (e.g., exceeding 10 mm/day), ML models have shown slightly better discrimination between rain and dry events, improving early warnings for high-impact precipitation
The best NWP weather models are hamstrung by the high costs of computing power, which presents a real bottleneck to research. AI-based models are indeed more compact. Once trained, typically on 40 years of historical weather data from ECMWF, a machine-learning model like Google’s GraphCast can run on less than 5,500 lines of code, compared with the nearly 377,000 lines required for the NWP model from the National Oceanic and Atmospheric Administration. Machine learning is used to produce weather forecasts that are affordable, quick, convenient, accurate, and real-time.
_
-44. Pros and Cons of AI weather models:
One of the advantages of AI-based weather forecasting models is their computational efficiency. They could be trained using accessible hardware like GPUs, TPUs, or specialized AI hardware, while NWP models need HPC clusters. Speed is another notable advantage of AI models. They can forecast weather phenomena significantly faster than NWP models, with latencies typically in the order of seconds. AI models generate local forecasts in seconds instead of hours. It is ideal for rapid updates, aviation, emergency response, and severe storm tracking. Artificial intelligence (AI) models trained on the ERA5 dataset can now outperform IFS-HRES in a wide range of scores. Traditional numerical models, while reliable, struggle to capture chaotic atmospheric behavior quickly, but machine learning can simulate these systems thousands of times faster. The combination of speed, accuracy, and adaptability makes AI-driven weather forecasting a transformative tool for modern meteorology. AI generates high-resolution forecasts globally within seconds on a single laptop or desktop computer. Not only does that speed cut computing costs, but it ultimately gives meteorologists more warning before things become life-threatening. The new AI forecasts are, by leaps and bounds, easier, faster, and cheaper to produce than the non-AI variety, using 1,000 times less computational energy. And, in most cases, these AI forecasts, powered by machine learning, are more accurate, too. Faster and cheaper forecast production means that poorer countries should be able to produce their own custom forecasts. offering advantages in speed, hyper-localized short-term accuracy, and long-term climate predictions. AI weather models now match or beat the best physics-based models behind most forecasts today, and they run at a fraction of the cost and time. For decades, producing a reliable weather forecast required a supercomputer that cost around $100 million. A trained AI model now produces a 10-day forecast in minutes on a single computer chip putting life-saving warnings within reach of the world’s most vulnerable communities.
AI models “depend strongly on the training data” and are “relatively constrained to the range of this dataset”. In other words, AI models struggle to simulate brand new weather patterns, instead tending forecast events of a similar strength to those seen before. As a result, it is unclear whether AI models can simulate unprecedented, record-breaking extreme events that, by definition, have never been seen before. This constraint reduces the robustness and reliability of such models, especially in critical scenarios where accurate prediction is paramount. Current AI models underperform HRES in forecasting record-breaking events. While AI drastically improves processing speed and pattern recognition, traditional physics-based models from organizations like the ECMWF still serve as essential tools for accurately predicting unprecedented, extreme record-breaking events.
Current AI models typically rely on NWP outputs and their data assimilation pipelines, limiting their ability to fully replace conventional forecasting. AI meteorology faces limitations related to training data biases, scarcity of high-quality, high-resolution historical meteorological data, interpretability, and the lack of physical invariance in some models. AI weather model technology may hallucinate during unprecedented events, such as extreme floods or record-breaking storms, reducing trust among meteorologists. Black-box deep learning decisions can be technically accurate yet difficult to interpret, leading forecasters to ignore certain AI-generated recommendations.
While AI and NWP models may have their shortcomings alone, together they significantly enhance weather forecasting in a hybrid approach that combines the speed of AI with the strong foundation of the fundamental laws of physics. It’s not sort of physics versus AI. It’s really physics and AI together.
_
-45. Crowdsourced Weather Data to improve weather forecasting:
Imagine millions of personal weather stations, not owned by meteorologists, but by everyday people, forming a vast data-gathering network. This is the concept of crowdsourced weather data, and it’s poised to make a big impact. Traditional weather stations are often sparse, especially in rural or remote areas. Your smartphone, with its built-in barometer, thermometer, and GPS, can contribute valuable data from places where no official observation exists. Some cars can even act as mobile weather sensors! Apps and specialized devices can gather data from your phone or personal weather station and feed it anonymously into large datasets. This data is then integrated into forecast models, adding valuable information that wouldn’t otherwise be available.
_
-46. Weather and vehicle:
The safest way to drive in heavy rain is to slow down, increase your following distance, and turn on your low-beam headlights. Just six inches of moving water can make you lose control of your car. Never drive through flood water. Do not start a car that has been submerged in water, as doing so can cause permanent, catastrophic engine damage.
_
-47. My view:
We are caught in the envelop of gases of atmosphere consisting of nitrogen, oxygen, carbon dioxide and water vapor. Nitrogen and oxygen gases are responsible for strong winds, tornados, heat waves, cold waves and wild fires. Without natural greenhouse gases like carbon dioxide Earth would be too cold to support life but excess carbon dioxide causes global warming by trapping heat in Earth’s atmosphere. Global warming makes severe weather events much stronger and more common. Water vapor, though it makes up only a fraction of a percent, is the real wild card, capable of driving the most dramatic shifts in the sky. Without water vapor, there would be no clouds, no rain, no snow, no storm, no cyclone — and no weather worth speaking of.
All weather phenomena caused by these gases (and phase change of water vapor) are following laws of science. There is nothing supernatural but weather is fundamentally nonlinear. This means small changes do not simply add up; they interact, amplify, or cancel out in unpredictable ways. Nonlinear interactions between temperature, pressure, wind, humidity, and other variables make forecasting complex — and explain why a seemingly calm day can suddenly turn stormy.
Scientists treat the Earth’s atmosphere as if it were a fluid on a rotating sphere in order to describe large-scale atmospheric processes using the fundamental laws of thermodynamics and hydrodynamics, also called the primitive equations. Primitive equations are a set of nonlinear partial differential equations used to approximate large-scale global atmospheric flow and weather prediction. A weather model is a computer program that produces meteorological information for future times at given locations using primitive equations and initial conditions. The equations governing the atmosphere are nonlinear fluid-dynamic laws, meaning tiny changes in starting conditions rapidly amplify into completely different outcome. Even seemingly minuscule differences in the initial conditions result in highly different outcomes. This, combined with the fact that observations of the atmosphere are usually slightly erroneous, meant that long-range forecasts would not be possible, as the small errors would build up very quickly and change the outcome considerably. The fundamental limitation of weather forecasting is the chaotic and nonlinear nature of the Earth’s atmosphere, which creates an absolute intrinsic predictability limit of about 14 days. Absolute perfection in weather forecasting is scientifically impossible. We have to develop AI models to make forecast affordable, quick, accurate, and real-time to benefit the poor who need them most. AI models can analyze billions of data points from satellites, sensors, radar, and historical records—far beyond what humans or traditional models can process in real time. Artificial Intelligence allows computers to detect patterns in vast datasets and make predictions based on that training. AI models can make it possible to discover complex relationships that have not yet been understood or identified by scientists. AI weather program running for a single second on a desktop/laptop can match the accuracy of traditional forecasts that take hours or days on powerful supercomputers. And it ultimately gives meteorologists more warning before things become life-threatening as speedier forecast gives more time to react. AI is the future of weather forecasting.
______
Dr. Rajiv Desai. MD.
October 9, 2026
______
Postscript:
This is the biggest and the most difficult article I have published under ‘sting environment’.
______