Dr Rajiv Desai
An Educational Blog
Solar Technologies
Solar Technologies:
Solar is the only renewable energy source which could, in principle, easily meet all the world’s energy needs.
_
“I’d put my money on the sun and solar energy. What a source of power! I hope we don’t have to wait until oil and coal run out before we tackle that.”
Thomas Edison in 1931
____
Section-1
Prologue:
Currently, our civilization consumes around 17.7 Terawatts (17.7 terajoules/second) of power taken from all sources of energy, namely oil, coal, natural gas and alternative energies such as solar, wind, hydropower and others. Fossil fuels—including coal, oil, and natural gas—have been powering economies for over 150 years, and currently supply about 80 percent of the world’s energy. The environmental ramifications of using fossil fuels, combined with their expected remaining abundance on earth places limits on how much longer we as a species can rely on them as an energy source. If we are to continue to power our civilization, then alternative means of energy generation must become the new norm. The Sun, a massive self-sustaining thermonuclear reactor, delivers substantially more energy to Earth than the entirety of humanity is able to consume, in the form of light. If we as a species are able to tap into this enormous source of energy, we could completely remove our dependence on fossil fuels. This is the motivation for solar technologies that allow photons to be captured and used as a power source.
_
Sun is the mother of all energy on earth. If the earth is our home, we owe a lot to solar energy. Just to offer some perspective, solar radiation is the key element of chlorophyll photosynthesis which kickstarts the basis for life for most creatures that inhabit the planet. Solar radiation is also the origin of winds and fossil fuels: the sun is the primary engine of almost all forms of energy on our planet. Every second, the sun releases an astonishing amount of energy, and despite the vastness of space, a significant portion reaches Earth. Understanding the magnitude of 173,000 terawatts of solar power striking the Earth continuously serves as a powerful reminder of the boundless potential that solar power holds. That’s about 10,000 times the world’s total energy use. And that energy is completely renewable — at least, for the lifetime of the sun. Solar is the only renewable energy source which could, in principle, easily meet all the world’s energy needs. With 15 to 20% efficiency [already available from Photovoltaic (PV) and Concentrated Solar Power (CSP)], 0.5% of the world’s land surface would (with average irradiance) provide 20 terawatts of electricity – more than current total primary energy use. A promising alternative to fossil fuels is solar energy. If we could only find a way to harness even a fraction of solar energy, we could solve our energy problem.
_
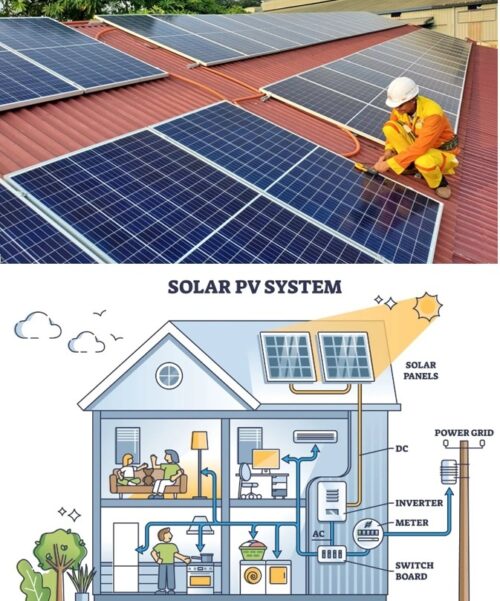
Sun is an inexhaustible source of energy capable of fulfilling all the energy needs of humankind. Solar energy is radiation from the sun capable of producing heat, causing chemical reactions, or generating electricity. There are three primary technologies by which solar energy is harnessed: photovoltaics (PV), which directly convert light to electricity; concentrating solar power (CSP), which uses heat from the sun (thermal energy) to drive utility-scale, electric turbines; and solar heating and cooling (SHC) systems, which collect thermal energy to provide hot water, space heating, cooling, and pool heating. Progress has been made to raise the efficiency of the PV solar cells that can now reach up to approximately 34 % in multi‐junction PV cells. Electricity generation from concentrated solar technologies has a promising future as well, especially the CSP, because of its high capacity and energy storage capability. Solar energy also has direct application in agriculture primarily for water treatment and irrigation. The most exciting possibility for solar energy is satellite power station that will be transmitting electrical energy from the solar panels in space to Earth via microwave beams. Solar energy has a bright future because of the technological advancement in this field and its environment friendly nature. Solar power has the general advantage of being a daily renewable source of power but the disadvantages of being erratic because of cloud cover, discontinuous because of the night and the seasons, and diffuse.
_
Solar energy was used by humans as early as the 7th century B.C. when humans used sunlight to light fires by reflecting the sun’s rays onto shiny objects. In the fifth century BC, passive solar systems were designed by the Greeks to utilize solar energy for heating their houses during the winter season. In 3rd century B.C., the Greeks and Romans harnessed solar power with mirrors to light torches for religious ceremonies. In 1839 and at the age of just 19, French physicist Edmond Becquerel discovered the photovoltaic (PV) effect while experimenting with a cell made of metal electrodes in a conducting solution. He noted that the cell produced more electricity when it was exposed to light – it was a photovoltaic cell. In 1954 PV technology was born when Daryl Chapin, Calvin Fuller and Gerald Pearson developed the silicon PV cell at Bell Labs – the first solar cell capable of absorbing and converting enough of the sun’s energy into power to run every day electrical equipment. These PV cells were capable of converting sunlight into electrical energy to power electric equipment. These PV cells began to be used in space programs, that is, to power satellites, etc. Further advancement in the technology reduced the price of solar PV and it began to be used for household applications. Today, after nearly 185 years since the onset of the first photovoltaic cell, solar energy is the fastest growing renewable energy source (+24% yearly, according to the 2019 IRENA report) and its technological development follows through, delivering ever more efficient solar power plants. It currently provides 6% of the world’s electricity but, by the mid-2030s, solar cells will probably be the planet’s single biggest source of electricity. By 2050, a quarter of the world’s energy could be derived from solar power. This industry is creating numerous jobs and developing new revenue streams for farmers. Among the countries that have poured the most money into solar energy are China – by far the largest investor, the United States, Japan, Australia, and India.
_
The conversion from solar energy to electrical energy is done by using solar PV. Solar PV has a nonlinear characteristic and its output varies with ambient conditions like solar irradiation, ambient temperatures, etc. Solar panels on the market today consist of cells made from a single semiconducting material, usually silicon. Since the material absorbs only a narrow band of the solar spectrum, much of sunlight’s energy is lost as heat. The average efficiency of solar panels stands at 20% although researchers are working tirelessly to raise the bar, day after day. From household roofs to large photovoltaic solar parks, solar energy is flexible enough to make it the ideal solution for any kind of personal or business need. A photovoltaic power plant generates energy in a clean and silent way. Zero CO2 emissions and zero decibels make a very compelling case for renewable energy.
_
World’s energy demand is growing fast because of population explosion and technological advancements. It is therefore important to go for reliable, cost effective and everlasting renewable energy source for energy demand arising in future. Solar energy, among other renewable sources of energy, is a promising and freely available energy source for managing long term issues in energy crisis. Solar industry is developing steadily all over the world because of the high demand for energy while major energy source, fossil fuel, is limited and other sources are expensive. It has become a tool to develop economic status of developing countries and to sustain the lives of many underprivileged people as it is now cost effective. The solar industry would definitely be a best option for future energy demand since it is superior in terms of availability, cost effectiveness, accessibility, capacity and efficiency compared to other renewable energy sources. Solar energy technologies could help address energy access to rural and remote communities, energy security and climate change. On the top of it, if you live in an area that has frequent natural disaster events, consider going solar and adding a battery storage system to make your home more resilient to power outages. My endeavour is to study solar technologies to provide a holistic understanding of solar energy utilization.
_____
_____
Abbreviations and synonyms:
AC = alternating current
DC = direct current
PV = Photovoltaics
CPV = concentrated photovoltaics
CSP = Concentrated Solar Power
CAES = Compressed Air Energy Storage
CCS = Carbon Capture and Storage
CCGT = Combined Cycle Gas Turbine
GHG = Greenhouse Gases
RE = Renewable Energy
IEA = International Energy Agency
IPCC = International Panel on Climate Change
IRENA = International Renewable Energy Agency
NREL = National Renewable Energy Laboratory
SERI = Solar Energy Research Institute
LCOE = Levelized Cost of Electricity/Energy
PERC = Passivated Emitter Rear Contact
TOPCon = Tunnel Oxide Passivated Contact
MW = Megawatt
GW = Gigawatts
TW = Terawatt
MWac = megawatt of alternating current.
MWdc = megawatt of direct current
kWh = kilowatt hour
MWh = megawatt hour
w/m2 = watts per square meter
eV = electron volte = 1.6 x 10^-19 joule
_____
_____
Section-2
Nitty gritty of electricity vis-à-vis solar technology:
All electrical appliances tell you the number of amps, volts, and watts that they use. Their relationship is simple: Watts = Volts x Amps (W = V x A). Many battery systems run on 12V, so for example, a 12V cell phone charger might be 0.9 amps, or, 12 x 0.9 = 10.8 watts. That’s about as much electricity as can be pumped into a smartphone battery at one time.
Most devices in your home consume a lot more power than a smartphone, however. Your home (if it’s in the US) is wired at 120V Alternating Current (AC) and some appliances (dryers, water pumps) are wired in at 240V. A washing machine may have a peak load of around 12 amps at 240 volts, or, close to 2,880 watts.
1,000 watts = 1 kilowatt.
However, you are billed for electricity in kilowatt-hours, the product of a certain amount of electricity over a period of time. A kilowatt hour (kWh) is a unit of energy. It is the amount of energy consumed when one kilowatt of power is used for one hour. Thus, if you run a 1 kW microwave oven for one hour, it will consume 1 kWh of energy. The kWh is the standard unit that electricity companies use to bill customers, as it measures the total amount of electrical energy consumed over time.
Every electrical appliance in your home consumes power and contributes to your monthly electricity bill. Knowing the wattage (or kilowattage) of your appliances and how long they operate can help you calculate your energy usage in kilowatt hours.
For example, a 100-watt light bulb operating for 10 hours would consume 1 kilowatt hour of energy (100 watts X 10 hours = 1,000 watt-hours = 1 kWh). The washing machine, pulling 2,880 watts, for 5 minutes, would consume 240 watt-hours (0.24 kilowatt-hours) of electricity. At rate around 15.5 cents per kwh that amount of electricity would cost you about 4 cents.
The accumulation of all of the electric loads in your household, times the amount of time that you run them, culminates in your total electric bill from the utility.
_
So, how does solar electricity fit into all this?
Solar panels are the opposite of electric loads, they generate a certain amount of electricity for every minute they are exposed to the sunshine. Solar panels are rated in watts (typically 265 to 320 watts) and collections of them for homes are rated in kilowatts (1,000 watts). For example, 20 solar electric panels rated at 250 watts results in a 5-kilowatt solar electric array (5,000 watts = 5 kilowatts).
An oversimplification is to say that a 5-kilowatt solar electric system will generate 5 kilowatt-hours (kWh) for each hour that they are exposed to sunlight. Realistically, some amount of the solar energy is lost in the wiring process and conversion from the direct current (DC) electricity generated by sunshine into the 120V alternating current (AC) electricity consumed in your home. Also, the sun is rarely constant for a full hour; any clouds or changes in sun intensity will affect the real-time performance of a solar array.
So to predict how much electricity a 5-kilowatt solar array will generate, we take the data on regional solar insolation and build out a model of expected solar generation. The National Renewable Energy Labs (NREL) has an excellent calculator, PV Watts, which uses 25 years of weather data to assess expected solar insolation for a location.
A full analysis of a solar array’s expected production based on climate, adjusted for the angle of the solar array, and orientation (azimuth) towards the sun, and adjusted again for any shading, results in a prediction of a system’s output over the course of the year. As a rule of thumb, each 1-kilowatt of installed grid-tied solar, on a good site will generate around 1,250 kWh/year in New England. A typical 5 kW array for a home will generate about 6,250 kWh/year.
__
Do not confuse between kW (power) and kWh (energy) of solar panels:
The size of a solar system is defined by the ‘peak power’ in kW, of its solar array (where ‘solar array’ is the collective term for all the solar panels). For example, a 3 kW solar system, might consist of ten 300W solar panels on the roof. This solar array can push electricity out at a maximum rate of 3 kW (3,000 watts) every second.
For most of the day the solar panels will not produce at their peak power. Only in full midday summer sun, in perfect conditions and with perfectly clean panels, will the electricity flow out of those panels at the system’s nameplate peak power. For example, that 3 kW solar array should give out 3 kW of power under perfect conditions.
In practice, you often get about 20% less than the peak power rating because of unavoidable losses in the system, such as:
- dirt on the panels
- the resistance of the wires to your roof
- solar inverter losses
- temperature losses from the solar panels
So the curve for a 3 kW system in the real world typically peaks at closer to 2.4 kW. But the solar system’s size is defined by the peak power output of the solar array and not real output.
_
The abbreviation kWh stands for kilowatt-hour. A kWh is a measure of energy (not power). Energy is how much electricity has been generated, stored, or consumed over time. If your solar panels (for example) continuously give out 5 kW of power for a whole hour, you will have produced 5 kWh of energy. That energy could get used by your appliances, it could be exported to the grid or, it could be stored in a battery. Or it could be divided among the three.
The amount of electricity you use (or generate or store) is defined in kWh. For example, ‘My solar system produced 4 kWh of electricity today!’ or ‘My heater used 2 kWh of electricity today’ or ‘This battery can store up to 10 kWh of energy’.
_
It is common for people to mistakenly interchange the terms energy and power as if there were no difference. Most people do it all the time without noticing, even many electricians. Please don’t confuse kW and kWh. If you do, you may end up with a solar system that’s completely the wrong size. A simple way to estimate how much energy you can expect, on average, per day from a solar system is to multiply the system size by 4. For example, a 5 kW system will average around 20 kWh of energy production per day. How? 5kW system (5kW DC) will actually generate 4 kW AC electricity every second considering DC AC conversion factor 0.8; it comes to 4 kWh per hour and 5 peak sun hour per day would amount to 20 kWh per day.
Note:
A peak sun hour is defined as one hour in which the intensity of solar irradiance (sunlight) reaches an average of 1,000 watts (W) of energy per square meter throughout one hour, and that happens to be the exact amount of sunlight used to test and rate solar panels in the lab. In other words, one peak sun hour is 1 kWh radiation energy received in 1 square meter over 1 hour. Even though the average day is 12 hours, the power you actually get on your panels is equal to about 4 to 6 peak sun hours. For example, if insolation map in a given area says 6 kWh/m2/day, then you are getting about 6 peak sun hours of sunlight on the panel. Peak sun hour allows you to precisely measure the amount of irradiance (sunlight) that will hit solar panels installed in a given location. This, in turn, allows you to calculate the expected energy production for a given solar system size installed at that location. In other words, peak sun hours tell you how much power a solar installation on your roof will generate. They also allow you to compare sunlight availability between locations.
_
How much energy is wasted when converting DC power to AC in solar?
Remember solar PV generate DC power and it is converted in to AC power by inverter. DC to AC inverter efficiency is 80%. You have to multiply DC power by 0.8 to make it AC power.
For example, 100 watt DC = 80 watt AC.
_
One sun vs multiple suns:
Most terrestrial solar cells are tested under the global AM (air mass) 1.5 G (global) condition. The light intensity on a solar cell is called the number of suns, where 1 sun corresponds to standard illumination at AM1. 5, or 1 kW/m2 i.e. 1000w/m2. For example, a system with 10 kW/m2 incident on the solar cell would be operating at 10 suns. Light intensity on solar cell and solar collector can be increased by using mirrors and lenses from 1 sun (1000w/m2) to 10 suns (10000w/m2) to hundreds of suns for CPV and CSP.
______
______
Section-3
Solar radiation, irradiation and insolation:
Solar radiation is the heat and light and other radiation given off by the Sun. Nuclear reactions in the interior of the Sun maintain a central temperature of 16 million ° C, and a surface temperature of 5700°C. Like all hot objects, the Sun’s surface radiates energy at a rate and a colour (wavelength range) which depends on its temperature. The Sun emits radiation at a rate of 3.8 × 10^26 Watt, of which only two parts in a thousand million arrive at the Earth, with the rest disappearing into space or warming the other planets in our solar system.
_
Solar radiations are becoming increasingly appreciated because of their influence on living matter and the feasibility of its application for useful purposes. It is a perpetual source of natural energy that, along with other forms of renewable energy, has a great potential for a wide variety of applications because it is abundant and accessible. Solar radiation is rapidly gaining ground as a supplement to the nonrenewable sources of energy, which have a finite supply. The electromagnetic radiation emitted by the sun covers a very large range of wavelengths, from radio waves through the infrared, visible and ultraviolet to X-rays and gamma rays. However, 99 per cent of the energy of solar radiation is contained in the wavelength band from 0.15 to 4 μm, comprising the near ultraviolet, visible and near infrared regions of the solar spectrum, with a maximum at about 0.5 μm. About 40 per cent of the solar radiation received at the earth’s surface on clear days is visible radiation within the spectral range 0.4 to 0.7 μm, while 51 per cent is infrared radiation in the spectral region 0.7 to 4 μm.
_
The total radiation emitted by the sun in unit time remains practically constant. The variations actually observed in association with solar phenomena like sunspots, prominences and solar flares are mainly confined to the extreme ultraviolet end of the solar spectrum and to the radio waves. The contribution of these variations to the total energy emitted is extremely small and can be neglected in solar energy applications. The planet earth revolves around the sun in an elliptical orbit of very small eccentricity with the sun at one of the foci, completing one revolution in one year. The axis of rotation of the earth is inclined at about 23½ degrees with respect to the plane of orbital revolution and is directed always to a fixed point in space. As a consequence of this geometry of the sun and the earth, large seasonal variations occur in the amount of solar radiation received at different latitudes of the earth. The largest annual variations occur near the two poles and the smallest near the equator. During the course of its annual motion around the sun in an elliptical orbit, the earth comes nearest to the sun each year around January 5 (perihelion) and farthest around July 5 (aphelion). The sun-earth distance at perihelion is 1.471 × 10^8 km and at aphelion 1.521 × 10^8 km. The mean distance is 1.496 × 10^8 km, which is known as 1 Astronomical Unit. Due to the variations in the sun-earth distance, the solar radiation intercepted by the earth varies by ±3.3 per cent around the mean value, being maximum at the beginning of January and minimum at the beginning of July.
_
The Earth revolves around the sun in an elliptical orbit and is closer to the sun during part of the year. When the sun is nearer the Earth, the Earth’s surface receives a little more solar energy. The Earth is nearer the sun when it is summer in the southern hemisphere and winter in the northern hemisphere. However, the presence of vast oceans moderates the hotter summers and colder winters one would expect to see in the southern hemisphere as a result of this difference.
The 23.5° tilt in the Earth’s axis of rotation is a more significant factor in determining the amount of sunlight striking the Earth at a particular location. Tilting results in longer days in the northern hemisphere from the spring (vernal) equinox to the fall (autumnal) equinox and longer days in the southern hemisphere during the other 6 months. Days and nights are both exactly 12 hours long on the equinoxes, which occur each year on or around March 23 and September 22.
Countries such as the United States, which lie in the middle latitudes, receive more solar energy in the summer not only because days are longer, but also because the sun is nearly overhead. The sun’s rays are far more slanted during the shorter days of the winter months. Cities such as Denver, Colorado, (near 40° latitude) receive nearly three times more solar energy in June than they do in December.
The rotation of the Earth is also responsible for hourly variations in sunlight. In the early morning and late afternoon, the sun is low in the sky. Its rays travel further through the atmosphere than at noon, when the sun is at its highest point. On a clear day, the greatest amount of solar energy reaches a solar collector around solar noon.
_
Of the entire quantity of radiant energy emitted by the sun’s spherical surface, only a small fraction is actually intercepted by the planet earth. The amount of solar energy falling in unit time on unit area, held normal to the sun’s rays outside the earth’s atmosphere when the earth is at the mean distance from the sun, is called the solar constant. According to the latest measurements, the solar constant has a value of 1.36 kW/m2.
_.
The amount of radiant energy emitted by the sun is called solar radiation, while solar irradiation refers to the amount of solar radiation received from the Sun per unit area which is expressed in (kW/ m²). It can be said that radiation is the number of photons that are emitted by a single source, while irradiation refers to the radiation falling on a surface. Insolation is the amount of solar energy that strikes a given area over a specific time, and varies with latitude or the seasons. After passing through the Earth’s atmosphere, most of the Sun’s energy is in the form of visible light and infrared light radiation. Plants convert the energy in sunlight into chemical energy (sugars and starches) through the process of photosynthesis. Humans regularly use this store of energy in various ways, as when they burn wood off fossil fuels, or when simply eating plants, fish and animals. Solar radiation reaches the Earth’s upper atmosphere with the power of 1366 watts per square meter (W/m2). Since the Earth is round, the surface nearer its poles is angled away from the Sun and receives much less solar energy than the surface nearer the equator.
_____
The Solar Zenith Angle and Azimuth Angle:
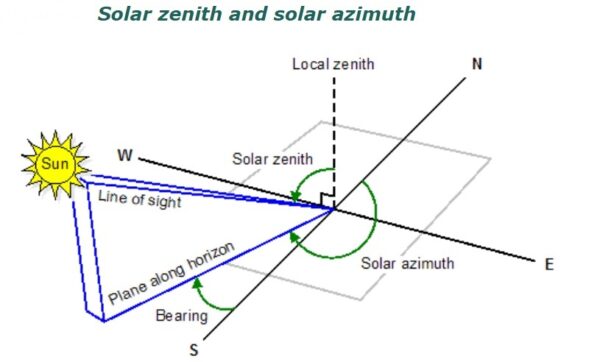
The solar azimuth and solar zenith express the position of the sun. The solar zenith is the angle measured from the local zenith and the line of sight of the sun. The angle at which the light intercepts the atmosphere is the governing factor in the irradiance at the top of the atmosphere. This angle is called the solar zenith angle, the angle between the sun’s rays and local vertical. Due to the spherical shape of the Earth, the greater zenith angle, the larger the area that the sun’s rays are spread over and the lower the intensity.
Most surfaces are not perpendicular to the Sun, and the energy they receive depends on their solar zenith angle. Solar zenith angle is 0 for the overhead Sun. This angle changes systematically with latitude, the time of year, and the time of day. Equatorial regions receive sunlight more perpendicularly than polar regions, so in general the further the latitude is from 0°, the lower the irradiance. At different times of the year, different latitudes are directly facing the sun. At the solar equinoxes (March and September), the equator points directly at the sun (i.e., lies on the ecliptic plane) and receives normally incident sunlight. At the June and December solstices, the tropics of Cancer and Capricorn respectively point towards the sun and receive the highest irradiance.
The other main factor is the length of daylight. For latitudes poleward of 66.5° N and S, the length of day ranges from zero (winter solstice) to 24 hours (summer solstice), whereas the Equator has a constant 12-hour day throughout the year.
The solar azimuth angle is the azimuth (horizontal angle with respect to north) of the Sun’s position. This horizontal coordinate defines the Sun’s relative direction along the local horizon, whereas the solar zenith angle (or its complementary angle solar elevation) defines the Sun’s apparent altitude. The solar azimuth is the angle of the direction of the sun measured clockwise north from the horizon. The solar zenith is the angle measured from the local zenith and the line of sight of the sun.
For a geographic location, the azimuth is the horizontal angle of the sun rays. At solar noon, the sun is always oriented to the south in the northern hemisphere and oriented to the north in the southern hemisphere.
______
Sunlight has two components: the “direct beam” that carries about 85% of the solar energy and the “diffuse sunlight” that carries the remainder – the diffuse portion is the blue sky on a clear day, and is a larger proportion of the total on cloudy days. As sunlight passes through the atmosphere, some of it is absorbed, scattered, and reflected by:
- Air molecules
- Water vapor
- Clouds
- Dust
- Pollutants
- Forest fires
- Volcanoes.
This is called diffuse solar radiation. The solar radiation that reaches the Earth’s surface without being diffused is called direct beam solar radiation. The sum of the diffuse and direct solar radiation is called global solar radiation.
When the sky is clear and the sun is very high in the sky, direct radiation is around 85% of the total insolation striking the ground and diffuse radiation is about 15%. As the sun goes lower in the sky, the percent of diffuse radiation keeps going up until it reaches 40% when the sun is 10° above the horizon.
As the majority of the energy is in the direct beam, maximizing collection requires the Sun to be visible to the panels for as long as possible. However, on cloudier days the ratio of direct vs. diffuse light can be as low as 60:40 or even lower.
The energy contributed by the direct beam drops off with the cosine of the angle between the incoming light and the panel (zenith angle). In addition, the reflectance (averaged across all polarizations) is approximately constant for angles of incidence up to around 50°, beyond which reflectance increases rapidly.
_____
Solar Constant:
The fraction of the energy flux emitted by the sun and intercepted by the earth is characterized by the solar constant. The solar constant is defined as essentially the measure of the solar energy flux density perpendicular to the ray direction per unit area per unit of time. It is most precisely measured by satellites outside the earth atmosphere. The solar constant is currently estimated at 1361 W/m2 [Kopp and Lean, 2011]. This number actually varies by 3% because the orbit of the earth is elliptical, and the distance from the sun varies over the course of the year. Some small variation of the solar constant is also possible due to changes in Sun’s luminosity. This measured value includes all types of radiation, a substantial fraction of which is lost as the light passes through the atmosphere.
_
Transformations in the Atmosphere:
As the solar radiation passes through the atmosphere, it gets absorbed, scattered, reflected, or transmitted. All these processes result in reduction of the energy flux density. Actually, the solar flux density is reduced by about 30% compared to extraterrestrial radiation flux on a sunny day and is reduced by as much as 90% on a cloudy day. As a result, the direct radiation reaching the earth surface (or a device installed on the earth surface) never exceeds 83% of the original extraterrestrial energy flux. This radiation that comes directly from the solar disk is defined as beam radiation. The scattered and reflected radiation that is sent to the earth surface from all directions (reflected from other bodies, molecules, particles, droplets, etc.) is defined as diffuse radiation. The sum of the beam and diffuse components is defined as total (or global) radiation.
The raw power from our sun which reaches the outer atmosphere of the earth is about 1366 Watts per square meter (1.36 kW/m2) above the cloud layer. This amount is then reduced down by the atmosphere and protective layers to arrive at the earth’s surface at midday from a cloudless sky at about 1000 watts per square meter (1.0 kW/m2) or slightly less.
Solar energy contains a direct component, which is light from the solar beam, and a diffuse component, which is light that has been scattered by the atmosphere. This distinction is important because only the direct solar component can be effectively focused by mirrors or lenses. The direct component typically accounts for 60–80 percent of the total solar insolation in clear sky conditions and decreases with increasing humidity, cloud cover, and atmospheric aerosols such as dust or pollution plumes. Technologies that rely on the direct solar component such as CSP plants work best in areas with high direct normal irradiance, which generally limits their application to arid regions. Nonconcentrated solar technologies such as PV panels can use both the direct and diffuse solar components and are not as geographically limited in their application.
______
Solar Radiation Metrics:
Consider the following metrics commonly used to report the solar resource (irradiance) data. These values can be determined from the field measurements or from empirical correlations.
|
Solar Radiation Metrics |
|||
|
Metric |
Definition |
Data Source |
Tool |
|
DNI |
Direct Normal Irradiance (W/m2) |
Measured on the surface perpendicular to the beam |
Pyrheliometer |
|
DHI |
Diffuse Horizontal Irradiance (W/m2) (also may be denoted DIFF) |
Measured on the horizontal surface |
Pyranometer (shaded) |
|
GHI |
Global Horizontal Irradiance (W/m2) – includes both beam and diffuse components |
Measured on the horizontal surface |
Pyranometer |
Theoretically, these three metrics are interrelated:
GHI = (𝐷𝑁𝐼×𝑐𝑜𝜃𝑧) +𝐷𝐻𝐼 where θz = solar zenith angle
However, in practice, field measurements may somewhat deviate from this relationship.
A typical solar resource data file (Typical Meteorological Year or TMY) would include all of these metrics measured for a specific location for each hour for each day in a year. Note that these values (measured in W/m2) indicate the instantaneous solar flux, which of course will vary during the day. In the morning and in the evening, the irradiance will be lower, but it will often reach its peak around solar noon. If there are clouds or other weather phenomena, the irradiance will temporarily drop.
The SI unit of irradiance is watts per square metre (W/m2). The unit of insolation often used in the solar power industry is kilowatt hours per square metre (kWh/m2).
The Langley is an alternative unit of insolation. One Langley is one thermochemical calorie per square centimetre or 41,840 J/m2.
_____
Solar resource (kWh/m2/day):
The mean annual solar energy resource is frequently expressed as the amount of radiant energy received on a given surface area per unit time (kWh/m2/day). This incident solar energy is shown globally in Figure below.
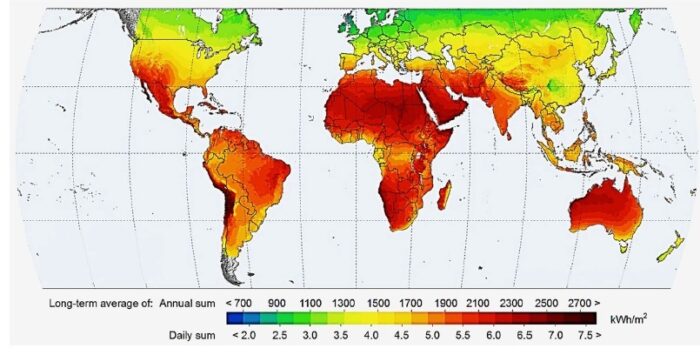
Figure above shows maps of global horizontal irradiation (GHI).
The earth at sea level receives about 1,000 Watts per square meter at high noon on clear day. Even though the average day is 12 hours, the power you actually get on your panels is equal to about 5 to 6 hours of full sun per day. If the map says 6 kWh/m2/day, then you are getting about 6 full hours of sunlight on the panel. Modern solar panels are around 20% efficient, so that works out to approximately 200 watts per square meter, or 20 watts per square foot. The panel is facing South in northern hemisphere, and tilted at the same angle as the latitude. If you look at roadmap and see the latitude is 23 degrees, then the panel would be tilted at 23 degrees.
Solar irradiation figures are used to plan the deployment of solar power systems. In many countries, the figures can be obtained from an insolation map or from insolation tables that reflect data over the prior 30–50 years. Different solar power technologies are able to use different components of the total irradiation. While solar photovoltaics panels are able to convert to electricity both direct irradiation and diffuse irradiation, concentrated solar power is only able to operate efficiently with direct irradiation, thus making these systems suitable only in locations with relatively low cloud cover.
Because solar collectors panels are almost always mounted at an angle towards the Sun, insolation figures must be adjusted to find the amount of sunlight falling on the panel. This will prevent estimates that are inaccurately low for winter and inaccurately high for summer. This also means that the amount of sunlight falling on a solar panel at high latitude is not as low compared to one at the equator as would appear from just considering insolation on a horizontal surface. Horizontal insolation values range from 800 to 950 kWh/m2/y in Norway to up to 2,900 kWh/m2/y in Australia. But a properly tilted panel at 50° latitude receives 1860 kWh/m2/y, compared to 2370 at the equator.
Photovoltaic panels are rated under standard conditions to determine the Wp (peak watts) rating, which can then be used with insolation, adjusted by factors such as tilt, tracking and shading, to determine the expected output.
______
______
Section-4
Solar energy:
Solar energy is created by nuclear fusion that takes place in the sun. Fusion occurs when protons of hydrogen atoms violently collide in the sun’s core and fuse to create a helium atom. This process, known as a PP (proton-proton) chain reaction, emits an enormous amount of energy. In stars that are about 1.3 times bigger than the sun, the CNO cycle drives the creation of energy. The CNO cycle also converts hydrogen to helium, but relies on carbon, nitrogen, and oxygen (C, N, and O) to do so. Currently, less than two percent of the sun’s energy is created by the CNO cycle. Nuclear fusion by the PP chain reaction or CNO cycle releases tremendous amounts of energy in the form of waves and particles. Solar energy is constantly flowing away from the sun and throughout the solar system. Solar energy warms Earth, causes wind and weather, and sustains plant and animal life. The energy, heat, and light from the sun flow away in the form of electromagnetic radiation (EMR).
_
The electromagnetic spectrum exists as waves of different frequencies and wavelengths. The frequency of a wave represents how many times the wave repeats itself in a certain unit of time. Waves with very short wavelengths repeat themselves several times in a given unit of time, so they are high-frequency. In contrast, low-frequency waves have much longer wavelengths.
The vast majority of electromagnetic waves are invisible to us. The most high-frequency waves emitted by the sun are gamma rays, X-rays, and ultraviolet radiation (UV rays). The most harmful UV rays are almost completely absorbed by Earth’s atmosphere. Less potent UV rays travel through the atmosphere, and can cause sunburn.
The sun also emits infrared radiation, whose waves are much lower-frequency. Most heat from the sun arrives as infrared energy.
Sandwiched between infrared and UV is the visible spectrum, which contains all the colors we see on Earth. The color red has the longest wavelengths (closest to infrared), and violet (closest to UV) the shortest.
_
Sunshine is radiant energy from the sun. The amount of solar radiation, or solar energy, that the earth receives each day is many times greater than the total amount of all energy that people consume each day. However, on the earth’s surface, solar energy is a variable and intermittent energy source. Nevertheless, use of solar energy, especially for electricity generation, has increased significantly around the world in the past 30 years.
Solar energy resources vary by location:
Energy from the sun travels to the earth in the form of electromagnetic radiation similar to radio waves, but in a different frequency range. Available solar energy is often expressed in units of energy per time per unit area, such as Watts per square metre (W/m2). 1 Watt = 1 Joule per second. The amount of energy available from the sun outside the Earth’s atmosphere is approximately 1366 W/m2. Some of the solar energy is reflected/absorbed as it passes through the Earth’s atmosphere. As a result, on a clear day the amount of solar energy available at the Earth’s surface in the direction of the sun is typically 1000 W/m2.
The availability and intensity of solar radiation on the earth’s surface varies by time of day and location. In general, the intensity of solar radiation at any location is greatest when the sun is at its highest apparent position in the sky—at solar noon—on clear, cloudless days.
Latitude, seasons, and weather patterns are major factors that affect insolation— the amount of solar radiation received on a given surface area during a specific amount of time. Locations in lower latitudes and in arid climates generally receive higher amounts of insolation than other locations. Clouds, dust, volcanic ash, and pollution in the atmosphere affect insolation levels at the surface. Buildings, trees, and mountains may shade a location during different times of the day in different months of the year. Seasonal (monthly) variations in solar resources increase with increasing distance from the earth’s equator.
The type of solar collector also determines the type of solar radiation and level of insolation that a solar collector receives. Concentrating solar collector systems, such as those used in solar thermal-electric power plants, require direct solar radiation, which is generally greater in arid regions with few cloudy days. Flat-plate solar thermal and photovoltaic (PV) collectors can use global solar radiation, which includes diffuse (scattered) and direct solar radiation.
In general, a solar energy collector with a tracking system that keeps the solar collectors oriented toward the sun will have higher levels of daily and annual insolation than a solar collector in a fixed position.
_____
_____
Energy from the sun can be collected and utilized in a variety of different ways as follows: (1) direct thermal applications involving collection of sunlight by solar thermal collectors for heating and cooling of buildings, heating water, distillation, or providing industrial and agricultural process heat; (2) solar electric applications in which energy from the sun is transformed into electricity by solar-thermal-electric, photovoltaic, wind, or ocean-thermal conversion systems; and (3) fuels from biomass, involving the production of fuels such as wood, methane, alcohols, or hydrogen from vegetation.
_
Solar is the intermittent source of energy as it is subject to the rotation of the Earth (so that the Sun light hits the Earth only during the day period) and its rotation around the Sun, providing seasonality of the solar energy. The promising fact is that solar energy is the intrinsic source of other forms of renewable energy like wind, bioenergy, ocean, and is the initiator for major cycles and fossil fuels. Directly, solar energy has been used by humankind since centuries for heating and cooking purposes. The idea to convert solar energy into other forms, and especially into electricity, has been of vital importance among the scientists and engineers.
_
Solar energy could be a best option for the future world because of several reasons:
First, solar energy is the most abundant energy source of renewable energy and sun emits it at the rate of 3.8 x 10^23 kW, out of which approximately 1.8 X 10^14 kW is intercepted by the earth. Solar energy reaches the earth in various forms like heat and light. Studies revealed that global energy demand can be fulfilled by using solar energy satisfactorily as it is abundant in nature and freely available source of energy with no cost.
Second, it is a promising source of energy in the world because it is not exhaustible, giving solid and increasing output efficiencies than other sources of energy. Solar radiation distribution and its intensity are two key factors which determine efficiency of solar PV industry. Such two parameters are highly variable over the countries. Asian countries have highest potential to receive solar radiation compared to other temperate countries as sunshine duration in such countries is high in a year. It is important to note that much of solar radiation is not used and basically wasted. In many countries, particularly developing countries, solar radiation is intrinsic in quantity which makes beneficial utility. For example, Sri Lanka’s average solar radiation of about 15–20 MJ/m2/day (4.2 to 5.6 kWh/m2/day)
Third, utilization and tracking of solar energy do not have any harmful impact on ecosystem in which natural balance is kept consistent for the betterment of living organisms. Exploitation of fossil fuel leads to ecosystems damage which in-turn damages natural balance.
Forth, solar system can effectively be used for village system, industrial operations and homes, since it is easily affordable and applicable.
_
Why is solar energy important:
- Sustainability and renewability: Unlike fossil fuels, which are finite, the sun is a perpetual source of energy. This makes solar power a sustainable and renewable energy source, ensuring that we don’t run out of it in the foreseeable future.
- Reduction in greenhouse gas emissions: Solar panels produce electricity without emitting greenhouse gases. By transitioning to solar energy, we can significantly reduce our carbon footprint, combatting the adverse effects of climate change.
- Economic benefits: The cost of solar panels has plummeted over the years, and the significant decrease in upfront costs makes solar power a more accessible option for many. This allows individuals, businesses, and communities worldwide to reap the economic benefits of solar energy, including reductions in electricity bills, low maintenance costs, and participation in programs like net metering and rebates.
- Job creation: Solar industry has created jobs worldwide, boosting economies and providing employment opportunities. The solar industry is a vast network of jobs, comprising much more than just solar panel installation. It encompasses everything from research and development to sales and marketing. As the demand for clean energy grows, so does the labour market in the solar sector. According to the International Renewable Energy Agency (IRENA), the solar industry employed 4.3 million people in 2021. This number is set to rise as more countries invest in solar infrastructure.
- Energy independence: Relying on solar energy reduces dependence on foreign oil and imported fossil fuels, fostering energy security for nations. It also allows homeowners and businesses to reduce their reliance on the energy grid.
- Prevention of habitat destruction: To extract essential raw materials, such as nuclear or fossil fuels, precious forests are cut down. For their food, trees constantly extract carbon dioxide from the atmosphere and store it in their forests. This major carbon sink is gone when forests are cleared for the mining of raw materials for conventional energy. Also, it is a major contributor to climate change. According to WWF, eight out of ten animals living on land live in forests. A loss of forest habitats could result in a decline in their numbers. It is essential to convert to solar power in order to protect these habitats for animals that live there and also to keep the air clean.
_____
_____
Active and passive solar technologies:
Solar energy is radiant light and heat from the Sun that is harnessed using a range of technologies such as solar power to generate electricity, solar thermal energy (including solar water heating), and solar architecture. It is an essential source of renewable energy, and its technologies are broadly characterized as either passive solar or active solar depending on how they capture and distribute solar energy or convert it into solar power. Active solar techniques use photovoltaics, concentrated solar power, solar thermal collectors, pumps, and fans to convert sunlight into useful output. Passive solar techniques include selecting materials with favorable thermal properties, designing spaces that naturally circulate air, and referencing the position of a building to the Sun. Active solar technologies increase the supply of energy and are considered supply side technologies, while passive solar technologies reduce the need for alternative resources and are generally considered demand-side technologies.
-1. Passive solar technologies involve the accumulation of solar energy without transforming thermal or light energy into any other form. This is mostly used, for instance, for collecting, storing, and distributing solar energy for heating purposes.
-2. Active solar technologies collect solar radiant energy and use special equipment to convert it into other forms of energy, e.g., heat or electricity. These technologies can be further grouped into two major categories:
-Solar thermal technology that collects and concentrates solar energy by special devices and further converts it into electricity through other forms, and
-Photovoltaic technology that enables the direct conversion of solar energy using semiconductor devices.
On the industrial scale, both active solar technology options — photovoltaic and solar thermal — are implemented. The intense research efforts of energy scientists with regard to solar options have helped to yield an improved efficiency of photovoltaic technology, which enabled increasing the speed of solar photovoltaic deployment for industrial electricity generation scale. Similarly, solar thermal technologies have also been economically feasible for large electricity generation. This is achieved through the concentrating solar power technology — an approach that allows collecting solar radiation and using its energy to convert liquid into steam and employ steam turbine cycle for electricity generation.
In 2011, the International Energy Agency said that “the development of affordable, inexhaustible and clean solar energy technologies will have huge longer-term benefits. It will increase countries’ energy security through reliance on an indigenous, inexhaustible, and mostly import-independent resource, enhance sustainability, reduce pollution, lower the costs of mitigating global warming …. these advantages are global”.
______
Passive Solar Architecture:
Throughout the course of a day, solar energy is part of the process of thermal convection, or the movement of heat from a warmer space to a cooler one. When the sun rises, it begins to warm objects and material on Earth. Throughout the day, these materials absorb heat from solar radiation. At night, when the sun sets and the atmosphere has cooled, the materials release their heat back into the atmosphere. Passive solar energy techniques take advantage of this natural heating and cooling process.
_
Passive solar heating:
A successful design must include the following elements:
- Aperture —a large glass area through which sunlight enters the building, should face within 30 degrees of true south and should not be shaded between 9 a.m. and 3 p.m. during the heating season.
- Thermal mass—commonly concrete, brick, stone, and tile. These materials absorb heat from the sunlight during the heating season and also absorb heat from warm interior air during the cooling season.
- Distribution— a method by which solar heat is transferred from where it is collected and stored to different areas of the house by conduction, convection, and radiation.
- Control—devices such as roof overhangs used to shade the aperture area during summer months.
Passive solar heating systems capture sunlight within the building’s materials and then release that heat during periods when the sun is absent, such as at night. South-facing glass and thermal mass to absorb, store, and distribute heat are necessary in the design.
_
Homes and other buildings use passive solar energy to distribute heat efficiently and inexpensively. Calculating a building’s “thermal mass” is an example of this. A building’s thermal mass is the bulk of material heated throughout the day. Examples of a building’s thermal mass are wood, metal, concrete, clay, stone, or mud. At night, the thermal mass releases its heat back into the room. Effective ventilation systems—hallways, windows, and air ducts—distribute the warmed air and maintain a moderate, consistent indoor temperature.
Passive solar technology is often involved in the design of a building. For example, in the planning stage of construction, the engineer or architect may align the building with the sun’s daily path to receive desirable amounts of sunlight. This method takes into account the latitude, altitude, and typical cloud cover of a specific area. In addition, buildings can be constructed or retrofitted to have thermal insulation, thermal mass, or extra shading.
In passive solar building design, windows, walls, and floors are made to collect, store, reflect, and distribute solar energy, in the form of heat in the winter and reject solar heat in the summer. This is called passive solar design because, unlike active solar heating systems, it does not involve the use of mechanical and electrical devices. It is very important to avoid oversizing south-facing glass and ensure that south-facing glass is properly shaded to prevent overheating and increased cooling loads in the spring and fall.
_
Other examples of passive solar architecture are cool roofs, radiant barriers, and green roofs.
Cool roofs are painted white, and reflect the sun’s radiation instead of absorbing it. The white surface reduces the amount of heat that reaches the interior of the building, which in turn reduces the amount of energy that is needed to cool the building.
Radiant barriers work similarly to cool roofs. They provide insulation with highly reflective materials, such as aluminum foil. The foil reflects, instead of absorbs, heat, and can reduce cooling costs up to 10 percent. In addition to roofs and attics, radiant barriers may also be installed beneath floors.
Green roofs are roofs that are completely covered with vegetation. They require soil and irrigation to support the plants, and a waterproof layer beneath. Green roofs not only reduce the amount of heat that is absorbed or lost, but also provide vegetation. Through photosynthesis, the plants on green roofs absorb carbon dioxide and emit oxygen. They filter pollutants out of rainwater and air, and offset some of the effects of energy use in that space.
Green roofs have been a tradition in Scandinavia for centuries, and have recently become popular in Australia, Western Europe, Canada, and the United States. For example, the Ford Motor Company covered 42,000 square meters (450,000 square feet) of its assembly plant roofs in Dearborn, Michigan, with vegetation. In addition to reducing greenhouse gas emissions, the roofs reduce stormwater runoff by absorbing several centimeters of rainfall.
Green roofs and cool roofs can also counteract the “urban heat island” effect. In busy cities, the temperature can be consistently higher than the surrounding areas. Many factors contribute to this: Cities are constructed of materials such as asphalt and concrete that absorb heat; tall buildings block wind and its cooling effects; and high amounts of waste heat is generated by industry, traffic, and high populations. Using the available space on the roof to plant trees, or reflecting heat with white roofs, can partially alleviate local temperature increases in urban areas.
_
Passive Solar Cooling:
Passive solar cooling systems use shading, thermal mass, and natural ventilation to reduce unwanted daytime heat and store cool night air to moderate temperatures.
_____
Photovoltaics:
Photovoltaics is a form of active solar technology that was discovered in 1839 by 19-year-old French physicist Alexandre-Edmond Becquerel. Becquerel discovered that when he placed silver-chloride in an acidic solution and exposed it to sunlight, the platinum electrodes attached to it generated an electric current. This process of generating electricity directly from solar radiation is called the photovoltaic effect, or photovoltaics.
Today, photovoltaics is probably the most familiar way to harness solar energy. Photovoltaic arrays usually involve solar panels, a collection of dozens or even hundreds of solar cells.
Each solar cell contains a semiconductor, usually made of silicon. When the semiconductor absorbs sunlight, it knocks electrons loose. An electrical field directs these loose electrons into an electric current, flowing in one direction. Metal contacts at the top and bottom of a solar cell direct that current to an external object. The external object can be as small as a solar-powered calculator or as large as a power station.
Photovoltaics was first widely used on spacecraft. Many satellites, including the International Space Station (ISS), feature wide, reflective “wings” of solar panels. The ISS has two solar array wings (SAWs), each using about 33,000 solar cells. These photovoltaic cells supply all electricity to the ISS, allowing astronauts to operate the station, safely live in space for months at a time, and conduct scientific and engineering experiments.
Photovoltaic power stations have been built all over the world. The largest stations are in the United States, India, and China. These power stations emit hundreds of megawatts of electricity, used to supply homes, businesses, schools, and hospitals.
Photovoltaic technology can also be installed on a smaller scale. Solar panels and cells can be fixed to the roofs or exterior walls of buildings, supplying electricity for the structure. They can be placed along roads to light highways. Solar cells are small enough to power even smaller devices, such as calculators, parking meters, trash compactors, and water pumps.
_____
Concentrated Solar Energy:
Another type of active solar technology is concentrated solar energy or concentrated solar power (CSP). CSP technology uses lenses and mirrors to focus (concentrate) sunlight from a large area into a much smaller area. This intense area of radiation heats a fluid, which in turn generates electricity or fuels another process.
Solar furnaces are an example of concentrated solar power. There are many different types of solar furnaces, including solar power towers, parabolic troughs, and Fresnel reflectors. They use the same general method to capture and convert energy.
Solar power towers use heliostats, flat mirrors that turn to follow the sun’s arc through the sky. The mirrors are arranged around a central “collector tower,” and reflect sunlight into a concentrated ray of light that shines on a focal point on the tower.
In previous designs of solar power towers, the concentrated sunlight heated a container of water, which produced steam that powered a turbine. More recently, some solar power towers use liquid sodium, which has a higher heat capacity and retains heat for a longer period of time. This means that the fluid not only reaches temperatures of 773 to 1,273K (500° to 1,000° C or 932° to 1,832° F), but it can continue to boil water and generate power even when the sun is not shining.
Parabolic troughs and Fresnel reflectors also use CSP, but their mirrors are shaped differently. Parabolic mirrors are curved, with a shape similar to a saddle. Fresnel reflectors use flat, thin strips of mirror to capture sunlight and direct it onto a tube of liquid. Fresnel reflectors have more surface area than parabolic troughs and can concentrate the sun’s energy to about 30 times its normal intensity.
Concentrated solar power plants were first developed in the 1980s. The largest facility in the world is a series of plants in Mojave Desert in the U.S. state of California. This Solar Energy Generating System (SEGS) generates more than 650 gigawatt-hours of electricity every year. Other large and effective plants have been developed in Spain and India.
_
Concentrated solar power can also be used on a smaller scale. It can generate heat for solar cookers, for instance. People in villages all over the world use solar cookers to boil water for sanitation and to cook food. Solar cookers provide many advantages over wood-burning stoves: They are not a fire hazard, do not produce smoke, do not require fuel, and reduce habitat loss in forests where trees would be harvested for fuel. Solar cookers also allow villagers to pursue time for education, business, health, or family during time that was previously used for gathering firewood. Solar cookers are used in areas as diverse as Chad, Israel, India, and Peru.
______
Potential of solar energy:
The potential solar energy that could be used by humans differs from the amount of solar energy present near the surface of the planet because factors such as geography, time variation, cloud cover, and the land available to humans limit the amount of solar energy that we can acquire. In 2021, Carbon Tracker Initiative estimated the land area needed to generate all our energy from solar alone was 450,000 km2 — or about the same as the area of Sweden, or the area of Morocco, or the area of California (0.3% of the Earth’s total land area).
Solar technologies are categorized as either passive or active depending on the way they capture, convert and distribute sunlight and enable solar energy to be harnessed at different levels around the world, mostly depending on the distance from the Equator. Although solar energy refers primarily to the use of solar radiation for practical ends, all types of renewable energy, other than geothermal power and tidal power, are derived either directly or indirectly from the Sun.
_____
Figure below shows the development of the installed capacities of photovoltaic (PV) and thermal solar (CSP) technologies up to 2017. Asia eclipsed all other markets for PV technology, accounting for about two-thirds of global additions. The top markets — China, the United States, Japan, India, and the United Kingdom — accounted for about 85% of PV additions in 2016. For the cumulative PV capacity, the top countries included China, Japan, Germany, and the United States. While China continued to dominate both the use and manufacturing of solar PV, emerging markets on all continents have begun to contribute significantly to global growth. By the end of 2016, every continent had installed at least 1 GW of PV capacities, at least 24 countries had 1 GW or more of PV capacity, and at least 114 countries had more than 10 MW.
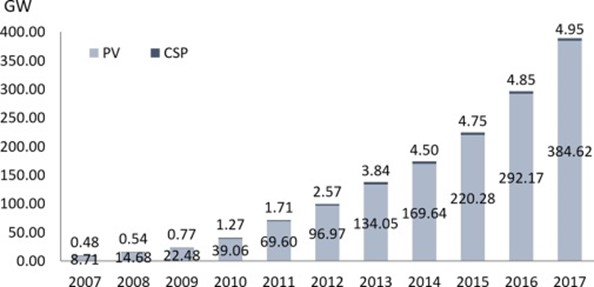
Figure above shows Solar energy installed capacity up to 2017.
Solar energy installed capacity growth shows that PV technology dominates the market due to its massive use both in private and industrial electricity generating applications. Solar thermal CSP technology is much smaller and it is utility scale only.
_____
_____
Section-5
Development and history of solar technologies:
We’re taking a deeper dive into the history of solar to understand the roots of where we are today and how we can supercharge the adoption of this fascinating technology as we work to decarbonize our economy. It all began with Edmond Becquerel, a young physicist working in France, who in 1839 observed and discovered the photovoltaic effect— a process that produces a voltage or electric current when exposed to light or radiant energy. A few decades later, French mathematician Augustin Mouchot was inspired by the physicist’s work. He began registering patents for solar-powered engines in the 1860s. From France to the U.S., inventors were inspired by the patents of the mathematician and filed for patents on solar-powered devices as early as 1888.
_
The early development of solar technologies starting in the 1860s was driven by an expectation that coal would soon become scarce. Charles Fritts installed the first solar panels on New York City rooftop in 1884. Take a light step back to 1883 when New York inventor Charles Fritts created the first solar cell by coating selenium with a thin layer of gold. Fritts reported that the selenium module produced a current “that is continuous, constant, and of considerable force.” This cell achieved an energy conversion rate of 1 to 2 percent. Most modern solar cells work at an efficiency of 15 to 20 percent. So, Fritts created what was a low impact solar cell, but still, it was the beginning of photovoltaic solar panel innovation in America. Named after Italian physicist, chemist and pioneer of electricity and power, Alessandro Volta, photovoltaic is the more technical term for turning light energy into electricity, and used interchangeably with the term photoelectric.
_
Only a few years later in 1888, inventor Edward Weston received two patents for solar cells – U.S. Patent 389,124 and U.S. Patent 389,425. For both patents, Weston proposed, “to transform radiant energy derived from the sun into electrical energy, or through electrical energy into mechanical energy.” Light energy is focused via a lens (f) onto the solar cell (a), “a thermopile (an electronic device that converts thermal energy into electrical energy) composed of bars of dissimilar metals.” The light heats up the solar cell and causes electrons to be released and current to flow. In this instance, light creates heat, which creates electricity; this is the exact reverse of the way an incandescent light bulb works, converting electricity to heat that then generates light.
_
That same year, a Russian scientist by the name of Aleksandr Stoletov created the first solar cell based on the photoelectric effect, which is when light falls on a material and electrons are released. This effect was first observed by a German physicist, Heinrich Hertz. In his research, Hertz discovered that more power was created by ultraviolet light than visible light. Today, solar cells use the photoelectric effect to convert sunlight into power. In 1894, American inventor Melvin Severy received patents 527,377 for an “Apparatus for mounting and operating thermopiles” and 527,379 for an “Apparatus for generating electricity by solar heat.” Both patents were essentially early solar cells based on the discovery of the photoelectric effect. The first generated “electricity by the action of solar heat upon a thermo-pile” and could produce a constant electric current during the daily and annual movements of the sun, which alleviated anyone from having to move the thermopile according to the sun’s movements. Severy’s second patent from 1889 was also meant for using the sun’s thermal energy to produce electricity for heat, light and power. The “thermos piles,” or solar cells as we call them today, were mounted on a standard to allow them to be controlled in the vertical direction as well as on a turntable, which enabled them to move in a horizontal plane. “By the combination of these two movements, the face of the pile can be maintained opposite the sun all times of the day and all seasons of the year,” reads the patent.
_
Almost a decade later, American inventor Harry Reagan received patents for thermal batteries, which are structures used to store and release thermal energy. The thermal battery was invented to collect and store heat by having a large mass that can heat up and release energy. It does not store electricity but “heat,” however, systems today use this technology to generate electricity by conventional turbines. In 1897, Reagan was granted U.S. patent 588,177 for an “application of solar heat to thermo batteries.” In the claims of the patent, Reagan said his invention included “a novel construction of apparatus in which the sun’s rays are utilized for heating thermo-batteries, the object being to concentrate the sun’s rays to a focus and have one set of junctions of a thermo-battery at the focus of the rays, while suitable cooling devices are applied to the other junctions of said thermo-battery.” His invention was a means to collecting, storing and distributing solar heat as needed. In 1913, William Coblentz, of Washington, D.C., received patent 1,077,219 for a “thermal generator,” which was a device that used light rays “to generate an electric current of such a capacity to do useful work.” He also meant for the invention to have cheap and strong construction. Although this patent was not for a solar panel, these thermal generators were invented to either convert heat directly into electricity or to transform that energy into power for heating and cooling.
_
By the 1950s, Bell Laboratories realized that semiconducting materials such as silicon were more efficient than selenium. They managed to create a solar cell that was 6 percent efficient. Inventors Daryl Chapin, Calvin Fuller, and Gerald Pearson (inducted to the National Inventors Hall of Fame in 2008) were the brains behind the silicon solar cell at Bell Labs. While it was considered the first practical device for converting solar energy to electricity, it was still cost prohibitive for most people. Silicon solar cells are expensive to produce, and when you combine multiple cells to create a solar panel, it’s even more expensive for the public to purchase. University of Delaware is credited with creating one of the first solar buildings, “Solar One,” in 1973. The construction ran on a combination of solar thermal and solar photovoltaic power. The building didn’t use solar panels; instead, solar was integrated into the rooftop.
_
By the 1970s, solar panels were still too expensive for much other than satellites. In 1974 it was estimated that only six private homes in all of North America were entirely heated or cooled by functional solar power systems. However, the 1973 oil embargo and 1979 energy crisis caused a reorganization of energy policies around the world and brought renewed attention to developing solar technologies. Deployment strategies focused on incentive programs such as the Federal Photovoltaic Utilization Program in the US and the Sunshine Program in Japan. Other efforts included the formation of research facilities in the United States (SERI, now NREL), Japan (NEDO), and Germany (Fraunhofer ISE). Between 1970 and 1983 installations of photovoltaic systems grew rapidly.
_
Mid-1990s to 2010
In the mid-1990s development of both, residential and commercial rooftop solar as well as utility-scale photovoltaic power stations began to accelerate again due to supply issues with oil and natural gas, global warming concerns, and the improving economic position of PV relative to other energy technologies. In the early 2000s, the adoption of feed-in tariffs— a policy mechanism, that gives renewables priority on the grid and defines a fixed price for the generated electricity—led to a high level of investment security and to a soaring number of PV deployments in Europe.
_
2010s
For several years, worldwide growth of solar PV was driven by European deployment, but it then shifted to Asia, especially China and Japan, and to a growing number of countries and regions all over the world. The largest manufacturers of solar equipment were based in China. Although concentrated solar power capacity grew more than tenfold, it remained a tiny proportion of the total, because the cost of utility-scale solar PV fell by 85% between 2010 and 2020, while CSP costs only fell 68% in the same timeframe. According to Solar Energy Industries Association, solar has had an average annual growth rate of 50 percent in the last 10 years in the United States, largely due to the Solar Investment Tax Credit enacted in 2006. Installing solar is also more affordable now due to installation costs dropping over 70 percent in the last decade.
_
2020s
Despite the rising cost of materials, such as polysilicon, during the 2021–2022 global energy crisis, utility scale solar was still the least expensive energy source in many countries due to the rising costs of other energy sources, such as natural gas. In 2022, global solar generation capacity exceeded 1 TW for the first time. However, fossil-fuel subsidies have slowed the growth of solar generation capacity. When the photovoltaics industry was smaller, the solar-cell manufacturers got their silicon from chipmakers, which rejected wafers that did not meet the computer industry’s purity requirements. But the boom in photovoltaics demanded more than semiconductor-industry leftovers, and many new polysilicon refineries were built in China.
______
Current status:
Figure below shows share of electricity production from solar in 2022.
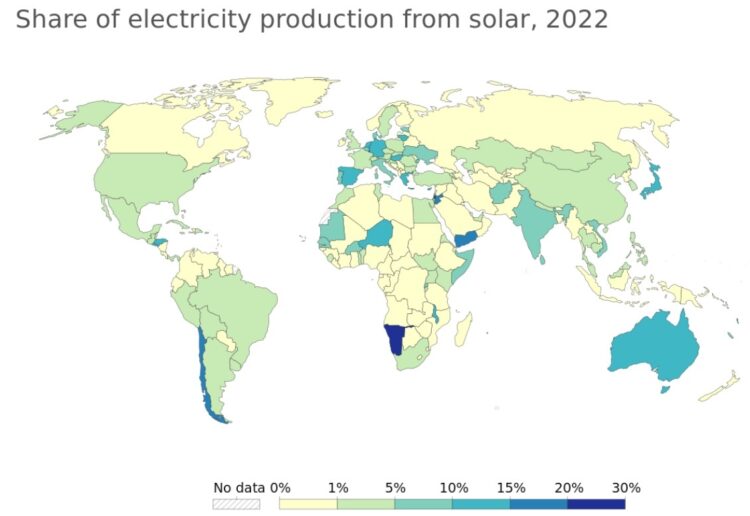
About half of installed capacity is utility scale. Utility scale is forecast to become the largest source of electricity in all regions except sub-Saharan Africa by 2050.
_
Benefitting from favorable policies and declining costs of modules, photovoltaic solar installation has grown consistently, with China expected to account for 50% of new global solar photovoltaic projects by 2024.
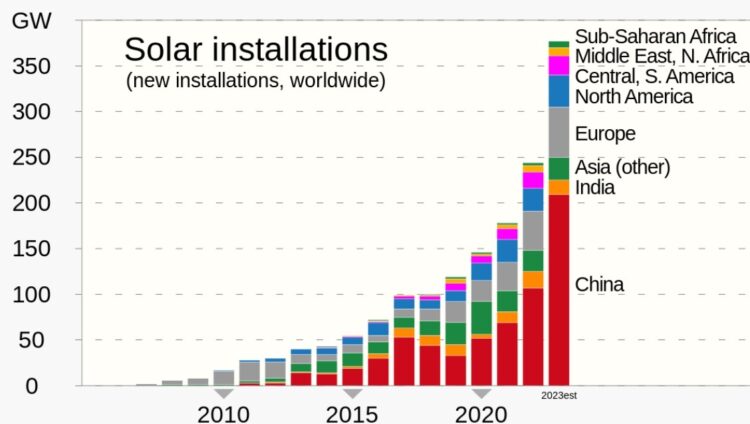
Figure above shows new solar installations.
According to a 2021 study, global electricity generation potential of rooftop solar panels is estimated at 27 PWh per year at costs ranging from $40 (Asia) to $240 per MWh (US, Europe). Its practical realization will however depend on the availability and cost of scalable electricity storage solutions.
_____
_____
Section-6
Introduction to solar technologies:
In recent times, the world has become acutely aware of the pressing need to transition away from conventional energy sources like fossil fuels due to their harmful environmental consequences. The ongoing changes in climate patterns, rising global temperatures, and the depletion of finite fossil fuel reserves have necessitated a shift towards more sustainable alternatives. Among these alternatives, solar energy stands out as a beacon of hope. Solar energy is harnessed through the capture and utilization of the sun’s radiant light and heat. This form of energy is not only abundant, as the sun radiates an immense amount of energy every day, but is also renewable, meaning it can be continuously replenished. Unlike fossil fuels, which take millions of years to form and are finite in supply, solar energy is essentially limitless and can be harnessed as long as the sun continues to shine.
_
One of the most compelling advantages of solar energy lies in its potential to significantly reduce greenhouse gas emissions. Traditional methods of energy production, such as burning coal, oil, and natural gas, release vast amounts of carbon dioxide and other pollutants into the atmosphere. These emissions are a major contributor to global warming and the detrimental effects associated with it. Solar energy, on the other hand, generates electricity without emitting greenhouse gases during its operation. As governments, industries, and individuals around the world recognize the urgent need for sustainable energy solutions, solar power has emerged as a promising answer. Its potential to address the challenges of climate change, reduce reliance on finite fossil fuels, and create a cleaner, more resilient energy infrastructure positions solar energy as a pivotal player in shaping a more sustainable and prosperous future for the planet.
_
A comprehensive solar energy system draws upon the synergy of three key components: photovoltaic (PV) technologies, solar thermal systems, and energy storage solutions. In recent years, significant advancements have been made in these three components, revolutionizing the efficiency, scalability, and reliability of solar energy systems. These breakthroughs have propelled solar energy to the forefront of the global energy landscape, with the potential to reshape how we generate, store, and utilize power. The importance of these innovations cannot be overstated. PV technologies have undergone rapid advancements, enhancing solar cell efficiency, reducing manufacturing costs, and increasing their applicability in various environments. These developments have opened up new avenues for large-scale solar power generation and enabled the integration of solar energy into our everyday lives. Similarly, advancements in solar thermal systems have expanded their capacity to capture and convert solar heat into usable energy. These systems have demonstrated remarkable efficiency gains, making them increasingly viable for industrial processes, space heating, and electricity generation. The integration of solar thermal systems with existing infrastructure holds the potential to transform industries and reduce reliance on conventional energy sources. Furthermore, the emergence of efficient energy storage solutions has addressed one of the biggest challenges associated with solar energy utilization—its intermittent nature. The development of cost-effective and scalable energy storage technologies has revolutionized the solar energy landscape, enabling the deployment of reliable and dispatchable power systems. Energy storage solutions not only facilitate the integration of solar energy into existing grids but also promote grid resilience and demand management and enable off-grid applications.
_
A rapid transformation of the energy system is necessary to keep warming well below 2 °C, as set out in the Paris Agreement and reinforced in the Glasgow Pact. Many countries have committed to achieving net-zero targets by 2050 (incl. EU, UK, Japan, Korea), 2060 (China) or 2070 (India). Net-zero targets imply mass-scale deployment of zero-carbon energy technologies such as solar and wind power, likely in combination with negative emission technologies. Renewables have historically been considered expensive, their deployment requiring high subsidies or carbon taxes. However, following a fruitful history of innovation and past climate policy, renewables now increasingly compete with fossil fuels. Between 2010 and 2020, the cost of solar PV fell by 15% each year, representing a technological learning rate of around 20% per doubling of installed capacity. At the same time, the installed capacity has risen by 25% per year, causing and partly caused by these cost reductions. Meanwhile, onshore wind capacity grew by 12% a year, with a learning rate of 10% per doubling of capacity. If these rates of rapid co-evolution are maintained, solar PV and wind power appear to irreversibly become the dominant electricity technologies in decades, as their costs far undercut the alternatives. Were that to be the case, a renewables tipping point could be imminent or even already have been passed. Despite the evidence suggesting the onset of a renewables revolution, the energy modelling community has not yet identified this possibility with any degree of consensus.
_
The problem of high cost for renewables has over time become replaced with a problem of balancing electricity grids, in which large amounts of variable wind and solar generation pose challenges. Energy storage play an important role in mitigating that issue and batteries show a similarly high learning rate. This implies that electricity storage costs and diffusion could follow a comparable and coupled trajectory to PV in the 2020s. Whether solar and wind can dominate electricity grids depends on the ability of the technology to overcome a series of barriers. This includes how to deal with the seasonal variation for which batteries are ill-suited. The cost of managing large amounts of intermittency could offset further cost reductions in solar panels and wind turbines, impeding their rapid diffusion. The unequal availability of finance to support solar and wind investments globally may be an issue too. Supply chains may be poorly prepared for such a rapid technological roll out. Finally, political resistance in areas of declining fossil fuel use or trade could curb the willingness of governments to embrace a solar revolution.
_____
_____
The below chart illustrates a fourfold rise in global energy usage from 1965 to 2022, highlighting the increasing worldwide energy consumption.
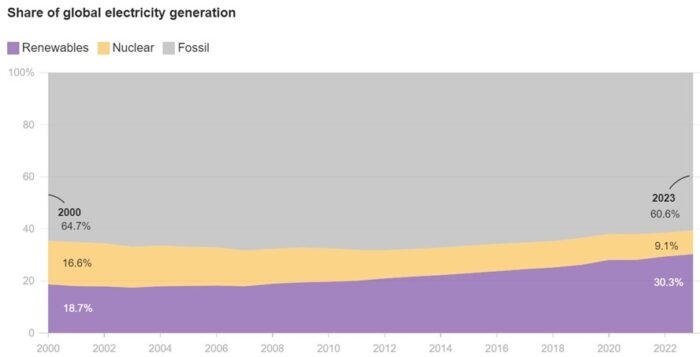
Currently, renewables contribute only 11.4% of the total global energy. Despite the continuous expansion in renewable energy source proportions; fossil fuels, including oil, coal, and gas, still dominate at an overwhelming majority. They account for 84.3% of all energy consumption.
_
The world’s energy supply today is neither safe nor sustainable:
Today fossil fuels – coal, oil, and gas – account for >80% of the world’s energy production and as the chart below shows they have very large negative side effects. The bars to the left show the number of deaths and the bars on the right compare the greenhouse gas emissions.
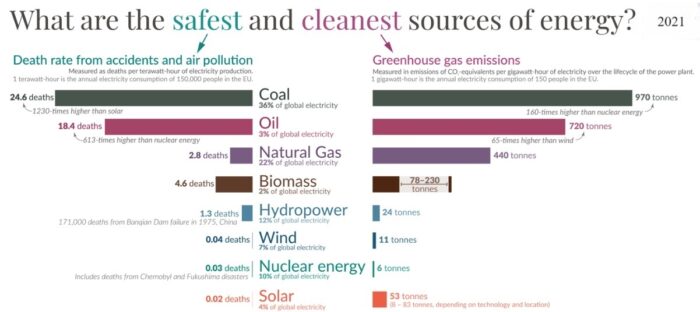
This makes two things very clear. As the burning of fossil fuels accounts for 87% of the world’s CO2 emissions, a world run on fossil fuels is not sustainable, they endanger the lives and livelihoods of future generations and the biosphere around us. And the very same energy sources lead to the deaths of many people right now – the air pollution from burning fossil fuels kills 3.6 million people in countries around the world every year; this is 6-times the annual death toll of all murders, war deaths, and terrorist attacks combined. It is important to keep in mind that electric energy is only one of several forms of energy that humanity relies on; the transition to low-carbon energy is therefore a bigger task than the transition to low-carbon electricity. What the above chart makes clear is that the alternatives to fossil fuels – renewable energy sources and nuclear power – are orders of magnitude safer and cleaner than fossil fuels.
Why then is the world relying on fossil fuels?
Fossil fuels dominate the world’s energy supply because in the past they were cheaper than all other sources of energy. If we want the world to be powered by safer and cleaner alternatives, we have to make sure that those alternatives are cheaper than fossil fuels.
_____
_____
The Carbon Tracker Initiative is a team of financial specialists making climate risk real in today’s capital markets. Their research to date on unburnable carbon and stranded assets has started a new debate on how to align the financial system in the transition to a low carbon economy.
Key findings of 2021 report:
With current technology and in a subset of available locations we can capture at least 6,700 PWh p.a. from solar and wind, which is more than 100 times global energy demand.
The collapse in renewable costs in the last three years means that half of this solar and wind technical potential now has economic potential, and by the end of the decade it will be over 90% of it.
Land is no constraint. The land required for solar panels alone to provide all global energy is 450,000 km2, 0.3% of the global land area of 149 million km2. That is less than the land required for fossil fuels today, which in the US alone is 126,000 km2, 1.3% of the country.
The fossil fuel era is over. The fossil fuel industry cannot compete with the technology learning curves of renewables, so demand will inevitably fall as solar and wind continue to grow. At the current 15-20% growth rates of solar and wind, fossil fuels will be pushed out of the electricity sector by the mid 2030s and out of total energy supply by 2050.
Poor countries are the greatest beneficiaries. They have the largest ratio of solar and wind potential to energy demand, and stand to unlock huge domestic benefits. The continent of Africa for example is a renewables superpower, with 39% of global potential.
______
______
Solar systems, including solar thermoelectric and photovoltaics (PV), offer environmental advantages over electricity generation using conventional energy sources. The benefits arising from the installation and operation of solar energy systems are environmental and socioeconomical.
From an environmental point of view, the use of solar energy technologies has several positive implications which include:
- Reduction of the emission of the greenhouse gasses (mainly CO2, NOx) and of toxic gas emissions (SO2, particulates)
- Reclamation of degraded land
- Reduced requirement for transmission lines within the electricity grid
- Improvement of the water resources quality.
The socioeconomic benefits of solar technologies include:
- Increased regional/national energy independence
- Creation of employment opportunities
- Restructuring of energy markets due to penetration of a new technology and the growth of new production activities
- Diversification, security, and stability of energy supply
- Acceleration of electrification of rural communities in isolated areas
- Saving foreign currency.
It is worth noting that no energy project can completely avoid some impact to the environment. The negative environmental aspects of solar energy systems include:
- Pollution stemming from production, installation, maintenance, and demolition of the systems
- Noise during construction
- Land displacement
- Visual intrusion.
These adverse impacts present difficult but solvable technical challenges.
_____
_____
The second Friday in March is Solar Appreciation Day! Solar Appreciation Day is an annual event that raises awareness about the importance and benefits of solar energy. It’s celebrated worldwide on the second Friday of March. Solar Appreciation Day recognizes the role of solar energy in meeting our energy needs, reducing dependence on fossil fuels, and combating climate change. Here are major benefits of sun power:
-1. The source of solar energy—the sun—is nearly limitless and can be accessed anywhere on earth at one time or another. It would take around 10 million acres of land—or only 0.4% of the area of the United States—to allow enough space for solar photovoltaics (PV) to supply all of America’s electricity.
-2. Solar panel installation costs are way down. The cost of solar panel installation is less than $3 a watt; a whopping 65% decrease from $8.50 per watt 10 years ago.
-3. New solar technologies are capturing more and more of the sun’s rays. The National Renewable Energy Laboratory has created six-junction solar cells that convert 47% of the captured sunlight into electricity under 143 suns concentration—by comparison, most commercially available modules convert less than 20%.
-4. Silicon solar cells can withstand the test of time. In 1954, Bell Laboratories built the first silicon solar cell—the template for nearly all of the solar PV technologies in use today.
-5. Solar can help restart the grid if it goes down. Typically, a signal from a spinning turbine—like that from a coal or natural gas plant—is required to “set the beat” of the grid. Now, DOE research is supporting advanced solar system that can take the lead, restarting the grid if no spinning turbine is available.
-6. Solar has been one of the top three new sources of generation added to the grid in the last seven years. In fact, solar provides 30% of the new electricity produced in the United States in 2019, up from just 4% in 2010.
-7. Solar is an economic engine—about 250,000 people work in the U.S. solar industry these days and there are more than 10,000 solar businesses around the country.
-8. Solar costs have fallen dramatically. The cost of an average-size residential solar energy system decreased 55% between 2010 and 2018, from $40,000 to $18,000—and that’s before factoring in incentives like the solar Investment Tax Credit. DOE is also focusing on reducing financing burdens and red tape for American families who choose to go solar.
-9. Solar panels are a manufactured product that take significantly less energy to fabricate than they produce over their lifetime.
_______
_______
Installed capacity of solar energy:
PV systems convert the Sun’s energy into electricity by utilizing solar panels. These PV devices have quickly become the cheapest option for new electricity generation in numerous world locations due to their ubiquitous deployment. For example, during the period from 2010 to 2018, the cost of generating electricity by solar PV plants decreased by 77%. However, solar PV installed capacity progress expanded 100-fold between 2005 and 2018. Consequently, solar PV has emerged as a key component in the low-carbon sustainable energy system required to provide access to affordable and dependable electricity, assisting in fulfilling the Paris climate agreement and in achieving the 2030 SDG targets.
The installed capacity of solar energy worldwide has been rapidly increased to meet energy demands. The installed capacity of PV technology from 2010 to 2020 increased from 40334 to 709674 MW, whereas the installed capacity of concentrated solar power (CSP) applications, which was 1266 MW in 2010, after 10 years had increased to 6479 MW. Therefore, solar PV technology has more deployed installations than CSP applications. So, the stand-alone solar PV and large-scale grid-connected PV plants are widely used worldwide and used in space applications.
Figure below represents the installation of solar energy worldwide.
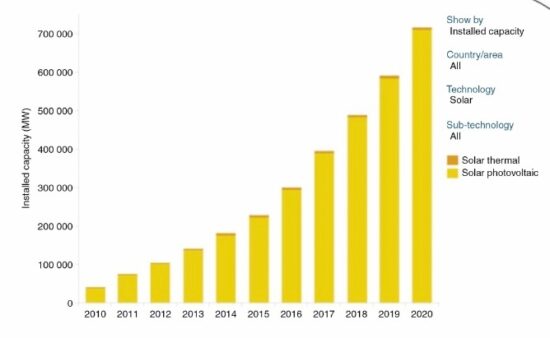
_____
_____
Electricity:
The changing lifestyle with rapid industrialization has made electricity an indispensable and essential commodity over the years. During the last few decades, increasing prices of electricity with increasing demand and decreasing fossil fuel reserves have raised many concerns for policymakers, investors, and customers. Moreover, existing supply chain also poses a challenge of carbon foot print due to its dependency on fossil fuels like coal and oil for electricity generation.
To alleviate the concern, policy makers across the world have been looking for some sustainable and feasible alternative input energy sources for electricity generation. They found many options like nuclear, wind, solar, hydro, biomass, tidal, geothermal, and so forth. However, literature supports solar energy as it is the most ready and green option available across the world.
The report published by Indian Meteorological Department (IMD), Ministry of Earth Sciences, Government of India (GoI) states that,
“The solar energy received by the earth is more than 15,000 times the world’s commercial energy consumption and over 100 times the world’s known coal, gas and oil reserves. And this energy is readily available during the day for anyone to tap and that too free and without any constraint.”
Initially used to supply electricity to satellites due to its high generation cost, solar technologies and its potential have improved enough to supply electricity not only to remote locations but also to supplement the national grid power at multi megawatt levels. In order to make the development of our civilization sustainable and cause less harm to our environment, people are looking for new source of substitute clean energy. Because of the increasing demands in clean energy, the solar energy industry is one of the fastest growing forces in the market.
_
Turning Solar Power into Electricity:
Visible sunlight is composed of particles called photons. These have energy, but zero rest mass. When the photons collide with other particles their energy is converted to other forms depending on the kind of atoms they strike. Most collisions create only heat. Of course, heat can be converted in to electricity. But electricity can also be produced when the photons make electrons in the atoms so agitated that they break away and move about freely. The n-type silicon electrons seek out the ones in p-type silicon to replace their missing electrons and the flow between the two types produced. The remarkable properties of semiconductors like silicon makes it possible to sustain the electrical imbalances. This means a steady supply of electricity as long as photons hit the solar panels. The current is collected by wires and carried throughout the system.
_
Electricity lies at the heart of most current modern and green technologies, and therefore its global demand has increased significantly over time, with expectations for it to increase even more substantially in the future. Electricity is the most versatile form of energy provision and has the most potential for decarbonization worldwide. Hence, effective methods of how to generate electricity consistently, cheaply, and sustainably are currently of great interest to researchers, governments, developers, and the public around the world. Despite the abundance of the solar resource in the world, the share of solar power in electricity production remains low at around 3% globally in 2019, primarily because of the very high installation costs. Nevertheless, this 3% share is the result of a rapid solar photovoltaic (PV) expansion over the last decade. This swift expansion is projected to continue into the future. However, the pace of change is not in line with the needs of reaching a net-zero world by 2050, and more needs to be done to show how the levelized cost of electricity (LCOE; the “discounted lifetime cost of building and operating a generation asset, expressed as a cost per unit of electricity generated;” it can be used to compare the costs of generating electricity from various power sources over time), even in countries within the northern hemisphere as far north as 55°, can have positive impacts with its adoption. The change in trajectory for countries close to the equator toward solar electricity has been rapid, with over 55% of new installations worldwide in large-scale programs adopting such a route. The reason for this growth and the positive predictions is primarily the cost decline of PV technology; since 2010, the cost of solar PV systems dropped by about 85%, and therefore, generating electricity from large-scale solar systems is now cheaper than coal or gas, even in the more northern countries.
_
Electricity production:
Solar power, also known as solar electricity, is the conversion of energy from sunlight into electricity, either directly using photovoltaics (PV) or indirectly using concentrated solar power. Solar panels use the photovoltaic effect to convert light into an electric current. Concentrated solar power systems use lenses or mirrors and solar tracking systems to focus a large area of sunlight to a hot spot, often to drive a steam turbine.
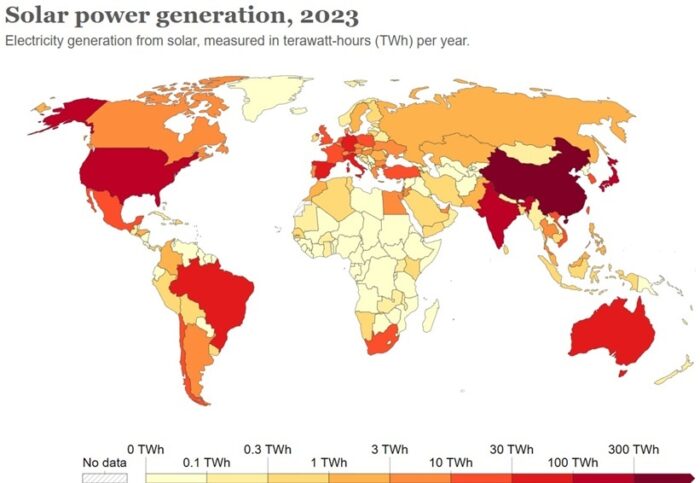
Photovoltaics (PV) were initially solely used as a source of electricity for small and medium-sized applications, from the calculator powered by a single solar cell to remote homes powered by an off-grid rooftop PV system. Commercial concentrated solar power plants were first developed in the 1980s. Since then, as the cost of solar panels has fallen, grid-connected solar PV systems’ capacity and production has doubled about every three years. Three-quarters of new generation capacity is solar, with both millions of rooftop installations and gigawatt-scale photovoltaic power stations continuing to be built.
In 2023, solar power systems generated 5% of the world’s electricity, compared to 1% in 2015, when the Paris Agreement to limit climate change was signed. Along with onshore wind, in most countries, the cheapest levelised cost of electricity for new installations is utility-scale solar.
Almost half the solar power installed in 2022 was rooftop. Much more low-carbon power is needed for electrification and to limit climate change. The International Energy Agency said in 2022 that more effort was needed for grid integration and the mitigation of policy, regulation and financing challenges.
Most electric power generation systems do not store energy since doing so would be extremely expensive. The utilities must thus utilize more fossil fuel-burning facilities to ramp up or down as necessary to meet demand. However, this strategy is not ideal because these plants function more effectively at full power. To fulfill the demand for electricity effectively, it is advised that renewable energy systems integrated with different types of energy storage systems be implemented.
_
The U.S. has enough energy supply to handle normal peak demand, called “load” in the electric industry, largely because of 25 gigawatts of new solar power capacity — at full capacity that’s the rough equivalent maximum output of 25 large fossil or nuclear power plants. Solar will make up 10% of overall national electric generation capacity by 2024, with natural gas providing 42%, coal providing 14% and wind power at 13%. Battery storage is also growing rapidly, with more than 14 gigawatts expected to be added this year, according to the EIA. Batteries complement solar generation well, since solar’s peak production doesn’t generally line up with peak demand on the grid, which happens later in the day. Batteries allow excess solar power to be banked for when it’s needed.
_
Figure below shows worldwide share in electricity production of various technologies.
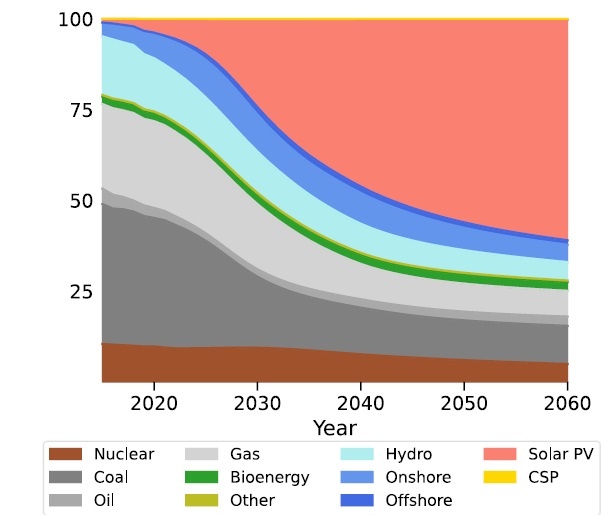
In 2020, fossil fuels produce 62% of electricity. This percentage reduces to 21% in 2050, with solar responsible for 56% of production. The current mix is highly varied. By mid-century, according to E3ME-FTT, solar PV will have come to dominate the mix, even without any additional policies supporting renewables. This is due to solar costs declining far below the costs of all alternatives. Its scale expands, because of its current rapid and exponential diffusion trajectory and comparatively high learning rate. Even the market shares of onshore and offshore wind power in the global energy mix start declining around 2030, outpaced by solar. This is due to a lower learning rate of wind compared to solar and a growing cost gap in the model. However, onshore continues growing in absolute terms until 2040, and offshore to the end of the simulation depicted in figure above.
_
The Solar Futures Study 2021 explores pathways for solar energy to drive deep decarbonization of the U.S. electric grid and considers how further electrification could decarbonize the broader energy system. The scenario that results in the greatest reduction in carbon emissions assumes that an additional 30% of building energy loads, 14% of transportation energy loads, and 8% of industrial energy loads by 2050 will be electrified and added to the electric grid. Under this scenario, solar will grow from 3% of the U.S. electricity supply in 2020 to 40% by 2035 and 45% by 2050. To achieve 95% grid decarbonization by 2035, the United States must install 30 gigawatts AC (GWAC) of solar photovoltaics (PV) each year between 2021 and 2025 and ramp up to 60 GWAC per year from 2025–2030. The United States installed about 15 GWAC of PV capacity in 2020.
_____
_____
Employment from renewable energy:
The employment market has also boomed with the deployment of renewable-energy technology. Renewable-energy technology applications have created >12 million jobs worldwide in 2021. Solar energy was found to be the fastest-growing sector. In 2021 it provided 4.3 million jobs, more than a third of the current global workforce in renewable energy. The solar PV application came as the pioneer, which created >3 million jobs. At the same time, while the solar thermal applications (solar heating and cooling) created >819 000 jobs, the CSP attained >31 000 jobs.
According to the reports, although top markets such as the USA, the EU and China had the highest investment in renewables jobs, other Asian countries have emerged as players in the solar PV panel manufacturers’ industry.
Solar energy employment has offered more employment than other renewable sources. For example, in the developing countries, there was a growth in employment chances in solar applications that powered ‘micro-enterprises’. Hence, it has been significant in eliminating poverty, which is considered the key goal of sustainable energy development. Therefore, solar energy plays a critical part in fulfilling the sustainability targets for a better plant and environment. Figure below illustrates distributions of world renewable-energy employment.
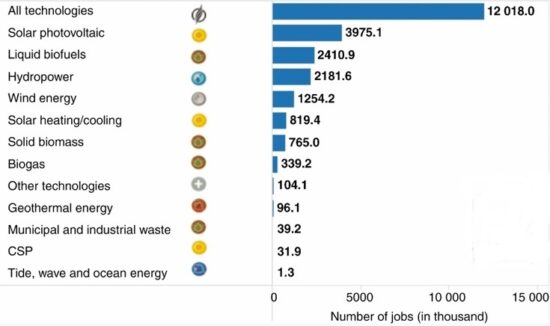
Figure above shows world renewable-energy employment.
______
______
SOLAR TECHNOLOGIES:
Solar energy refers to sources of energy that can be directly attributed to the light of the sun or the heat that sunlight generates. Solar energy technologies can be classified along the following continuum: (1) passive and active; (2) thermal and photovoltaic; and (3) concentrating and non-concentrating.
There are several kinds of solar techniques that are currently available. However, each of them is based on quite different concepts and science and each has its unique advantages. Analysis and comparison between different technologies will help us to adopt the most efficient and beneficial technology given a specific set of conditions.
There are three main ways to harness solar energy: photovoltaics, solar heating & cooling, and concentrating solar power. Photovoltaics generate electricity directly from sunlight via an electronic process and can be used to power anything from small electronics such as calculators and road signs up to homes and large commercial businesses. Solar heating & cooling (SHC) and concentrating solar power (CSP) applications both use the heat generated by the sun to provide space or water heating in the case of SHC systems, or to run traditional electricity-generating turbines in the case of CSP power plants.
_
Types of Solar Technologies:
Solar technologies are constantly evolving. Here are a few of the most popular ones in the market today:
-1. Solar Photovoltaic (PV) Cells
-2. Solar Thermal Collectors
-3. Solar Hot Water Systems
-4. Solar Cookers
-5. Solar Concentrators
-6. Solar Photovoltaic/Thermal Hybrid Systems
-7. Building-Integrated Photovoltaics (BIPV)
-8. Portable Solar Power Devices
_
Solar power is generated when energy from the sun (sunlight) is converted into electricity or used to heat air, water, or other fluids. There are two main types of solar energy technologies:
- Solar thermal is the conversion of solar radiation into thermal energy (heat). Thermal energy carried by air, water, or other fluid is commonly used directly, for space heating, or to generate electricity using steam and turbines. Solar thermal is commonly used for hot water systems. Solar thermal electricity, also known as concentrating solar power, is typically designed for large scale power generation.
- Solar photovoltaic (PV) converts sunlight directly into electricity using photovoltaic cells. PV systems can be installed on rooftops, integrated into building designs and vehicles, or scaled up to megawatt scale power plants. PV systems can also be used in conjunction with concentrating mirrors or lenses for large scale centralised power.
Solar thermal and PV technology can also be combined into a single system that generates both heat and electricity.
_
Generally speaking, non-concentrated photovoltaic solar panels (PV) and concentrated solar power (CSP) are the two most mature technologies. PV directly converts solar energy into electricity using a PV cell made of a semiconductor material, while CSP devices concentrate energy from the sun’s rays to heat a receiver to high temperatures. This heat is transformed first into mechanical energy (by turbines or other engines) and then into electricity – solar thermal electricity. These technologies have been commercialized and expected to experience rapid growth in the future.
In addition to electricity generation, solar power is employed to produce thermal energy (heating or cooling, either through passive or active means), to meet direct lighting needs and, potentially, to produce fuels that might be used for transport and other purposes. The maturity of solar technologies ranges from the research and development stage (e.g., fuels produced from solar energy), to relatively mature technologies (e.g., CSP), to mature (e.g., passive and active solar heating, and wafer-based silicon PV). Many but not all of the technologies are modular in nature, allowing their use in both centralized and decentralized energy systems. However, particularly CSP technologies achieve economic feasibility only at a power capacity of a few tens of megawatts. Solar energy is variable and, to some degree, unpredictable and solar irradiance varies significantly with geographic location. However, the temporal profile of solar energy output correlates relatively well with energy demands (Edenhofer et al. 2011; PricewaterhouseCoopers et al. 2010).
Solar thermoelectricity systems (STA), dye sensitized solar cell (DSPV) and concentrated photovoltaic systems are emerging technologies and under intensive study. Eventually, they may claim a significant share of the solar energy market if they achieve the necessary technical breakthroughs to make them sufficiently competitive to be commercialized.
_____
_____
The two types of solar panels, PV and thermal:
There are two types of solar panels – solar PV and solar thermal. Both work on the principle of taking energy from the sun and using that to generate a form of power useful for people. While both are often rooftop panels, that’s where the similarities end.
How solar PV works:
Photovoltaic (PV) panels turn sunlight into electricity. They’re made from a semi-conducting material, like silicon, in two layers to produce an electric field. When sunlight strikes this field, it generates a small voltage. The panels send this direct current (DC) to an inverter, which turns it into alternating current (AC) – used by appliances in the home. Electricity flows from the fuse box into these appliances if required, or out into the grid if not.
How solar thermal works:
Solar thermal panels turn sunlight into heat. The panel is comprised of tubes filled with a liquid, often glycol with antifreeze. Sun heats the liquid, which is then sent to heat up a copper coil and warm your hot water tank. Other parts of the system include a pump (that may be powered by PV) to move the liquid around the cycle and a control system to stop freezing liquid cooling your tank on colder days.
_
Pros and cons of solar PV panel vs thermal panel:
Efficiency:
In terms of pure efficiency at harvesting energy from the sun, solar thermal is more efficient at around 70% while PV is around 15-20%. So in theory thermal panels will require less roof space than PV. But this is somewhat misleading. Thermal energy is classed as a ‘lower grade’ than electric; in this case it can only be used for one purpose, heating water. PV’s electric energy can be used for a multitude of applications in the home from lighting and heating to appliances and car charging.
On site usage:
Both types of system generate power when the sun is out. Thermal energy is in effect stored in the hot water tank, for as long as the tank retains heat. If too much hot water is being produced (for example in the height of summer), then it often has to be wasted by manually running the hot water out.
Electrical energy generated by PV has to be used at the moment it’s produced, though excess can be sent to the grid to be used by others. Alternatively, you can invest in home battery storage to soak up generated power for later use.
Cost:
In the early days, solar thermal was much cheaper than PV. Over the past decade, due to funding and innovations, the cost of PV has dropped by more than 50%. This means the cost differential per system is no longer much of a consideration.
Maintenance:
Solar PV requires very little maintenance. It is recommended to check and clean panel every couple of years to make sure they’re performing at their optimum. But because of all the moving parts and glycol liquid in the panels, thermal systems can cost upwards of £200 a year in maintenance.
Lifespan:
Those moving parts in thermal panels compared to PV also mean it has a shorter lifespan of up to 20 years. PV on the other hand can keep going for over 40 years, with little degradation in performance.
Using PV for water heating:
While so far you may be thinking it’s worth sharing your roof space between thermal and PV panels, note that PV can also be used for water heating. There are devices called solar PV or immersion optimisers, which detect when excess solar generation is being sent to the grid and instead divert this into heating your water tank. These are great because they maximise the amount of electricity being used on site and heat up your water during the day for when you need it later on.
In a nutshell
After weighing up both systems, solar PV is much more worthwhile in terms of flexibility and cost-efficiency. Generating electricity for your home is always going to be more valuable than just hot water.
_
PVT collector:
A PV–thermal (PVT) collector is a module in which the PV is not only producing electricity but also serves as a thermal absorber. In this way both heat and power are produced simultaneously. Since the demand for solar heat and solar electricity are often supplementary, it seems to be a logical idea to develop a device that can comply with both demands. Photovoltaic (PV) cells utilize a fraction of the incident solar radiation to produce electricity and the reminder is turned mainly into waste heat in the cells and substrate raising the temperature of PV as a result, the efficiency of the module decreased. The photovoltaic/thermal (PV/T) technology recovers part of this heat and uses it for practical applications. The simultaneous cooling of the PV module maintains electrical efficiency at satisfactory level and thus the PV/T collector offers a better way of utilizing solar energy with higher overall efficiency. By combining electricity and heat generation within the same component, these technologies can reach a higher overall efficiency than solar photovoltaic (PV) or solar thermal (T) alone.
______
______
Solar PV Technologies:
Photovoltaics (PV) comprise the technology to convert sunlight directly into electricity. The term Photo means light and Voltaic means electricity. A photovoltaic (PV) cell, also known as Solar Cell, is a semiconductor device that generates electricity when light falls on it. When sunlight strikes a PV cell, the photons of the absorbed sunlight dislodge the electrons from the atoms of the cell. The free electrons then move through the cell, creating and filling the holes in the cell. It is this movement of electrons and holes that generates electric current. The physical process in which a PV cell or Solar cell converts sunlight into electricity is known as the Photovoltaic Effect. Materials presently used for photovoltaics include monocrystalline silicon, polycrystalline silicon, amorphous silicon, cadmium telluride, and copper indium gallium selenide/sulphide. Photovoltaic solar panel is the most commonly used solar technology to generate electricity energy. PV technology is suited to a broad range of applications due to its modular nature and emission-free, silent operation, and can contribute substantially to our future electrical energy needs.
_
A typical silicon PV cell is composed of a thin wafer consisting of an ultra-thin layer of phosphorus-doped (N-type) silicon on top of a thicker layer of boron-doped (P-type) silicon. An electrical field is created near the top surface of the cell where these two materials are in contact, called the P-N junction. When sunlight strikes the surface of a PV cell, this electrical field provides momentum and direction to light stimulated electrons, resulting in a flow of current when the solar cell is connected to an electrical load as shown in Figure below.
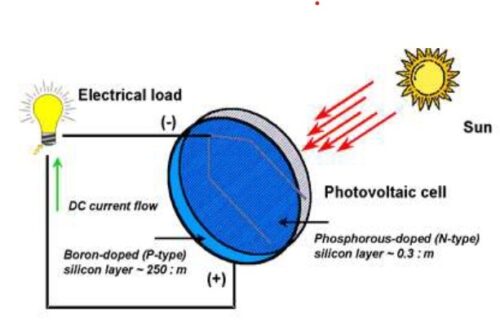
Figure above shows working principle of PV cells.
PV technology is a cornerstone of solar energy conversion, enabling the direct conversion of sunlight into electrical energy. PV systems consist of solar panels composed of interconnected solar cells, which are the fundamental building blocks responsible for converting light energy into electricity. The operation of PV cells relies on the PV effect, a phenomenon discovered in the 19th century. When photons from sunlight strike the surface of a PV cell, they transfer their energy to the atoms within the cell’s semiconductor material, causing the release of electrons. These free electrons generate an electric current as they flow through the cell, creating usable electrical energy. Figure above shows how a typical PV cell works and generates electricity.
_
As of now, silicon is the most common material used to make solar cells. It is because of its various advantages over other material. Silicon is the second most abundant element found in the earth’s crust. The only problem is that silicon does not absorb sunlight as efficiently as other materials, so silicon solar cells need to be 10-100(s) of times thicker than thin film solar cells. Microelectronics grade silicon is too expensive for economical large area coverage, but totally unrefined silicon solar cells don’t work. But nowadays other materials have replaced silicon to some extent.
Solar PV cells have two distinct types which are described here.
-1) Crystalline silicon based technologies:
Crystalline silicon (c-Si) solar cells basically have a large surface area, are of a high quality and are single junction devices. However, c-Si technologies require high inputs during manufacturing (i.e. energy and labour) which have over the years limited their potential for significant cost reduction. The main advantages of c-Si lies in their being tried and tested, having current industry leadership and thus wide scale familiarity in the user groups as well as among producers. At the same time, most applications which have been designed for solar PV use have been designed on the basis of silicon based PV characteristics. The major disadvantage of c-Si solar PV technology lies in its heavy reliability on pure solar grade silicon, which has had a limited supply base.
-2) Thin film based technologies:
Thin film technologies have tried to address two crucial shortcomings of the c-Si based solar PV technologies, i.e. a reduction in the cost of production through lower material usage and energy requirements. Thin films use manufacturing techniques, such as vapour deposition and electroplating, which reduce high temperature processing and thus have lower energy requirements for manufacturing. At the same time, since only a thin film of the semiconductor material is applied on a substrate, the cost of materials (per watt peak) in thin films is almost half of that in c-Si. Thin films as a technology has a number of advantages over the c-Si technologies, like flexibility and light weight, variety of processing methods, high theoretical efficiencies, light weight modules, lower production costs and the ability to produce electricity under low/diffused light conditions. Their main constraints are lower achieved efficiencies and evolving production practices.
Mono- and polycrystalline wafer Si solar cells remain the predominant PV technology with module production cost around $1.50 per peak watt. Thin-film PV was developed as a means of substantially reducing the cost of solar cells. Remarkable progress has been achieved in this field in recent years.
_
New and Emerging Technology:
New and emerging technologies are being designed to overcome shortcomings, such as poor electrical performance of thin films, while maintaining low production costs. Researchers are now targeting conversion efficiencies between 30% and 60%, while retaining similar low cost materials and manufacturing techniques. Some of the measures that are being adopted for achieving these high efficiencies are: a) multijunction photovoltaic cells; b) modification of incident spectrum (concentration) and c) use of excess thermal generation to enhance voltages or carrier collection.
A new class of ceramic materials (Perovskite) that has three main benefits. First, it can produce a solar panel that is thinner than today’s silicon-based market leaders by using one material to do the work of two. Second, it uses cheaper materials than those used in today’s high-end thin-film solar panels. Third, the material is ferroelectric, which means it can switch polarity, a key trait for exceeding the theorized energy-efficiency limits of today’s solar cell material.
____
____
Solar thermal technologies:
Solar thermal technology is harnessing solar energy to generate thermal energy (heat). Thermal energy has a variety of applications including heating water, cooling or warming buildings, generating process heat, cooking, water treatment and molten salt technologies. Solar thermal collectors are defined by the US Energy Information Administration as low-, medium-, or high-temperature collectors. Low temperature collectors are flat plates generally used to heat swimming pools. Medium-temperature collectors are also usually flat plates but are used for creating hot water for residential and commercial use. High temperature collectors concentrate sunlight using mirrors or lenses and are generally used for electric power production. Solar thermal is different from photovoltaics, which convert solar energy directly into electricity.
The most common usage of solar thermal energy is for on site water and space heating. However, with high temperature collectors, electrical energy has been reliably produced by concentrated solar power arrays: mirrors focusing light onto pipes of water or other heat transfer fluid. The hot water is heated to the boiling point and powers a steam turbine to generate electricity, or is preheated for use in fossil fuel based generation.
Solar water heating, solar house heating, solar distillation, solar drying of agricultural and animal goods, solar cooking, solar furnaces and CSP are few examples of solar thermal technologies.
(a) Solar Water Heating
Sunlight can be used to heat water using evacuated tube collectors, glazed flat plate collectors and unglazed plastic collectors. A flat metal plate collector with an attached metal tube towards the sun’s general direction makes up a solar water heating unit. A transparent glass cover covers the plate collector under the thermal insulation. The insulated tank that stores hot water on cloudy days is connected to the metal tubing of the collector via a pipe. By absorbing sun rays, the collector uses gravity or a pump to transmit the heat to the circulated water via the tube. The related metal tubing is used to deliver this hot water to the storage tank. In addition to domestic and commercial buildings, this water heating method is frequently employed in hotels, guest homes, tourist bungalows, hospitals, and canteens. Solar hot water systems are widely deployed in China and nations such as Israel and Cyprus lead the world in per capita use, while Australia, Canada and the United States mainly use solar water heating to heat swimming pools.
(b) Solar Heating of Buildings
There are several techniques to utilize solar energy for space heating in buildings, including:
(1) collecting solar radiation using a building component, where solar energy is admitted directly into the building through sizable South-facing windows in northern hemisphere.
(2) Making use of separate solar collectors that can heat water or air or storage systems that can store the solar energy for use at night and on cloudy days.
The heat is distributed via traditional equipment like fans, ducts, air outlets, radiators, hot air registers, etc., to warm up the living sections of a building when it needs heat from these collectors or storage devices.
The heated air or water from the collector can be transferred to a heat storage device, such as a well-insulated water tank or other heat-holding material, when the building doesn’t need to be heated. An additional heating system employing gas, oil, or electricity is needed as a backup.
Solar heating is divided into active and passive solar concepts according to whether active elements like solar concentrating optics or sun tracking are used. Thermal mass, which is any material that can be used to store heat, is also used in arid or warm temperate climates to keep buildings cool. These materials include stone, cement or water, which absorbs solar energy during the day and then radiates the warmth during the cooler night-time hours. The size and location of thermal mass depends on factors like climate, daylight hours and shade but can reduce the need for auxiliary cooling or heating equipment. Solar or thermal chimneys can also be used for ventilation, allowing air to heat up inside to create an updraft that pulls air through a building, creating ventilation. Another passive form of solar heating control involves the planting of deciduous trees. When planted on the southern side of a building in the northern hemisphere or the northern side in the southern hemisphere, the leaves provide shade in the summer and the bare tree limbs allow light to pass through to the building in the winter.
(c) Solar water treatment
Potable water is scarce in arid semiarid, and or coastal locations. Solar distillation is a technique that can be used to turn salt water into potable distilled water in these places due to the ample sunlight. This technique lets sunlight into a shallow, darkened basin filled with salt water through an airtight, transparent glass cover. Solar radiation that enters through the coverings and is absorbed and converted into heat in the surface that has been blackened is what causes the water to evaporate from the brine (impure salt water). The vapors generated are condensed into clean water in the cool roof interior. Condensed water from the roof slopes down and collects in troughs at the bottom, where it is then transferred to a water storage tank to provide potable distilled water in areas where it is scarce, such as colleges, school science labs, defense labs, gas stations, hospitals, and the pharmaceutical industry. Compared to other electrical energy-based procedures, this system’s method of obtaining distilled water costs less per liter. Solar energy has been used for distillation since at least the 16th Century to make brackish or saline water potable. Along with desalination, sunlight is used for disinfecting water. Solar water disinfection (SODIS) is used by over two million people in developing countries each day to make drinking water. The process involves exposing polyethylene terephthalate (PET) bottles of water to sunlight for several hours. Using sunlight to evaporate water from shallow ponds is also a traditional method of obtaining salt from seawater and can be used to concentrate brine solutions or removing dissolved solids from waste streams.
(d) Solar Drying of Agricultural and Animal Products
This is a tried-and-true method for harnessing solar energy to dry agricultural and animal products. Agricultural items are dried using a simple cabinet dryer, consisting of a black box on the inside and covered with an inclined transparent sheet of glass.
To help the airflow over the drying material, put on perforated trays inside the cabinet, and ventilation holes are supplied at the bottom and top of the sidewalls. These perforated trays or racks have been carefully developed for controlled exposure to sun radiation.
Fruit quality is enhanced by solar drying, particularly because the concentration of sugar increases during drying. Soft fruits are typically more sensitive to insect attack as the sugar content rises during drying. However, a fruit dryer saves significant time by drying fruit faster, reducing the likelihood of insect attack.
Other agricultural items regularly dried using solar energy include potato chips, berseem, grains of rice and maize, ginger, peas, pepper, cashew nuts, lumber and veneer drying, and tobacco curing. Milk and fish that have been dried using sun energy are two examples of animal products.
(e) Solar Furnaces:
Technology to concentrate sunlight, such as parabolic dishes, troughs and reflectors, are used to provide process heat for a range of industrial and commercial applications. In a solar furnace, high temperatures are produced by concentrating solar energy onto a specimen using several heliostats (turnable mirrors) arranged on a sloping surface. The properties of ceramics are studied in the solar furnace at temperatures far higher than those that can be measured in labs using flames and electric currents. By shifting the position of the material in focus, heating can be done without contamination, and temperature can be readily controlled. This is especially helpful for chemical and metallurgical processes. On an open specimen, many property measurements are available. Future uses of solar furnaces include the creation of fertilizers and nitric acid from the air.
(f) Solar Cooking:
Solar cooking is becoming more essential as the energy market continues to be vulnerable to supply-side threats. Coal, kerosene, and cooking gas are, unfortunately, fairly scarce. Solar cookers have been used for applications such as cooking, drying and pasteurisation for centuries. The first box cooker, which is an insulated container with a transparent lid that can reach temperatures of 90-150°C, was built by Horace de Saussure in 1767. Panel cookers also use an insulated container but include a reflective panel to direct the sunlight and can reach similar temperatures to box cookers. Reflector cookers use concentrating geometries such as dishes, troughs or Fresnel mirrors to focus the sunlight and can reach temperatures of 315°C, but require direct light to work correctly and must be repositioned to track the movement of the Sun. Solar cooking has the advantage of low maintenance expenses, but it cannot be used to cook food in erratic weather or at night.
(g) Concentrated solar power:
In CSP or solar thermal technologies, the solar radiations are concentrated to produce steam or hot air. This steam or hot air is then used to generate electricity using a conventional power cycle. The four types of CSP technologies used currently are as follows:
- Parabolic troughs,
- Power towers,
- Dish/engine systems, and
- Linear Fresnel reflectors.
_
Parabolic trough solar thermal systems belong to CSP system is commonly available. This system has parabolic, trough shaped mirrors to focus sunlight on tubes which are thermally efficient and set to receive concentrated sunlight. These tubes contain a heat transfer fluid which it heated to 734°F and pumped through series of heat exchanges to generate super-heated steam to power turbine generators to produce electricity. In contrast to concentrating technology, solar collectors, like flat plate and evacuated tube, have been developed for heating and cooling purposes in a non-concentrated manner. This technique has become popular within short time because of its efficiency and cost effectiveness. It can be used in areas where weather conditions are poor and solar intensity is low. This system has three mechanisms such as light absorption, transforming and storage. Copper tubes with insulation are used to absorb solar energy, where water or air is circulated and heated up before returning to storage system. An efficient modification of this system is evacuated tube collector where heat pipes are vacuum shield and 20–45% more efficient than flat plate collectors.
______
______
Concentrating solar power:
Concentrated solar power (CSP) systems use lenses or mirrors to focus a large area of sunlight onto a small area. Electrical power is produced when the concentrated light is directed onto photovoltaic surfaces or used to heat a transfer fluid for a conventional power plant.
Concentrated solar power systems are divided into:
- concentrated solar thermal (CST) = CSP unless specified otherwise
- concentrated photovoltaics (CPV)
- concentrating photovoltaics and thermal (CPVT)
_
Concentrated solar thermal:
Concentrated solar thermal (CST) is used to produce renewable heat or electricity (generally, in the latter case, through steam). CST systems use lenses or mirrors and tracking systems to focus a large area of sunlight onto a small area. The concentrated light is then used as heat or as a heat source for a conventional power plant (solar thermoelectricity). Unless specified otherwise, CST is CSP.
Some thermal solar power plants use a highly curved mirror called a parabolic trough to focus the sunlight on a pipe running down a central point above the curve of the mirror. The mirror focuses the sunlight to strike the pipe, and it gets so hot that it can boil water into steam. That steam can then be used to turn a turbine to make electricity. In California’s Mojave desert, there are huge rows of solar mirrors arranged in what’s called “solar thermal power plants,” which makes electricity for more than 350,000 homes. Some solar plants, are a “hybrid” technology: during the daytime they use the sun, and at night and on cloudy days they burn natural gas to boil the water so they can continue to make electricity.
Another form of solar power plants to make electricity is called a solar tower. Sunlight is reflected off mirrors circling a tall tower. The mirrors are called heliostats and move and turn to face the sun all day long. The light is reflected back to the top of the tower in the center of the circle where a fluid is turned very hot by the sun’s rays. That fluid can be used to boil water to make steam to turn a turbine and a generator.
Concentrated photovoltaic:
Concentrated photovoltaic (CPV) systems employ sunlight concentrated onto photovoltaic surfaces for the purpose of electrical power production. Solar concentrators of all varieties may be used, and these are often mounted on a solar tracker in order to keep the focal point upon the cell as the Sun moves across the sky.
Concentrating Photovoltaics and Thermal:
Concentrating Photovoltaics and Thermal (CPVT) technology produces both electricity and thermal heat in the same module. Thermal heat that can be employed for hot tap water, heating and heat-powered air conditioning (solar cooling), desalination or solar process heat.
_____
_____
Techniques for increasing the efficiency of PV panels:
No method of energy transformation is 100 per cent efficient. Plants convert sunlight into energy with an efficiency of around 5–6 per cent, and a fossil-fuel power plant is only around 30–50 per cent efficient—all the extra energy contained in the fuel it burns is emitted as heat, and effectively wasted.
There a few issues that mean solar cells are not totally efficient in converting sunlight into electrical energy. One is that the energy provided by the photons might be insufficient to allow the electrons to break free from their electron–hole pairs. At other times, the photons might provide more energy than required for the electron to break free, and the excess is wasted. Also, when the electrons break free from their pairs, they often simply recombine with another hole without moving over to the n-type layer.
The ultimate efficiency of a silicon photovoltaic cell in converting sunlight to electrical energy is around 20 per cent, and large areas of solar cells are needed to produce useful amounts of power. The search is therefore on for much cheaper cells without too much of a sacrifice in efficiency.
_
PV systems are sometimes inefficient to capture all available energy because of fluctuating solar flux. Solar tracking is the concept commonly used to increase the capture of available solar energy. Solar tracking can be implemented by using one axis and two axis sun tracking systems. Tracker is a device that keeps PV panels in an optimum position perpendicular to solar radiation during daylight hours; increases collected energy. Trackers need not point directly at sun to be effective. If aim is off by 10°, the output is still 98.5% of that at full tracking maximum. Abdullah et al. designed and constructed a two-axes, open loop PLC controlled sun tracking system. They concluded that the use of two-axes tracking surfaces results in an increase in total daily collection of about 41.34% as compared to that of a fixed one. Solar concentration is combined with solar trackers to grid PV panels according to the motion of sun to receive considerable sun’s energy than fixed PV panels. Hybrid power systems are sometimes used in areas where PV panels do struggle to generate consistent electricity for consumption. PV systems are combined with other forms of electricity generation, usually a diesel powered generator or even hydro turbine or wind turbine for the reduction of fossil fuel use and consistent electricity supply.
_
In 2014, a team from the University of New South Wales set a world record of 40 per cent efficiency using commercially available (traditional single-crystal silicon) solar cells. They developed a method of focusing the sunlight and used a special filter to capture sunlight that is usually wasted. Several other promising lines have also been pursued by the University of New South Wales. Instead of cutting slices from specially grown silicon single crystals, one possibility involves growing thin films of silicon on much cheaper polycrystalline silicon wafers, or onto glass plates. This process uses 99 per cent less silicon than conventional techniques and is now being utilised commercially in Europe. In addition, Swinburne University of Technology is developing thin film amorphous silicon, a type of silicon in which the atoms do not form a regular crystalline lattice. With amorphous silicon, thinner layers of silicon can be used, again making the process much cheaper, though less efficient.
_
A significant focus of activity is in new thin-film solar cell modules that are potentially lighter, more flexible and cheaper than traditional solar cells, which are made on glass. Cadmium telluride and CIGS (copper indium gallium (di)selenide) may well soon challenge traditional silicon modules in both cost and efficiency.
Newly emerging technologies include organic solar cells. The Victorian Organic Solar Cell Consortium (CSIRO, the University of Melbourne and Monash University) is printing solar cells on flexible polymers, rather like the approach to the Australian plastic banknote. Related work is under way at the universities of Newcastle and Queensland. Solar cells made from the organic–inorganic combination of methyl-ammonium lead trihalide, with the slightly more manageable name of perovskites, are another fast-growing solar cell technology. CSIRO has recently demonstrated the potential for roll-to-roll printing of perovskites, a method that allows speedy fabrication of the solar cells.
_
How to handle intermittency:
The intermittency of solar and wind resources is frequently raised as an issue which will hold back their deployment, but the problem is often overstated. There are many solutions to intermittency, ranging from wider grids and storage to demand side management, better forecasting, oversizing solar and wind, and system integration. However, few of these are able to address the issue of inter-seasonal supply fluctuations. The conservative solution in this analysis is simply to assume in your calculations the level of solar availability in the lowest month of insolation.
______
______
Solar energy statistics and growth:
The rapid depletion of fossil fuels, which accounts for nearly 80% of global energy consumption, demands an urgent need for research aimed at finding sustainable and renewable energy alternatives. Solar, hydropower, geothermal, biomass, and wind energy sources have been proposed and widely studied. These studies include, but are not limited to, assessing technical design viability, economic feasibility, optimization, and conducting social assessments using various models. Solar energy is a widely distributed, sustainable, and renewable energy source. As a renewable resource, solar energy has the capability to replace the widely used fossil fuel resource in the near future. While the contribution of solar energy to global electricity production remains generally low at 3.6%, it has firmly established itself among other renewable energy technologies, comprising nearly 31% of the total installed renewable energy capacity in 2022 (IRENA, 2023). With an installed capacity of 1053 GW in 2022, solar energy is the second most installed renewable energy technology, following hydropower technology with 1392 GW. (IRENA, 2023).
_
Solar energy status in the world:
The top 10 largest solar energy-producing countries are China, the United States, India, Japan , Germany, Brazil, Australia, Spain, Italy, South Korea. The global installed solar capacity over the past ten years is depicted in table below that shows a tremendous increase of approximately 22% in solar energy installed capacity between 2021 and 2022. While China, the US, and Japan are the top three installers, China’s relative contribution accounts for nearly 37% of the entire solar installation in 2022.
Global installed solar capacity from 2013 to 2022 depicted in table below:
|
Empty Cell |
Solar energy capacity (MW) |
Empty Cell |
Empty Cell |
|||||||
|
2013 |
2014 |
2015 |
2016 |
2017 |
2018 |
2019 |
2020 |
2021 |
2022 |
|
|
World |
140514 |
180712 |
228920 |
301082 |
395947 |
489306 |
592245 |
720429 |
861537 |
1053115 |
|
Africa |
716 |
1709 |
2242 |
3455 |
5200 |
8150 |
9493 |
10819 |
11628 |
12641 |
|
Asia |
36225 |
60691 |
90581 |
140489 |
211853 |
276406 |
332854 |
410326 |
485413 |
597573 |
|
Europe |
84189 |
91095 |
99604 |
106173 |
112299 |
121603 |
142272 |
162795 |
190143 |
227799 |
|
N. America |
13645 |
20129 |
27043 |
38731 |
47828 |
57664 |
69656 |
86493 |
107192 |
126443 |
|
S. America |
198 |
465 |
921 |
1589 |
3672 |
5512 |
8562 |
13164 |
20795 |
32773 |
|
Oceania |
4610 |
5358 |
6079 |
6860 |
7576 |
8881 |
13293 |
18357 |
23342 |
27400 |
_____
_____
Table below shows top fourteen solar energy installers in 2022:
|
N/s |
Country |
Installed capacity (GW) |
|
1 |
China |
393.0 |
|
2 |
USA |
113.1 |
|
3 |
Japan |
78.8 |
|
4 |
Germany |
66.5 |
|
5 |
India |
63.1 |
|
6 |
Australia |
26.8 |
|
7 |
Italy |
25.1 |
|
8 |
Brazil |
24.1 |
|
9 |
Netherlands |
22.6 |
|
10 |
Korea Rep |
20.9 |
|
11 |
Spain |
20.5 |
|
12 |
Viet Nam |
18.5 |
|
13 |
France |
17.4 |
|
14 |
UK |
14.4 |
_____
_____
Rise of solar in China:
China’s solar prowess is staggering. With a whopping 430 GW solar capacity (As of April 2023), the country is the largest producer of solar energy in the world. While solar deployments in the U.S., South America and the EU are growing fast, China continues to lead the way — it’s expected to account for 50 percent of new global solar PV projects by 2024 as seen in the figure below.
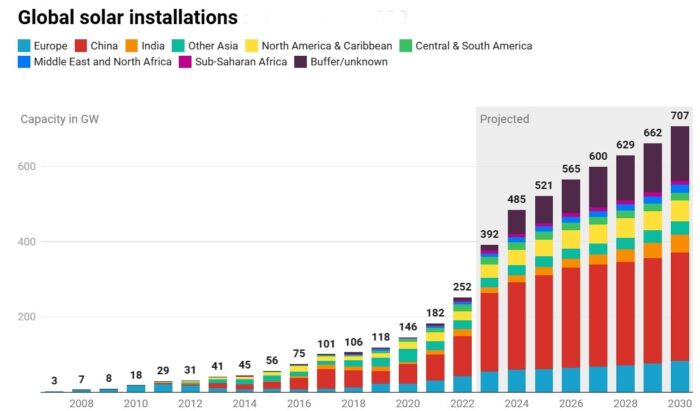
But China’s leadership extends beyond brand-new projects: Its installed capacity is expected to cross the 500-gigawatt mark by the end of 2023 and is expected to double to 1 terawatt by the end of 2026, according to recent data from Rystad. Meanwhile, total U.S. installed solar capacity is nearly 160 gigawatts today and will rise to about 209 gigawatts in 2026, or around 11 percent of the global total, according to Rystad. Much of that increase will stem from the Inflation Reduction Act’s generous incentives.
China is leading. In 2023 it installed 55% more solar capacity than the previous year, compared to 12% for the G7 and 5.9% for the rest of the world. For wind capacity, China’s additions rose by 21% in 2023, compared to 4.5% for the G7 and 5.3% for the rest of the world. China was responsible for 63% of the solar additions worldwide in 2023, and 65% of wind. This was a record high share and a significant increase from installing 43% of global solar additions in 2022 and 48% of wind. China has played a pivotal role in scaling up wind and solar deployment globally, while the cost of these technologies fell with growing adoption to make them the cheapest source of electricity. Over January-March 2024 alone, China added another 45.74 GW of new solar capacity (up from 12.08 GW the previous year) and 15.5 GW of wind, according to the National Energy Administration (NEA) of China. This brings more confidence that the renewable capacity surge in 2023 will continue. China has made a lot of solar panels, dramatically lowering prices and helping the country’s clean-energy transition. China made so many solar panels that even its own grid can’t support all the energy produced.
But it’s not only China: the number of gigawatt-scale solar markets grew to 28 countries in 2023, up from 21 in 2022. More than half are in Europe, as an early technology adopter, but several front-runner countries have emerged in Latin America and the Middle East since 2017. As solar panel prices have plummeted, more countries are taking advantage of this technology to kick off their renewables growth story and to bring cheaper power to their domestic markets.
_______
US solar:
In the last decade alone, solar has experienced an average annual growth rate of 22%. Thanks to strong federal policies like the solar Investment Tax Credit, rapidly declining costs, and increasing demand across the private and public sector for clean electricity, there are now more than 179 gigawatts (GW) of solar capacity installed nationwide, enough to power nearly 33 million homes. As of 2022, more than 263,000 Americans work in solar at more than 10,000 companies in every U.S. state. In 2023, the solar industry generated nearly $51 billion of private investment in the American economy.
_
The United States surpasses five million solar installations, a major milestone in its clean energy journey, achieved in just eight years since hitting one million in 2016. This follows 40 years from the first grid-connected solar installation in 1973. “Every sunny roof without solar panels is a missed opportunity,” said Johanna Neumann, Senior Director of the Campaign for 100% Renewable Energy at Environment America Research & Policy Center. Solar panels offer a holistic clean energy solution beyond powering homes, from reducing carbon footprints and fostering biodiversity to substantial savings on utility bills to potential profits through net metering.
_
No other energy source has seen more rapid growth in the United States over the past half a decade than solar power. Solar power has now grown to account for about 6% of total U.S. electric power generation after surging by 155% between 2018 and 2023. But while solar power has made the U.S. power-generating system greener, it has also made it more volatile, especially in the top solar market, California. There, peak solar power generation coincides with the lowest residential electricity demand during the midday. When power demand begins to surge after 6 p.m., solar output begins to fade. To cope with the natural and weather-dependent solar power, the grid needs much more battery storage than currently available to smooth out the difference in peak output and peak demand and the large power price variations. Power systems and grid operators need to cope with often negative prices when solar output is at its peak during the day. In California, for example, “on sunny spring days when there is not as much demand, electricity prices go negative and solar generation must be ‘curtailed’ or essentially, thrown away,” says the Institute for Energy Research (IER). The ‘wasted’ solar power output and insufficient battery storage are raising electricity prices in the state, according to the institute. California has nearly 47 gigawatts (GW) of solar power installed that could supply a quarter of the state’s electricity if it could operate 24/7 and on-demand as traditional sources, including coal, natural gas, and nuclear power do, says IER analysts.
_______
India solar:
India is endowed with vast solar energy potential. About 5,000 trillion kWh per year energy is incident over India’s land area with most parts receiving 4-7 kWh/m2 per day. Solar photovoltaic power can effectively be harnessed providing huge scalability in India. Solar also provides the ability to generate power on a distributed basis and enables rapid capacity addition with short lead times. Off-grid decentralized and low-temperature applications will be advantageous from a rural application perspective and meeting other energy needs for power, heating and cooling in both rural and urban areas. India’s solar power installed capacity was 81.813 GWAC as of 31 March 2024. India is the third largest producer of solar power globally. During 2010–19, the foreign capital invested in India on Solar power projects was nearly US$20.7 billion. In FY2023-24, India is planning to issue 40 GW tenders for solar and hybrid projects. India has established nearly 42 solar parks to make land available to the promoters of solar plants. Gujarat Hybrid Renewable Energy Park will generate 30 GWAC power from both solar panels and wind turbines. It will spread over an area of 72,600 hectares (726 km2) of waste land in Kutch district of Gujarat. India has also put forward the concept of “One Sun One World One Grid” and “World Solar Bank” to harness abundant solar power on a global scale.
_
Why rooftop remains the most untapped solar source in India:
Rooftop solar source doesn’t match the rise in renewable energy in India; while industrial and commercial consumers account for 70% of total installed capacity, residential consumers remain a big untapped potential to give the boost. Most developed economies started their solar programmes by targeting household rooftops; as a result, they now have a sizable share of installations in the residential rooftop segment. China and India, on the other hand, have used large-scale solar installations in an effort to quickly achieve scale and simultaneously push down costs. In the case of India, this focus on large utility-scale solar seems to have become an unintended obstruction in the development of the rooftop segment.
Over 250 million households across India have the potential to deploy 637 GW of solar energy capacity on rooftops, according to a new independent report by the Council on Energy, Environment and Water (CEEW) released recently. Further, the CEEW report found that deploying just one-third of this total solar technical potential could support the entire electricity demand of India’s residential sector (~310 TWh).
However, the technical potential reduces to one-fifth (118 GW) after factoring in the current electricity consumption of households. Most residential consumers fall into low-consumption slabs and solar may not be economically feasible for them without financial support even though it is technically possible. The potential reduces further to 11 GW when no capital subsidy is considered, the payback period for rooftop solar is restricted to five years and we factor in consumers’ willingness to buy rooftop solar. However, with the Ministry of New and Renewable Energy’s capital subsidy, the potential increases to 32 GW making the solar systems feasible for more consumers. Currently, India has installed 11 GW of rooftop solar capacity, of which only 2.7 GW is in the residential sector.
On the other hand, the star performer in the 2022 PV market worldwide was the rooftop sector. Utility-scale projects continued to be the largest contributor to capacity additions, but the two sectors were very nearly equal: rooftop installations across the world accounted for 49.5% – 118GW – of new capacity in 2022. China added 51.1GW of rooftop PV in 2022, representing 54% of its total new capacity and a 29GW increase in real terms from its 2021 figures.
_____
_____
Largest Solar Installations in the World:
The world’s biggest solar plant has come online in China, capable of powering a small country with its annual capacity of more than 6 billion kilowatt hours. The facility in a desert region of the north-west province of Xinjiang covers 200,000 acres – roughly the same area as New York City. The 5 GW complex, which was connected to China’s grid recently, is powerful enough to meet the electricity demands of a country the size of Luxembourg or Papua New Guinea. China has led the world in solar power adoption, boosting its capacity in 2023 by more than 50 per cent. The new solar farm overtakes the Ningxia Teneggeli and Golmud Wutumeiren solar projects, which are both also in China, to become the largest in the world.
-1. Golmud Solar Park — China
The Golmud Solar Park, located in China, holds the title as the second largest solar farm in the world with an impressive 2.8 GW of solar capacity, slightly edging out the next contender on the list. The park currently features close to seven million solar panels, all dedicated to generating renewable energy. With plans to expand capacity to 16 GW in the next five to six years, the potential of the Golmud Solar Park is enormous. To put its scale into perspective, a single gigawatt can supply power to one million homes in the UK for an hour, or light up around 100 million LED bulbs.
-2. Bhadla Solar Park — India
With a remarkable capacity of 2.7 GW, Bhadla Solar Park ranks as the third largest solar farm globally. Spanning 14,000 acres or about 56 square kilometres, it’s roughly 3% of London’s total area or just under Manhattan’s size. Positioned in Rajasthan, a region blessed with 7.57 kWh per m² per day of solar irradiance and around 300 sunny days annually, Bhadla is ideally situated for solar generation. The region’s scant annual rainfall of twelve inches also makes it a nearly uninhabitable yet perfect location for harvesting continuous solar energy.
-3. Mohammed bin Rashid Al Maktoum Solar Park — UAE
The United Arab Emirates, known for its abundant oil reserves, is also home to the fourth largest solar farm in the world. The Mohammed bin Rashid Al Maktoum Solar Park covers an area of 52,881 acres (214 km²) and currently has a capacity of 2.62 GW, with plans to increase this to around 5 GW by 2030. Although it’s not yet the most powerful, it already powers 270,000 homes and reduces CO2 emissions by about 1.4 million tonnes annually. Despite these achievements, the UAE’s high per capita emissions mean there is still much work to be done.
-4. Pavagada Solar Park — India
India’s Pavagada Solar Park, at 13,000 acres (53 km²), ranks fifth. It boasts a capacity of 2.05 GW, contributing significantly to the country’s renewable energy initiatives. The construction cost of this massive facility was around $2 billion, part of India’s broader investment of about $20 billion in renewable energy development through 2024.
-5. Benban Solar Park — Egypt
Egypt’s Benban Solar Park is the largest in Africa and the sixth largest worldwide, with a capacity of 1.8 GW. It significantly contributes to powering hundreds of thousands of Egyptian homes and is a pivotal component of Egypt’s Nubian Suns Feed-In Tariff program aimed at boosting investment in renewable energy.
-6. Tengger Desert Solar Park — China
Further emphasising China’s commitment to solar energy, the Tengger Desert Solar Park spans 10,626 acres (43 km²) and has a 1.5 GW capacity, sufficient to power around 600,000 homes.
-7. Noor Abu Dhabi Solar Power Project — Abu Dhabi
Although it’s not the most powerful with a 1.2 GW capacity, the Noor Abu Dhabi Solar Power Project is noteworthy as the largest single-site solar farm worldwide, spanning 1,977 acres (8 km²). It employs an extensive array of robots to maintain its vast number of solar panels in an environmentally friendly manner by not using water.
-8. Datong Solar Power Top Runner Base — China
The Datong Solar Power Top Runner Base, soon expected to exceed 3 GW capacity, is currently operational at about 1.1 GW.
-9. Jinchuan Solar Park — China
Located in China’s northern region, the Jinchuan Solar Park enjoys abundant sunshine and a semi-arid climate, making it ideal for solar power generation. It currently has a capacity of 1.03 GW, enough to serve thousands of homes.
-10. Kurnool Ultra Mega Solar Park — India
Located in India’s Kurnool district, this 1 GW-capacity solar farm can power nearly the entire region during peak sunlight hours, producing approximately 8 GWh in optimal conditions. The area experiences about 35–40 rainy days per year, making it an excellent location for solar energy production.
______
______
A vast solar potential remains untapped:
As more solar capacity was installed in countries with below-average solar insolation, a vast potential remains untapped. Africa accounted for less than 1% of global installed solar capacity as of 2023, marking a stark disparity compared to the rest of the world.
The sunniest countries have installed the least solar capacity as depicted in figure below:
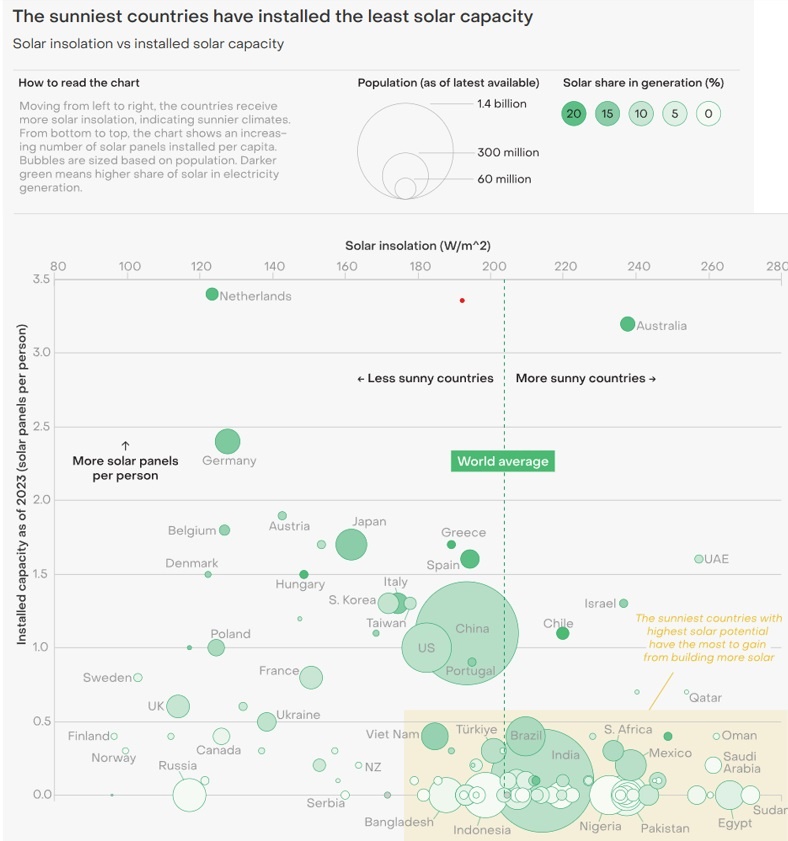
Figure above shows solar insolation vs installed solar capacity.
The sunniest countries have installed the least solar. Only 14% of global solar capacity installed as of 2023 (204 GW) was in markets with solar insolation above the global average. Notably, Japan has 13 times as many solar panels per person than India and 41 times as many as Egypt despite the fact that a solar panel in these two sunnier countries would produce 32% and 64% more electricity, respectively.
This underscores the vast untapped potential in markets with higher insolation, which would lead to higher solar capacity factors. Therefore, stronger support for solar projects in countries with high potential such as India and African countries, is imperative. Unleashing their potential will benefit greatly from the dramatic reduction in solar costs, largely driven by early adopters’ support.
There is a stark regional disparity in global renewable capacity growth. Africa, despite being home to almost a fifth of the world’s population, accounted for only 0.2% of solar additions in 2023 and 0.8% of wind, adding less than 1 GW of each. Persisting barriers such as limited access to affordable financing, have prevented African countries from taking part in the solar growth story. Enabling African countries to unleash their solar potential will help meet their growing electricity demand with clean power, while also significantly accelerating the global clean power revolution.
______
______
Rapid growth of solar:
Solar energy started its journey in niche markets, like most innovations, supplying electricity to applications where little alternatives existed in space and remote locations. Since then, cumulative investments and sales, driven by past policy, have made its cost come down by almost three orders of magnitude. The introduction of feed-in tariffs in Germany induced a volume of investment and related cost reductions, that brought the technology to mainstream markets following Chinese involvement in supply chains.
_
Cost reductions and rapid deployment work hand in hand, something observed for many technologies.
Deployments typically follow Rogers’ S-curve diffusion, with a bi-directional interaction with cost reductions from Wright’s law. For solar (and wind), rapid deployments supported by past policies, have pushed down technology costs. This promotes further diffusion in a virtuous cycle. Such non-linearity in the diffusion process raises the possibility of an irreversible tipping point.
_
There are many reasons why solar has experienced such high learning rates. Its simplicity, modularity and mass scale replicability allow for significant learning opportunities, related to those seen across the electronics industry. Indeed, numerous spillovers have originated from the computer industry. Innovation and improvements to solar PV are ongoing. For instance, the commercialisation of (hybrid) perovskite cells, as well as next-generation technologies like TopCon and Heterojunction technology (HJT), holds promises for higher efficiencies and lower unit prices. Due to decreasing technology risks and financial learning, finance is partly cheaper to procure. Progress in recycling helps material supply security and may decrease life-cycle costs. Meanwhile, the chemical diversity of batteries (e.g. iron-air, vanadium-flow), storage technologies highly supportive of solar PV, make further advances highly likely.
____
Rise of solar:
With the decrease in the costs of solar energy technology and the increase in production capacities in the world, the PV market has grown significantly. Solar PV generation increased by a record 270 TWh (up 26%) in 2022, reaching almost 1300 TWh. It demonstrated the largest absolute generation growth of all renewable technologies in 2022, surpassing wind for the first time in history. This generation growth rate matches the level envisaged from 2023 to 2030 in the Net Zero Emissions by 2050 Scenario. Continuous growth in the economic attractiveness of PV, massive development in the supply chain and increasing policy support, especially in China, the United States, the European Union and India, are expected to further accelerate capacity growth in the coming years. The tracking status of solar PV has therefore been upgraded in 2023 from “more effort needed” to “on track”.
_
Although global levels of planet-heating pollution reached a record high in 2023, the boom in renewables has pushed the electricity sector’s carbon intensity — the amount of carbon pollution produced per unit of electricity — to a record low in 2023, 12% less than its 2007 peak. The rise of renewables is also pushing fossil fuels into decline, slowing their growth by almost two-thirds over the past decade. Already, more than half of countries are five years past their peak in fossil fuel-generated electricity. Fossil fuels’ share in the overall electricity mix has fallen from 64.7% in 2000 to 60.6% in 2023. Ember predicts this number will drop significantly in 2024, to 57.6%, as the rapid increase in solar starts to be felt.
_
Solar energy is the fastest-growing electricity source as seen in the figure below:
The expansion of renewables in the global electricity mix has been driven by significant increases in solar and wind generation. Their growth far outpaces that of hydropower, which is the largest source of clean power.
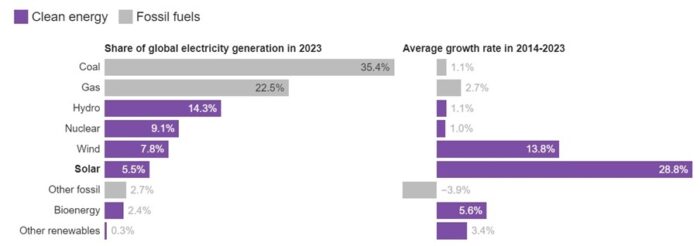
While coal and gas still make up the bulk of global electricity generation, their growth rate in 2023 was far lower than that of wind and solar.
_
Figure below illustrates the contribution of energy sources to both electricity generation and total installed power capacity by 2050. In 2016, as depicted in figure below, renewables contributed to about 30% of the global installed capacity, providing nearly a quarter of global electricity production. The solar power (PV+CSP) accounted for nearly 8% of the renewable electricity production. As shown in figure below, by 2050, solar PV technology is projected to have the largest installed capacity (8519 GW), making it the second most prominent generation source behind wind power, and it is expected to generate approximately 25% of total electricity needs by 2050.
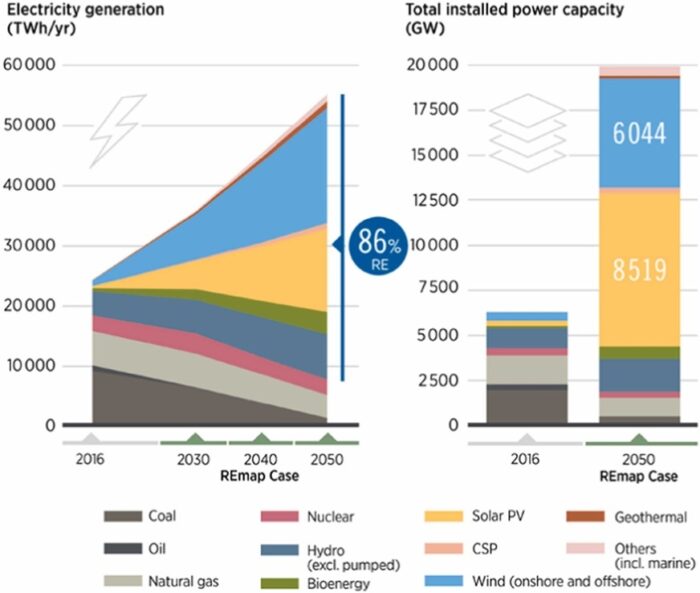
Figure above shows the contribution of energy sources in both electricity generation and total installed power capacity by 2050 (IRENA, 2019a).
_
Renewable energy sources are expected to make up 22% of America’s total energy generation capacity by the end of 2024, further increasing to 24% by the end of 2025, according to the EIA. That projection accounts for solar, wind and hydropower. Those three renewable sources only accounted for 21% of US grid capacity in 2023. Solar energy is the most rapidly growing renewable energy source by far. The EIA projects that solar generation will increase by up to 41%, building on record setting growth in 2023. Energy generation from wind will grow 5% and energy generation from hydropower will grow 6% in 2024. There was more solar power added to America’s grid in 2023 than ever before, thanks in large part to federal incentives for solar installations included within the Inflation Reduction Act. In 2023, over half of the new energy generating capacity in the US came from solar panels — marking the first time in history solar eclipsed 50% of yearly additions to the grid.
______
Fastest growing solar:
Installed solar capacity is doubling every three years, meaning it has grown tenfold in the past ten years. The Economist says the next tenfold increase will be the equivalent of multiplying the world’s entire fleet of nuclear reactors by eight, in less time than it usually takes to build one of them. To give an idea of the standing start the industry has grown from, The Economist reports that in 2004 it took the world an entire year to install one gigawatt of solar capacity (about enough to power a small city). This year, that’s expected to happen every day.
Energy experts didn’t see it coming. The Economist includes a chart showing that every single forecast the International Energy Agency has made for the growth of the growth of solar since 2009 has been wrong. What the agency said would take 20 years happened in only six. The forecasts closest to the mark were made by Greenpeace – “environmentalists poo-pooed for zealotry and economic illiteracy” – but even those forecasts turned out to be woefully short of what actually happened.
And the cost of solar cells has been plunging in the way that costs usually do when emerging technologies become mainstream.
The Economist describes the process this way:
As the cumulative production of a manufactured good increases, costs go down. As costs go down, demand goes up. As demand goes up, production increases – and costs go down further.
Normally, this can’t continue. In earlier energy transitions – from wood to coal, coal to oil, and oil to gas – it became increasingly expensive to find fuel.
But the main ingredient in solar cells (apart from energy) is sand, for the silicon and the glass. This is not only the case in China, which makes the bulk of the world’s solar cells, but also in India, which is short of power, blessed by sun and sand, and which is manufacturing and installing solar cells at a prodigious rate.
______
Solar investments:
The world is finally spending more on solar than oil production. The International Energy Agency published its annual report on global investment in energy, where it tallies up all that cash. The world saw about $2.8 trillion of investments in energy in 2022, with about $1.7 trillion of that going into clean energy. That’s the biggest single-year investment in clean energy ever. There’s a lot of money going into clean energy—including renewables, nuclear, and things that help cut emissions, like EVs and heat pumps. And not only is it a lot of money, but it’s more than the amount going toward fossil fuels. In 2022, for every dollar spent on fossil fuels, $1.70 went to clean energy. Just five years ago, it was dead even. More money is now going into solar PV (photovoltaic panels) than all other electricity generation technologies combined, the IEA report said. Solar panel costs have decreased by 30 percent over the past two years and in 2024 investment in solar PV is set to grow to $500 billion as falling module prices spur new investments. By comparison, global upstream oil and gas investment is expected to increase by seven percent in 2024 to reach $570 billion, following a similar rise in 2023.
_____
Solar Politics:
Acceptance of wind and solar facilities in one’s community is stronger among U.S. Democrats, while acceptance of nuclear power plants is stronger among U.S. Republicans.
Solar production cannot be cut off by geopolitics once installed, unlike oil and gas, which contributes to energy security.
As of 2022 over 40% of global polysilicon manufacturing capacity is in Xinjiang in China, which raises concerns about human rights violations (Xinjiang internment camps) as well as supply chain dependency.
______
Solar scams:
Solar energy is not just a renewable energy source; it’s a smart investment for the future. As we globally shift towards renewable energy, the solar industry is experiencing tremendous growth. However, alongside legitimate solar companies, scam artists have also found their way into the market, attempting to capitalize on unsuspecting consumers. As potential solar adopters, it’s crucial to discern the genuine from the counterfeit, ensuring that your move towards a sustainable future isn’t hindered by a bad experience.
Solar scams can take numerous forms, making them sometimes challenging to identify. Deceptive practices may include aggressive sales tactics, unrealistic promises, lack of transparency, or even identity theft. Scammers might exaggerate potential savings, misrepresent government incentives, or sell low-quality equipment at inflated prices. The key to avoiding a solar scam is understanding these deceptive practices and knowing how to verify the credibility of a solar company.
_
Common Solar Scam Tactics:
To avoid a solar scam, it’s crucial to familiarize yourself with some of the common tactics used by scammers. These include:
- Overstating Savings: While solar energy can save you money over time, scammers often exaggerate these savings to lure you into a deal.
- High-Pressure Sales: Scammers may use high-pressure sales tactics, rushing you to make a decision without thoroughly researching or understanding the contract.
- Misrepresentation of Government Incentives: Some scammers may claim that you are eligible for government incentives that do not exist or for which you do not qualify.
- Inflated Prices: Scammers often sell low-quality solar products at inflated prices, or they might charge you for services that were never provided.
_
How to Protect Yourself:
-1. Always Research: Before selecting a solar company, research its reputation, check their license, and read online reviews.
-2. Get Multiple Quotes: Getting quotes from multiple providers allows you to compare prices and services.
-3. Understand the Contract: Read the contract thoroughly, ensure you understand all the terms and conditions, and don’t be afraid to ask questions.
-4. Seek Independent Advice: Consider getting independent advice from a solar consultant or legal advisor before making any significant investments.
In conclusion, while the rise of solar energy has unfortunately given rise to scams, the good news is that they can be avoided. Armed with knowledge, due diligence, and cautious decision-making, you can protect yourself from falling prey to these frauds and confidently invest in your solar-powered future.
_______
_______
Applications of Solar Energy:
There are various applications of solar energy since it is freely available with low damage to environment. Solar energy is now applied for heating of buildings, cooling of buildings, heat generation for industries, food refrigeration, heating of water, distillation, drying, cooking, power generation and other various processes.
Some major applications of solar energy include:
- Solar water heating
- Solar distillation
- Solar heating of buildings
- Solar pumping
- Solar furnaces
- Solar greenhouses
- Solar cooking
- Solar electric power generation
____
Applications of solar PV:
Solar technology is becoming increasingly important as the world increasingly turns to renewable energy sources to combat climate change. Solar panels are now being used to power everything from homes and businesses to street lights and traffic signals. And as prices for solar panels continue to drop, their use is only likely to increase. There are many practical applications for the use of solar panels or photovoltaics. It can first be used in agriculture as a power source for irrigation. In health care solar panels can be used to refrigerate medical supplies. It can also be used for infrastructure. PV modules are used in photovoltaic systems and include a large variety of electric devices:
- Agrivoltaics
- Solar canals
- Photovoltaic power stations
- Rooftop solar PV systems
- Standalone PV systems
- Solar hybrid power systems
- Concentrated photovoltaics
- Floating solar; water-borne solar panels
- Solar planes
- Solar-powered water purification
- Solar-pumped lasers
- Solar vehicles
- Solar water heating
- Solar panels on spacecraft and space stations
- Solar landfill
_____
Electricity generation:
Solar cell (PV cell):
Solar radiation may be converted directly into solar power (electricity) by solar cells, or photovoltaic cells. Small photovoltaic cells that operate on sunlight or artificial light have found major use in low-power applications—for example, as power sources for calculators and watches. Larger units have been used to provide power for water pumps and communications systems in remote areas and for weather and communications satellites. By connecting large numbers of individual cells together, however, as in solar-panel arrays, hundreds or even thousands of kilowatts of electric power can be generated in a solar electric plant or in a large household array.
Concentrated solar-power (CSP) plant:
Concentrated solar power plants employ concentrating, or focusing, collectors to concentrate sunlight received from a wide area onto a small blackened receiver, thereby considerably increasing the light’s intensity in order to produce high temperatures. The working fluid in the receiver is heated to 500–1000 °C (773–1,273 K or 932–1,832 °F) and then used as a heat source for a power generation or energy storage system.
_____
Apart from generating electricity, solar energy is also used for some other purposes. Some uses of solar energy are discussed below.
-1. Agriculture:
In arid lands where the water for agriculture is not readily available, the solar desalination process has been applied to convert brine into fresh water for agriculture uses. In this process, the brine is collected in a basin, and then solar energy is used to evaporate the water. This fresh water can be used for agricultural purposes. The first solar desalination plant was used in 1872 in Northern Chile.
The water pumps, driven by the energy from solar PV cells, have been successfully employed in the Algerian Sahara region. About 60 pumps were installed to produce water for drinking and irrigation crops like wheat, potatoes, tomatoes, and sunflowers.
-2. Solar vehicle:
To achieve sustainable mobility and to cut down the environmental impacts through the usage of fossil fuels, a lot of research is being done to develop cars equipped with solar energy. Because of the ever increasing cost of fossil fuels and advances made in the PV cells, the future of solar assisted vehicles seems to be bright. A solar vehicle with a footprint of 8 m2 can generate 1600 to 2400 W or 2 to 3 horsepower, given current PV efficiencies; while average horsepower for a car is anywhere from 100hp to 200hp. It, therefore, seems difficult to envision a solar powered vehicle in near future. However, the increasing concerns about the environmental impacts of fossil fuels and their costs are contributing a lot towards focusing on research in this field. The current problems with the advancement of the solar vehicle are its high‐initial cost, small speed range and low efficiency of 17%.
-3. Cooking:
In many countries, the fuel used for cooking comes from firewood. In India for example, 47% of the energy for cooking comes from the wood. In many African countries, this percentage is even greater than 75%. Replacing this energy with the help of solar cooking can save the environment by saving trees. A solar cooking system has been established with the energy storage capability. It consists of flat plate collectors, reflectors, and a working fluid, which usually transfers the heat from the collectors for cooking goods.
The Darfur Solar Cookers Project:
For the 200,000 displaced citizens of Darfur living in refugee camps in Chad, the simple task of cooking a meal poses serious risks. Since wood for cooking is scarce in the desert region, refugees must travel several miles outside the camp to gather firewood, where they are highly vulnerable to attacks by the Janjaweed militia and other predators. A 2005 report by Médecins Sans Frontières found that 82 per cent of rape attacks occur when women are outside the populated villages, usually while searching for firewood. But in the Iridimi camp with 17,000 refugees in eastern Chad, families have cut their firewood use by 50 to 80 per cent, using simple solar cookers to prepare their meals.
-4. Water treatment:
During the past 20 years, photo catalysis has gained tremendous success in the gradation of organic pollutants in water and air. Thin‐film fixed‐bed reactor (TFFBR) is one of the early solar reactors that uses a light concentrating system for the photo catalysis of water. As for commercialization of catalytic treatment of water, the technical barrier at this time is the post recovery of the catalyst particles after water treatment.
-5. Solar energy for fuel production (solar fuel):
A solar fuel is a synthetic chemical fuel produced from solar energy. Perhaps the greatest challenge in solar energy is what photovoltaics cannot do. They cannot make fuel. The amount of sunlight that beams to Earth could more than supply all of humanity’s energy if we knew how to convert the energy in sunlight into liquid fuels, like gas for cars. Plants, plankton, and algae can do it; they produce the fuel they need to grow from sunlight, water, and carbon dioxide.
One method is to convert it into hydrogen or chemical fuel as shown in Equations 1 and 2, respectively.
2H2O→2H + 2e−; (1)
CO2 + 2H2O→CH4 + 2O2: (2)
These reactions are driven by solar energy. Although splitting water to produce hydrogen is a good way to store solar energy, it is not economically viable, and the hydrogen produced does not compensate for the cost of catalysts and experimentation. As for methane production from carbon dioxide, although the results are promising, methane is not an environment‐friendly fuel.
Another alternative for fuel production from solar energy is artificial photosynthesis, but before its practical implementation, dramatic improvements in its efficiency and durability are required. Chemists, engineers, physicists, and materials scientists have collaborated for years to develop artificial photosynthesis, a process that would harness the energy of sunlight to make liquid fuels from water and waste gases. A solar fuel can be produced and stored for later use, when sunlight is not available, making it an alternative to fossil fuels and batteries. To make it a reality, these researchers are developing new catalysts, which speed up chemical reactions; new materials to carry electrical charges during those reactions; and new strategies to streamline the conversion process.
-6. Solar energy in space:
Solar energy can be used to build satellite power stations orbiting around Earth. These satellite power station can convert solar energy into electricity by PV technology and other solar technologies. This electricity can be converted into a microwave beam via a microwave generator and antenna located on the satellite. The microwave beam from the satellite antenna can be directed towards a receiving antenna on Earth. In this way, the microwave beam can again be converted into electricity on Earth. This satellite system power can be delivered anywhere on Earth. A 5.8 GHz microwave wireless power transmission (MWPT) system can have a DC-to-DC efficiency of 45% when the transmitter and rectenna components are optimized. In 2022, one study demonstrated a 5.8 GHz MWPT system with an overall RF-DC efficiency of 19.08%. This efficiency is the result of the development of highly efficient DC‐RF converters and rectennas developed for this frequency.
The beam control system based on retro directivity is yet to be demonstrated. Moreover, because of the huge expenses of space transportation systems and lack of commercial space markets, the financial viability of satellite wireless power transmission is still under question. However, space transmission systems and wireless transmission technology are expected to advance to the point of contributing to solar power in the future.
-7. Solar heating:
Solar thermal collectors allow people to harness the sun’s abundant warmth through various methods used in their daily lives! Instead of capturing the sun’s energy for electricity, thermal devices collect heat from sunlight and send it through pipes where water can be heated up to create usable energy.
Solar energy systems come in various configurations, but one type that is becoming increasingly popular is the hot air solar system. This type of system harnesses the power of the sun to heat your home. This is a great way to reduce your carbon footprint.
-8. Solar-powered pumps:
A solar pump can be installed to provide water for your home and garden, and it will use solar power to run instead of relying on grid electricity. The system operates on power generated using solar PV (photovoltaic) system. This can save you money on your utility bill, and it also has the added benefits of being environmentally friendly and reducing your carbon footprint. Solar pumps offer a lot of advantages over traditional electric pumps, so if you’re looking for an environmentally friendly and cost-effective option, a solar pump might be the right choice for you.
-9. Portable solar:
As solar technology becomes more and more popular, homeowners are looking to incorporate it into their homes. Portable solar allows you to take your solar panels with you wherever you go, so you can always benefit from the sun’s energy. Whether you’re camping, tailgating, or just out on the boat, portable solar benefits you with solar power.
Solar Generators:
A solar generator typically refers to a combination of portable solar panels, a battery, a battery charger and an inverter. These all make up one device — the generator. With it, you can absorb solar energy, then store and distribute it when needed. Solar generators are quite common on camping and boating trips. They also prove incredibly useful in emergency situations when you need backup power, like during a wide-scale, long-term power outage. What’s more, a large generator (around 20 KW of storage capacity) can power an entire house for two to eight hours. But this depends on how much energy your home uses in terms of lighting, appliances and more.
-10. Charging EV batteries:
One of the biggest breakout facts of solar powered systems is the ability to generate energies that would charge up EVs to a great level. Although the technology related to EV charging with purely solar power is in its nascent stages, the future looks bright for a time when 100% charging using solar power would be imminent. For now, it is more than possible to charge a vehicle using solar panels and use it for regular commutes within the city range. Another astounding fact about solar-based charging is the option of bidirectional charging techniques, which would allow it to send excess power back to the grid without dissipating. The technology is getting ready for the future of EVs as a whole.
-11. Solar energy for green houses:
Green house is a structure commonly used in agriculture to grow plants with intensive care for better production. Solar energy is now used prominently to heat green house and therefore such system is labeled as solar green house where solar energy is used for both heating and lighting. The system is well to retain heat during night and cloudy days. This setup will greatly reduce the need to use fossil fuel for heating. In some greenhouse configurations, gas or oil heater is used as back up heater to release CO2 for better plant growth.
-12. Solar energy for wastewater treatment:
Huge amount of water is used in various industrial processes and left as effluent with higher biochemical oxygen demand into environment without treatment and this causes severe damage to environment and living things. Treating such strong effluent to permissible level of its parameters is complex, which utilizes higher energy for treatment and it is expensive. Therefore, many industries are unable to afford it. However, incorporation of treatment plant for wastewater is compulsory in all the countries. PV panels play a key role in supplying electricity to operate various components of treatment plant to eliminate environmental pollution and better production.
_______
What does the future hold for solar technology? Here are a few of the most exciting developments:
-1. Solar roofs: Tesla has already announced plans to sell solar roofs that would collect energy from the sun and generate electricity for your home. This could mean big savings for homeowners and a major reduction in carbon emissions. And other companies are sure to follow suit.
-2. Solar roads: A company in the Netherlands has already created a prototype for a solar-powered road surface that can generate electricity while also providing a safe and durable driving surface. If this technology can be scaled up, it could significantly boost the renewable energy industry.
-3. Solar-powered devices: We’re already seeing several small devices, like calculators and flashlights, powered by solar energy. But in the future, we could see much larger devices, like laptops and even cars.
_______
_______
Solar-powered drip irrigation enhances food security in the Sudano–Sahel, a 2009 study:
Currently, drip (or micro) irrigation is the most rapidly expanding type of irrigation in sub-Saharan Africa. Drip irrigation delivers water (and fertilizer) directly to the roots of plants, thereby improving soil moisture conditions; in some studies, this has resulted in yield gains of up to 100%, water savings of up to 40–80%, and associated fertilizer, pesticide, and labor savings over conventional irrigation systems. Photovoltaic- (or solar-) powered drip irrigation (PVDI) systems combine the efficiency of drip irrigation with the reliability of a solar-powered water pump. Meeting the food needs of Africa’s growing population over the next half-century will require technologies that significantly improve rural livelihoods at minimal environmental cost. These technologies will likely be distinct from those of the Green Revolution, which had relatively little impact in sub-Saharan Africa; consequently, few such interventions have been rigorously evaluated. This paper analyzes solar-powered drip irrigation as a strategy for enhancing food security in the rural Sudano–Sahel region of West Africa. Using a matched-pair comparison of villages in northern Benin (two treatment villages, two comparison villages), and household survey and field-level data through the first year of harvest in those villages, authors find that solar-powered drip irrigation significantly augments both household income and nutritional intake, particularly during the dry season, and is cost effective compared to alternative technologies.
_____
Simultaneous production of fresh water and electricity via multistage solar photovoltaic membrane distillation, A 2019 study:
The energy shortage and clean water scarcity are two key challenges for global sustainable development. Near half of the total global water withdrawals is consumed by power generation plants while water desalination consumes lots of electricity. Here, authors demonstrate a photovoltaics-membrane distillation (PV-MD) device that can stably produce clean water (>1.64 kg·m−2·h−1) from seawater while simultaneously having uncompromised electricity generation performance (>11%) under one Sun irradiation. Its high clean water production rate is realized by constructing multi stage membrane distillation (MSMD) device at the backside of the solar cell to recycle the latent heat of water vapor condensation in each distillation stage. This composite device can significantly reduce capital investment costs by sharing the same land and the same mounting system and thus represents a potential possibility to transform an electricity power plant from otherwise a water consumer to a fresh water producer.
_____
_____
FAQs:
-1. What are advantages and disadvantages of solar energy?
Solar energy offers many advantages, such as reduced electricity bills, a sustainable and renewable energy source, independence from the power grid, minimal environmental impact, and potential economic benefits. Solar energy has quickly become one of the most popular sources of clean, renewable energy for homeowners worldwide.
Despite the numerous advantages of solar energy, it has some drawbacks. These include high upfront costs, energy efficiency problems, difficulty with moving, possible pollution from materials used in panel creation, negative energy balance, installation area requirements, and maintenance or repair needs. Additionally, solar energy can be obstructed by weather conditions and wildlife.
-2. What can damage solar panels?
Although Solar panels are sturdy enough to sustain most environmental damages, heavy dust or debris can scratch the surface of these panels, which affects their efficiency.
-3. Do solar systems generate electricity on cloudy days?
The solar power system functions every time it receives sunlight even on cloudy days albeit with lesser output.
-4. Is solar energy efficient?
Most modern solar panels process 15-22% of solar energy into usable power, depending on factors such as positioning, orientation and weather conditions. The efficiency of a solar panel to convert sunlight into energy is known as performance.
-5. Can solar energy be stored?
Solar energy can be stored using thermal mass systems using materials with specific heat capacities such as stone, molten salts, paraffin wax, earth or water. Solar energy can also be sent directly to a grid, stored in solar batteries, used to produce storable hydrogen fuel or used to pump water to a higher elevation so that it can then be recovered by releasing the water down through a hydroelectric power generator. The power stored from solar energy systems using these methods can be used at times of demand.
-6. Can solar energy replace Fossil Fuels?
Solar energy has the potential to replace fossil fuels entirely, but it is more likely to be used as part of a wider renewable energy mix including other resources like wind power.
-7. Do solar panels reduce your carbon footprint?
Yes, solar panels can significantly reduce your carbon footprint by generating electricity without emitting greenhouse gases. Using clean and renewable energy from the sun helps mitigate climate change and lowers your overall environmental impact.
-8. How much can I save on energy bills with solar panels?
The savings on energy bills with solar panels depend on system size, local sunlight conditions and energy consumption. Most homeowners should anticipate solar panels paying for themselves within 10 years.
-9. Can you go off-grid with solar?
Yes, it’s possible to go off-grid with solar panels by incorporating energy storage solutions like batteries. This allows you to store excess energy generated during sunny times of the day for use during cloudy days or at night, providing a self-sustaining power source.
-10. Can solar panels generate enough power for my entire house?
The capacity of solar panels to power your entire house depends on factors like your energy consumption, roof space and local sunlight conditions. Usually, solar installations can cover most of your electricity needs. You can integrate additional energy sources or storage solutions for full coverage.
-11. What are the Roof Space requirements for solar panel installation?
The answer depends on several factors, including your energy needs, panel efficiency, and location. On average, a standard residential solar panel system requires approximately 100-250 square feet (9-23 square meters) of roof space for every kilowatt (kW) of installed capacity. A typical 5kW system would need around 500-1,250 square feet (46-116 square meters) of unobstructed roof space. However, it’s important to remember that various factors, such as shading, panel orientation, and local weather conditions, can affect this requirement. Remember, solar panels can also be installed on the ground or integrated into building materials, offering flexibility for homeowners with limited roof space. With the right planning, solar power can be accessible to nearly every homeowner.
_____
_____
Section-7
Solar thermal technologies:
In thermodynamics, heat is the thermal energy transferred between systems due to a temperature difference. In colloquial use, heat sometimes refers to thermal energy itself. Thermal energy is the kinetic energy of vibrating and colliding atoms in a substance. Thermal radiation is electromagnetic radiation emitted by the thermal motion of particles in matter. All matter with a temperature greater than absolute zero emits thermal radiation. The primary method by which the Sun transfers heat to the Earth is thermal radiation. This energy is partially absorbed and scattered in the atmosphere, the latter process being the reason why the sky is visibly blue. Much of the Sun’s radiation transmits through the atmosphere to the surface where it is either absorbed or reflected. When matter absorbs thermal radiation, its temperature will tend to rise. When photons of solar radiation strike any object on earth, its energy is transferred by heating the object and temperature of the object is increased i.e. increased motion of atoms. This is photons to atoms transfer of energy is used by solar thermal technology. Geater the flux of photons energy hitting the object, greater the rise in temperature of object receiving solar photons.
_
Solar thermal systems harness the heat from sunlight to generate thermal energy, which can be used for various applications. Unlike PV systems that convert sunlight directly into electricity, solar thermal systems focus on capturing and utilizing the sun’s heat for heating water, air, or other fluids. This renewable and sustainable form of energy offers significant potential for reducing reliance on fossil fuels and mitigating greenhouse gas emissions. Solar thermal systems find application in a wide range of sectors, including residential, commercial, and industrial settings. Common applications include water heating, space heating, air conditioning, and industrial processes such as drying and desalination. By utilizing solar energy, these systems provide a clean and cost-effective alternative to conventional heating methods, contributing to energy efficiency and environmental sustainability.
_____
_____
There are three general types of solar thermal energy: low-temperature used for heating and cooling air, mid-temperature used for heating water, and high-temperature used for electrical power generation.
-1. Low-temperature:
Low-temperature solar thermal energy systems involve heating and cooling air as a means of climate control, such as in passive solar building design. In properties built for passive solar energy use, the sun’s rays are allowed into a living space to heat an area and blocked when the area needs to be cooled as seen in the figure below.
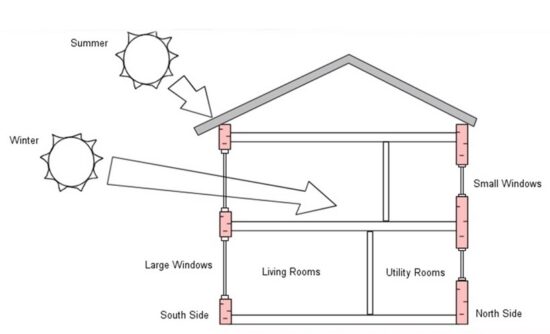
This form of energy is often taken for granted; but can contribute a significant amount of the energy demands of a well-designed building in the heating season. Sunlight enters a building through windows, and warms the inside. In an average house in the UK, passive solar gain contributes 14% of the heating demand.
Thoughtful design can improve above figure further with very little, if any, increase in the cost of building the property:
- Orienting the house so that the more often used rooms face south;
- Larger windows on the south side, smaller on the north;
- Using building materials that store heat by adding “thermal mass” to the house and
- Laying out housing developments so that buildings do not over-shadow each other
Care needs to be taken to avoid causing overheating in summer through the provision of too much glass, measures such as overhanging eaves and brise-soleil can provide shade in summer months (when the sun is high in the sky), while still letting the light into the building in the heating season (when the sun is lower in the sky). Highly optimised passive solar design can provide 40% of the space heating load of a property.
_____
-2. Mid-temperature:
Mid-temperature solar thermal energy systems include solar hot water heating systems. In a solar hot water setup, collectors on your roof capture heat from the sun. They then transfer this heat to the water running through your home’s pipes so you don’t have to rely on traditional water heating methods, such as water heaters powered with oil or gas as seen in figure below.
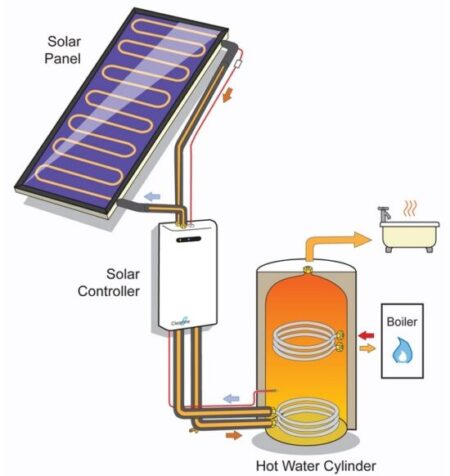
A solar thermal panel is simply a black surface that absorbs light, heats up and transfers the heat into a working fluid. It can be unglazed or glazed. Glazed panels can be flat, or made up of a collection of glass tubes. The working fluid moves the heat to a place where it is useful – perhaps a hot water store, swimming pool or directly to space heating for a building.
Panels with higher levels of insulation, such as a glazed cover above and thermal insulation behind do not require direct sunshine to operate and will collect heat on a cloudy day. Most commonly, the energy is used to provide for low temperature applications such as hot water for washing, space heating, feeding heat into district heating networks or providing heat to industrial processes.
An auxiliary heat source such as a gas boiler or electric immersion heater is required for days when light levels don’t raise the water in the cylinder to the required temperature. The upshot of this is that a proportion of the annual hot water requirement of the building is provided by the solar system, and a proportion is provided by the auxiliary heating system. The proportion of the total supplied by the solar heating system is termed the Solar Fraction, and this will depend upon the area of panels installed, the efficiency of the panels, and the demand pattern from the household.
In recent years, progress has been made using heat from solar thermal panels as an energy input to drive air conditioning plant, though these implementations remain largely experimental in nature.
_____
-3. High-temperature:
High-temperature solar thermal energy systems use concentrated solar power (CSP) to generate electricity on a larger scale. In a solar thermal electricity plant, mirrors focus the sun’s rays on tubes containing a liquid that can hold heat energy well. This heated fluid evaporates water into steam, which then turns a turbine and generates electricity: all using concentrated sunlight!
If the sun’s rays are concentrated by mirrors, much higher temperatures can be created. The light is focused onto a central point with a carrier fluid such as oil flowing through it. The oil heats up to around 400C, hot enough to heat water and make high pressure steam that can drive a turbine and generate electricity.
Solar concentrators only work in direct sunshine. The mirror is held on a support that can turn to follow the sun as it moves throughout the day, adding to complexity and cost. Because of this, they are only used in areas benefiting from a sunny climate, with more clear-sky days.
Solar concentrators focus sunlight onto a receiver, generating high temperatures that can be used for power generation or industrial processes. Concentrated solar power (CSP) systems can utilize various configurations, such as parabolic troughs, dish Stirling systems, and solar power towers. The mechanism of concentrating solar energy in a solar power tower solar concentrator is shown in figure below.
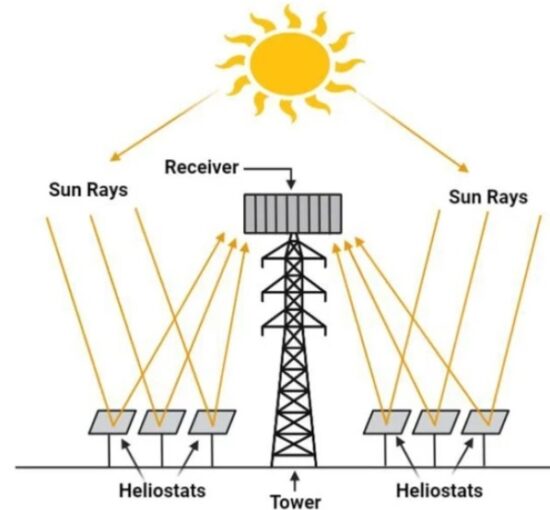
A power tower is a large tower surrounded by tracking mirrors called heliostats. These mirrors align themselves and focus sunlight on the receiver at the top of the tower, collected heat is transferred to a power station below. This design reaches very high temperatures. High temperatures are suitable for electricity generation using conventional methods like steam turbine or a direct high-temperature chemical reaction such as liquid salt.
_
Molten salt technology:
Solar-thermal tower technology uses a series of mirrors (heliostats) that track the sun on two axes, concentrating the solar radiation on a receiver on the upper part of the tower where the heat is transferred to the molten salts. The salts then transfer their heat in a heat exchanger to a water current to generate superheated and reheated steam, which feeds a turbine capable of generating around 110 MW of power in the case of Cerro Dominador.
_
Molten salt is used both as a heat transfer fluid (HTF) as well as a thermal energy storage medium. Molten salt can be employed as a thermal energy storage method to retain thermal energy collected by a solar tower or solar trough of a concentrated solar power plant so that it can be used to generate electricity in bad weather or at night. It was demonstrated in the Solar Two project from 1995 to 1999. The system is predicted to have an annual efficiency of 93 to 99%, a reference to the energy retained by storing heat before turning it into electricity, versus converting heat directly into electricity. The molten salt mixtures vary. The most extended mixture contains sodium nitrate, potassium nitrate and calcium nitrate. It is non-flammable and non-toxic, and has already been used in the chemical and metals industries as a heat-transport fluid. Hence, experience with such systems exists in non-solar applications.
The salt melts at 131 °C (268 °F). It is kept liquid at 288 °C (550 °F) in an insulated “cold” storage tank. The liquid salt is pumped through panels in a solar collector where the focused irradiance heats it to 566 °C (1,051 °F). It is then sent to a hot storage tank. This is so well insulated that the thermal energy can be usefully stored for up to a week.
When electricity is needed, the hot salt is pumped to a conventional steam-generator to produce superheated steam for a turbine/generator as used in any conventional coal, oil, or nuclear power plant. A 100-megawatt turbine would need a tank about 9.1 metres (30 ft) tall and 24 metres (79 ft) in diameter to drive it for four hours by this design.
_
Longevity of molten salt:
Molten salts lose only about 1 degree Celsius of heat a day, so it is possible to store – and top up – this thermal energy for months. Practically speaking, it is more profitable to use the stored energy daily; to get paid for the daily and nightly deliveries of electricity. But it is possible to size thermal solar energy storage capacity relative to the solar field that harvests the sunlight, so that it can be stored for months.
Molten salt thermal energy storage can be heated and cooled daily for at least 30 years. At that point, the tanks might need corrosion repair.
_
Several parabolic trough power plants in Spain and solar power tower developer SolarReserve use this thermal energy storage concept. The Solana Generating Station in the U.S. has six hours of storage by molten salt. In Chile, The Cerro Dominador power plant has a 110 MW solar-thermal tower, the heat is transferred to molten salts. The molten salts then transfer their heat in a heat exchanger to water, generating superheated steam, which feeds a turbine that transforms the kinetic energy of the steam into electric energy using the Rankine cycle. In this way, the Cerro Dominador plant is capable of generating around 110 MW of power. The plant has an advanced storage system enabling it to generate electricity for up to 17.5 hours without direct solar radiation, which allows it to provide a stable electricity supply without interruptions if required. The Project secured up to 950 GW·h per year sale. Another project is the María Elena plant is a 400 MW thermo-solar complex in the northern Chilean region of Antofagasta employing molten salt technology.
_
A study by Liu et al. analyzed the performance and economics of a solar power tower system based on a supercritical carbon dioxide (sCO2) Brayton cycle. The study reported that the sCO2 power tower system achieved a thermal efficiency of 49.66%, significantly higher than traditional steam-based power tower systems. Additionally, the sCO2 power tower system demonstrated cost competitiveness, with an estimated levelized cost of electricity (LCOE) of $0.1046 per kilowatt-hour (kWh), making it a promising option for large-scale solar power generation. Siva et al. reviewed the technological advancements and applications of solar concentrators and power towers for solar thermal power generation. The study highlighted the potential of these systems in achieving high-temperature operation, efficient power conversion, and storage integration. The review highlighted achievements in achieving thermal energy storage at temperatures above 1000 °C, paving the way for continuous and dispatchable solar power generation. Kumar et al. assessed the techno-economic feasibility of solar power tower systems for hydrogen production in India. The study concluded that solar power tower technology showed promise in terms of cost effectiveness and scalability for large-scale hydrogen production. The study reported a LCOE of $8.23 per kg of hydrogen, demonstrating the cost competitiveness of solar power tower systems in the Indian context.
_
A Fresnel lens is another type of CSP system that utilizes a stepped structure to mimic the effects of a traditional curved lens while minimizing material usage. This design not only reduces manufacturing costs but also offers unique advantages in solar thermal applications. By focusing sunlight onto a specific target, such as a solar receiver or heat exchanger, Fresnel lenses concentrate solar radiation and elevate temperatures, making them an attractive candidate for various thermal energy applications. Figure below illustrates the working procedure of a typical Fresnel lens.
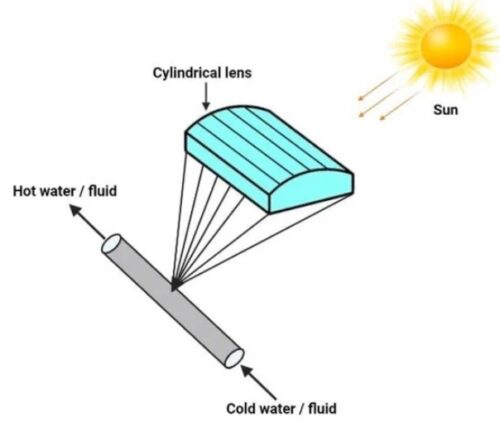
_
In a study by Pham et al., the performance of a Fresnel-lens-based solar concentrator was evaluated. The study reported a concentration ratio of approximately 576x and an average optical efficiency of 82.4%. The experimental results demonstrate the potential of Fresnel lenses in efficiently concentrating sunlight for solar thermal applications. The researchers Wu et al. investigated the use of Fresnel lenses for solar desalination. The study highlighted that their Fresnel-lens-based system achieved a temperature increase of up to 35 °C, showcasing the ability to generate high thermal energy levels for desalination processes. In another study, Zhai et al. assessed the thermal performance of a Fresnel lens solar collector. Their findings indicated that the collector achieved a maximum temperature of approximately 200 °C, with an average thermal efficiency of 50%. The research underscored the potential of Fresnel lens collectors in achieving elevated temperatures for industrial heating applications.
____
____
Solar thermal collectors:
A solar thermal collector collects heat by absorbing sunlight. The term “solar collector” commonly refers to a device for solar hot water heating, but may refer to large power generating installations such as solar parabolic troughs and solar towers or non-water heating devices such as solar cooker, solar air heaters.
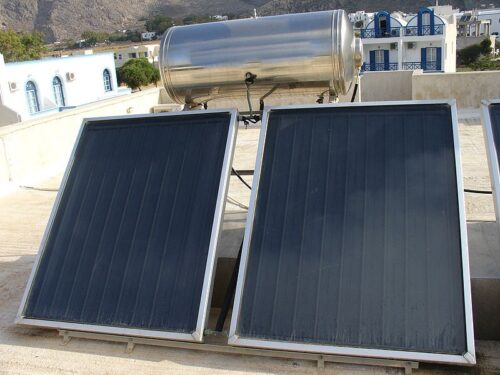
Figure above shows water heating system deployed on a flat roof. The pipes that carry the heat away can be seen embedded in the absorber, a flat plate painted black (solar thermal panel). In this example the heat is stored in the tank above the panels.
_
Solar thermal collectors are either non-concentrating or concentrating. In non-concentrating collectors, the aperture area (i.e., the area that receives the solar radiation) is roughly the same as the absorber area (i.e., the area absorbing the radiation). A common example of such a system is a metal plate that is painted a dark color to maximize the absorption of sunlight (see figure above). The energy is then collected by cooling the plate with a working fluid, often water or glycol running in pipes attached to the plate.
Concentrating collectors have a much larger aperture than the absorber area. The aperture is typically in the form of a mirror that is focussed on the absorber, which in most cases are the pipes carrying the working fluid. Due to the movement of the sun during the day, concentrating collectors often require some form of solar tracking system, and are sometimes referred to “active” collectors for this reason.
Non-concentrating collectors are typically used in residential, industrial and commercial buildings for space/water heating, while concentrating collectors in concentrated solar power plants generate electricity by heating a heat-transfer fluid to drive a turbine connected to an electrical generator.
Active solar heating uses pumps to move air or a liquid from the solar collector into the building or storage area. Applications such as solar air heating and solar water heating typically capture solar heat in panels which can then be used for applications such as space heating and supplementation of residential water heaters. In contrast to photovoltaic panels, which are used to generate electricity, solar heating panels are less expensive and capture a much higher proportion of the sun’s energy. Solar heating systems usually require a small supplementary backup heating system, either conventional or renewable.
_
General Principles of Operation:
A solar thermal collector functions as a heat exchanger that converts solar radiation into thermal energy. It differs from a conventional heat exchanger in several aspects. The solar energy flux (irradiance) incident on the Earth’s surface has a variable and relatively low surface density, usually not exceeding 1000 W/m² without concentration systems. Moreover, the wavelength of incident solar radiation falls between 0.3 and 3 µm, which is significantly shorter than the wavelength of radiation emitted by most radiative surfaces. The collector absorbs the incoming solar radiation, converting it into thermal energy. This thermal energy is then transferred to a heat transfer fluid circulating within the collector. The heat transfer fluid can be air, water, oil, or a mixture including glycol (an antifreeze fluid), especially in forced circulation systems. Concentration systems may utilize phase change materials such as molten salts. The thermal energy of the heat transfer fluid can then be used directly or stored for later use.
The amount of heat delivered by a solar water heating system depends primarily on the amount of heat delivered by the sun at a particular place (insolation). In the tropics insolation can be relatively high, e.g. 7 kWh/m2 per day, versus e.g., 3.2 kWh/m2 per day in temperate areas. Even at the same latitude average insolation can vary a great deal from location to location due to differences in local weather patterns and the amount of overcast.
______
______
Various solar thermal technologies:
Solar thermal technologies can be used for water heating, space heating, space cooling and process heat generation.
-1. Solar water heating:
Solar water heating (SWH) is heating water by sunlight, using a solar thermal collector. A variety of configurations are available at varying cost to provide solutions in different climates and latitudes. SWHs are widely used for residential and some industrial applications. Solar hot water systems use sunlight to heat water. In middle geographical latitudes (between 40 degrees north and 40 degrees south), 60 to 70% of the domestic hot water use, with water temperatures up to 60 °C (140 °F), can be provided by solar heating systems. The most common types of solar water heaters are evacuated tube collectors (44%) and glazed flat plate collectors (34%) generally used for domestic hot water; and unglazed plastic collectors (21%) used mainly to heat swimming pools.
_
A Sun-facing collector heats a working fluid that passes into a storage system for later use. SWH are active (pumped) and passive (convection- driven). They use water only, or both water and a working fluid. They are heated directly or via light-concentrating mirrors. They operate independently or as hybrids with electric or gas heaters. As of 2017, global solar hot water (SHW) thermal capacity is 472 GW and the market is dominated by China, the United States and Turkey. Barbados, Austria, Cyprus, Israel and Greece are the leading countries by capacity per person.
_
Solar water heaters can be categorized into two main types: active and passive systems. In active solar water heaters, pumps or other mechanical means circulate the heated fluid from the solar collector to a storage tank. A study by Mazarrón et al. compared the performance of active solar water heating systems in different climatic conditions. The study found that active systems can achieve higher efficiencies and provide consistent hot water supply, making them suitable for various regions. The results showed that active solar water heating systems achieved efficiencies ranging from 60% to 70%, with higher values observed in regions with ample sunlight.
_
Passive solar water heaters, on the other hand, rely on natural convection and gravity to circulate the heated fluid. These systems are simpler in design and often used in areas with moderate climates. A study by Ozsoy et al. investigated the performance of a novel passive solar water heating system utilizing a double-glazed flat-plate collector. The study demonstrated the effectiveness of the passive system in providing hot water and highlighted its potential for energy savings and environmental benefits. The passive solar water heating system achieved efficiencies ranging from 50% to 60%, making it a viable option for regions with moderate sunlight.
_
Solar hot water systems capture energy from the sun to heat water for homes and businesses, thereby displacing the use of natural gas, or in some cases electricity, with free and limitless solar energy. Solar hot water could save California 1.2 billion therms of natural gas a year, the equivalent of 24 percent of all gas use in homes. To prevent global warming & pollution, reduce dependence on imported fuel, and ease the price of natural gas, we ought to jumpstart a mainstream market for solar hot water.
_____
-2. Solar Air Heaters:
Solar air heaters utilize solar collectors to heat air, which can be used for space heating or drying applications. These systems typically consist of a solar collector, an air circulation system, and a heat storage unit. A study by Kumar et al. investigated the performance of a solar air heating system with a fin-and-tube heat exchanger. The study analyzed the effects of design parameters on system performance and concluded that the system achieved a thermal efficiency of 60% and provided significant energy savings compared with conventional heating methods. El-Sebaii et al. investigated the performance of a solar air heating system with a double-pass air collector. The study demonstrated that the double-pass configuration increased the system’s thermal efficiency to 68% and improved heat transfer, making it suitable for space heating in residential buildings. In another study by Krishnananth et al., the performance of a solar air heater integrated with a heat storage system was evaluated. The study highlighted the potential of solar air heaters with heat storage for achieving continuous and efficient space heating, achieving a thermal efficiency of 80% and providing stable and reliable heat transfer.
_______
-3. Solar Heating, cooling and ventilation:
In the United States, heating, ventilation and air conditioning (HVAC) systems account for 30% (4.65 EJ/yr) of the energy used in commercial buildings and nearly 50% (10.1 EJ/yr) of the energy used in residential buildings. Solar heating, cooling and ventilation technologies can be used to offset a portion of this energy. Use of solar for heating can roughly be divided into passive solar concepts and active solar concepts, depending on whether active elements such as sun tracking and solar concentrator optics are used.
MIT’s Solar House 1, built in 1939 in the US, used seasonal thermal energy storage for year-round heating.
Thermal mass is any material that can be used to store heat—heat from the Sun in the case of solar energy. Common thermal mass materials include stone, cement, and water. Historically they have been used in arid climates or warm temperate regions to keep buildings cool by absorbing solar energy during the day and radiating stored heat to the cooler atmosphere at night. However, they can be used in cold temperate areas to maintain warmth as well. The size and placement of thermal mass depend on several factors such as climate, daylighting, and shading conditions. When duly incorporated, thermal mass maintains space temperatures in a comfortable range and reduces the need for auxiliary heating and cooling equipment.
A solar chimney (or thermal chimney, in this context) is a passive solar ventilation system composed of a vertical shaft connecting the interior and exterior of a building. As the chimney warms, the air inside is heated, causing an updraft that pulls air through the building. Performance can be improved by using glazing and thermal mass materials in a way that mimics greenhouses.
Deciduous trees and plants have been promoted as a means of controlling solar heating and cooling. When planted on the southern side of a building in the northern hemisphere or the northern side in the southern hemisphere, their leaves provide shade during the summer, while the bare limbs allow light to pass during the winter. Since bare, leafless trees shade 1/3 to 1/2 of incident solar radiation, there is a balance between the benefits of summer shading and the corresponding loss of winter heating. In climates with significant heating loads, deciduous trees should not be planted on the Equator-facing side of a building because they will interfere with winter solar availability. They can, however, be used on the east and west sides to provide a degree of summer shading without appreciably affecting winter solar gain.
_______
-4. Cooking:
Solar cookers use sunlight for cooking, drying, and pasteurization. They can be grouped into three broad categories: box cookers, panel cookers, and reflector cookers. The simplest solar cooker is the box cooker first built by Horace de Saussure in 1767. A basic box cooker consists of an insulated container with a transparent lid. It can be used effectively with partially overcast skies and will typically reach temperatures of 90–150 °C (194–302 °F). Panel cookers use a reflective panel to direct sunlight onto an insulated container and reach temperatures comparable to box cookers. Reflector cookers use various concentrating geometries (dish, trough, Fresnel mirrors) to focus light on a cooking container. These cookers reach temperatures of 315 °C (599 °F) and above but require direct light to function properly and must be repositioned to track the Sun.
______
-5. Process heat:
Process heat refers to the application of heat during industrial processes. Some form of process heat is used during the manufacture of many common products, from concrete to glass to steel to paper. Solar concentrating technologies such as parabolic dish, trough and Scheffler reflectors can provide process heat for commercial and industrial applications. The first commercial system was the Solar Total Energy Project (STEP) in Shenandoah, Georgia, US where a field of 114 parabolic dishes provided 50% of the process heating, air conditioning and electrical requirements for a clothing factory. This grid-connected cogeneration system provided 400 kW of electricity plus thermal energy in the form of 401 kW steam and 468 kW chilled water and had a one-hour peak load thermal storage.
Heat generated by CSP is sent to a thermochemical reactor which then uses it to make synthetic liquid fuels or syngas.
Evaporation ponds are shallow pools that concentrate dissolved solids through evaporation. The use of evaporation ponds to obtain salt from seawater is one of the oldest applications of solar energy. Modern uses include concentrating brine solutions used in leach mining and removing dissolved solids from waste streams.
Clothes lines, clotheshorses, and clothes racks dry clothes through evaporation by wind and sunlight without consuming electricity or gas. In some states of the United States legislation protects the “right to dry” clothes. Unglazed transpired collectors (UTC) are perforated sun-facing walls used for preheating ventilation air. UTCs can raise the incoming air temperature up to 22 °C (40 °F) and deliver outlet temperatures of 45–60 °C (113–140 °F). The short payback period of transpired collectors (3 to 12 years) makes them a more cost-effective alternative than glazed collection systems. As of 2003, over 80 systems with a combined collector area of 35,000 square metres (380,000 sq ft) had been installed worldwide, including an 860 m2 (9,300 sq ft) collector in Costa Rica used for drying coffee beans and a 1,300 m2 (14,000 sq ft) collector in Coimbatore, India, used for drying marigolds.
_____
-6. Water treatment:
Solar distillation can be used to make saline or brackish water potable. The first recorded instance of this was by 16th-century Arab alchemists. A large-scale solar distillation project was first constructed in 1872 in the Chilean mining town of Las Salinas. The plant, which had solar collection area of 4,700 m2 (51,000 sq ft), could produce up to 22,700 L (5,000 imp gal; 6,000 US gal) per day and operate for 40 years. Individual still designs include single-slope, double-slope (or greenhouse type), vertical, conical, inverted absorber, multi-wick, and multiple effect. These stills can operate in passive, active, or hybrid modes. Double-slope stills are the most economical for decentralized domestic purposes, while active multiple effect units are more suitable for large-scale applications.
Solar water disinfection (SODIS) involves exposing water-filled plastic polyethylene terephthalate (PET) bottles to sunlight for several hours. Exposure times vary depending on weather and climate from a minimum of six hours to two days during fully overcast conditions. It is recommended by the World Health Organization as a viable method for household water treatment and safe storage. Over two million people in developing countries use this method for their daily drinking water.
Solar energy may be used in a water stabilization pond to treat waste water without chemicals or electricity. A further environmental advantage is that algae grow in such ponds and consume carbon dioxide in photosynthesis, although algae may produce toxic chemicals that make the water unusable.
_____
-7. Solar assisted heat pump:
A heat pump is a device that consumes electricity to transfer heat from a cold heat sink to a hot heat sink. Specifically, the heat pump transfers thermal energy using a refrigeration cycle, cooling the cool space and warming the warm space. In cold weather, a heat pump can move heat from the cool outdoors to warm a house (e.g. winter); the pump may also be designed to move heat from the house to the warmer outdoors in warm weather (e.g. summer). As they transfer heat rather than generating heat, they are more energy-efficient than other ways of heating or cooling a home.
A solar assisted heat pump heats water by absorbing heat from direct sunlight and from the air. When the sun shines on an object, some of that light is absorbed and changed into heat. A solar assisted heat pump has a large, flat evaporator panel that absorbs the heat from sunlight falling directly onto it and from the air around the panel. This heat is absorbed into a fluid that passes through a heat exchanger into the heat pump. This raises the temperature and transfers that heat to your hot water cylinder. The hot water is then stored in a hot water cylinder, ready for when you need it. Solar assisted heat pumps can also work without direct sunlight. A solar assisted heat pump will reduce your hot water heating’s carbon emissions. This is because heat pump technology transfers energy from outside to heat your water. It uses electricity to do this, but it delivers more heat energy to your hot water than electrical energy it uses.
_____
-8. Solar updraft tower:
Solar updraft tower (SUT) is a design concept for a renewable-energy power plant for generating electricity from low temperature solar heat. Sunshine heats the air beneath a very wide greenhouse-like roofed collector structure surrounding the central base of a very tall chimney tower. The resulting convection causes a hot air updraft in the tower by the chimney effect. This airflow drives wind turbines, placed in the chimney updraft or around the chimney base, to produce electricity.
Figure below shows schematic presentation of a solar updraft tower:
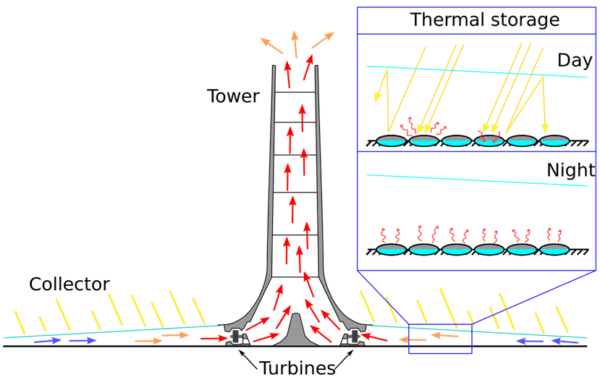
As of 2018, several prototype models have been built, but no full-scale practical units are in operation. Scaled-up versions of demonstration models are planned to generate significant power. Model calculations estimate that a 100 MW plant would require a 1,000 m tower and a greenhouse of 20 square kilometres (7.7 sq mi). A 200 MW tower of the same height would require a collector 7 kilometres in diameter (total area of about 38 km2 (15 sq mi)). Commercial investment may have been discouraged by the high initial cost of building a very large novel structure, the large land area required, and the risk of investment.
_____
-9. Solar Thermal Production of Chemicals:
Concentrated solar energy may be used for the processing of high-temperature and energy-intensive commodities. Examples are the following: (1) Syngas may be produced by solar reforming or solar gasification of fossil fuels. Syngas is the building block for a wide variety of synthetic fuels, including Fischer–Tropsch-type chemicals, hydrogen, ammonia, and methanol (which is a possible substitute for gasoline in vehicles). Solar syncrude include solar kerosene for aviation and solar gasoline and solar diesel for road transportation and shipping applications. (2) Biomass and other carbonaceous materials may be converted via different solar thermochemical routes into bio-oils, charcoal, and syngas (Lédé, 1999). A significant advantage of using biomass is that the process has a zero net release of CO2. (3) Fullerenes and carbon nanotubes can be produced by sublimation of C(graphite) above 3000 K or by catalytic thermal decomposition of hydrocarbons. (Guillard et al., 1999; Meier et al., 1999). (4) Metallic carbides and nitrides can be produced by the solar carbothermic reduction of metal oxides. These ceramics are valuable materials for high-temperature applications because of their high hardness, excellent corrosion resistance, high melting points, and low coefficients of thermal expansion. They may also be incorporated into cyclic processes; their hydrolysis yields hydrocarbons and ammonia (Murray et al., 1995). (5) Zinc, iron, magnesium, and other metals can be produced by the carbothermic reduction of their metal oxides. Aluminum–silicon alloys may be produced by the carbothermic reduction of Al2O3 and SiO2 at 2300 K, thus providing an alternative route to the Hall–Héroult electrolytic process (Murray, 1999). (6) Decomposition of limestone, the main endothermic step in the production of cement, may be effected using solar process heat at 1300 K.
_____
_____
Physics of Solar Concentration:
A solar concentrator at its core consists of a system of mirrors and an energy receiver. The mirrors are all oriented to reflect incoming sunlight toward the receiver. In doing so, the mirrors increase the amount of light, and thus the amount of energy, being sent to the receiver. As more energy is deposited to the receiver, it begins to heat up. This heat is used to power a heat engine, which extracts energy in the form of mechanical work, which can then be converted into electrical energy. This electrical energy can then be used or stored, completing the conversion from light to useful energy.
_
How does a solar concentrator work exactly?
First, let’s assume that the light from the sun carries with it a certain flux of energy, where flux just means that the light delivers some given amount of energy per unit time per unit area (the flux from the sun is about a kilowatt per square meter). For a given area, the sun delivers a certain amount of energy per unit time, and if we are able to double that area, then the amount of energy per unit time is itself doubled. Thus the goal of any solar power generator is to use as large of an area as possible, so that more energy can be produced.
_
For a solar concentrator, the collecting area is covered by mirrors which reflect sunlight from the full array into a much smaller receiver. Upon doing so, all the power incident on the full collecting area becomes sent to the receiver. So for an array of mirrors 100 square meters in size, roughly 100 kilowatts is sent to the receiver. The system of mirrors has concentrated the light, causing the flux of energy at the receiver to be significantly larger than the flux naturally incident upon the earth. If the receiver were 10 square meters, for example, then the flux of energy would be 10 kilowatts per square meter, a factor of 10 larger than it would be if unfocused. The ratio between the concentrated flux on the receiver and the ambient flux from the sun is called the concentration ratio (C). It is the same as the ratio of the area of the receiver to the total area of the reflectors (assuming the entirety of the receiver is illuminated). For the above concentrator, the concentration ratio is C=10.
_
Why is the concentration ratio an important metric of a solar concentrator?
Simply put, the concentration ratio is an important ingredient in optimizing the efficiency of a concentrated solar power plant. By increasing the concentration, more light is focused onto the same collecting area, which causes more energy to be deposited in the same amount of time. For a solar concentrator to be useful, it needs to be able to generate large amounts of power. By this metric, the concentration should be increased as much as possible.
_
An additional metric that should be considered in solar concentration is the temperature of the receiver. Because large amounts of energy are being deposited on the receiver fairly rapidly, the receiver heats up substantially. Water or a different fluid (like molten salt) is typically used to remove heat from the receiver, maintaining it at a stable temperature, and carrying the thermal energy to be used to power a heat engine. The amount of coolant being used to remove energy controls the temperature at which the receiver operates. This operating temperature also has an impact on the efficiency of a solar concentrator. This is due to energy losses because of thermal emission from the receiver. The physics principles here are straightforward. The receiver is approximately a blackbody (it is designed to be so that it absorbs light efficiently). Any blackbody loses energy by emitting blackbody radiation. The amount of energy lost due to blackbody radiation increases rapidly with temperature. Therefore, in order to minimize losses (and thus increase efficiency) it is advantageous to limit the operating temperature. This second metric would seemingly suggest that the ideal operating temperature would be as low as possible, because then energy losses in the receiver are minimized.
_
However, there is an additional source of wasted energy that must be examined: Energy lost as heat in the conversion to mechanical work. Carnot’s theorem states that the maximum efficiency of an engine (ηcarnot) is determined by the ratio of the high temperature of your receiver (TH) and the cold temperature of your heat sink (TC).
ηcarnot = 1 – TC/TH
The cold temperature of the heat sink is the ambient temperature of earth (which is roughly 300°K). Any receiver temperature less than this will produce no energy at all, and the efficiency would thus be 0. In order to maximize efficiency in the heat engine, the temperature must be much higher (if run at infinite temperature for example, the efficiency will be 1). Combining thermal losses from the receiver with the efficiency of the heat engine, it follows that we must run at some temperature sweet spot, between low and high. If we keep the temperature too high, then too much energy will be lost due to blackbody emission. If we run it too cold, then the efficiency of our heat engine goes to 0, negating any gain in efficiency due to minimizing blackbody radiation. Due to materials constraints, we are limited to a receiver temperature of roughly 900°K, which falls right into this sweet spot for concentrations of roughly 100.
_
Practical Considerations:
The above analysis focused exclusively on the physics involved and neglects a few practical considerations that can place additional limitations on solar concentration efficiency. These considerations come from the fact that thermodynamics is not the only constraint placed on a power plant: There are also optical, economic, and engineering constraints, as well as geographic constraints.
First, let’s consider additional Optics constraints. In order to design a solar concentration plant with a large efficiency, you need a plant with a large concentration. However, there is a theoretical limitation to how much you can concentrate the sun, which exists due to its apparent size on the sky. Weinstein et al. calculate this limit to be C=210 for a 1-axis concentrator (a parabolic trough), and C = 4.3 × 10⁴ for a 2-axis concentrator (an array of mirrors like that at Crescent Dunes). While this limit may be constraining for 1-axis concentrators, it doesn’t seem likely to be a significant constraint for 2-axis concentrators.
Second, let’s consider economic and materials constraints. All of the above assumed that all of the incident sunlight is reflected by the mirrors, and that it was all absorbed by the receivers. However, realistic mirrors do not reflect all of their light (some is absorbed, some passes through). So in reality, the light incident on the array is not all reflected to the receivers. Optimizing this problem becomes an economic problem, because while certain metals have very high reflectances, they can be more expensive than materials with lower reflectance. Cheap, reflective materials is an ongoing topic of research. Similarly, the receiver needs to absorb as efficiently as possible at optical wavelengths, while being cheap and emitting inefficiently in the infrared (which can help to further reduce thermal losses).
Additionally, producing a large concentration, and running the plant at a high temperature can become infeasible due to engineering constraints. Above a certain temperature the metals that you use become too hot, and can no longer be used to contain the steam necessary to power the plant. This temperature is in the neighborhood of 900°K. So all solar concentrators must run below this temperature in order to avoid the onset of “creep” in their systems, which would lead to mechanical malfunctions that would prevent the plant from operating. This constraint becomes the strongest limit on 2-axis concentrators, because they are easily able to achieve concentrations large enough to increase the temperature to these levels.
Finally, CSP plants are limited by geographic constraints. In particular they need to be built in places that receive a lot of sunlight, and ideally a lot of sunlight from a high elevation. Elevation in this sense just refers to the height of the sun in the sky. If the sun is at low elevation (i.e. near the horizon), then the size of the array perpendicular to the sun is reduced. This limits the total amount of power able to be gained from a station. This is why CSP stations such as Ivanpah are typically found in sunny locations relatively close to the tropics (Southern California in the case of Ivanpah). Photovoltaic plants also suffer from this limitation. Additionally, the air quality can affect the utility of CSP stations, because any airborne refraction can defocus the light, lowering the concentration. Therefore, CSP stations aren’t typically found in hazy places like the Persian gulf. Conventional photovoltaics do not suffer from this limitation, other than any attenuation of the light caused by the haze.
_____
_____
Technological Advancements in Solar Thermal Systems:
Technological advancement in solar thermal system includes Enhanced Heat Transfer Techniques, Advanced Materials for Heat Absorption and Storage, and Integration with Other Energy Systems (e.g., Combined Heat and Power). An overview of research findings obtained from diverse investigations utilizing various solar thermal systems are depicted in table below.
|
Sources |
Type of Solar Thermal System |
Output Efficiency |
Main Findings |
|
Mazarrón et al. |
Active Solar Water Heating Systems |
60% to 70% |
Active systems achieve higher efficiencies and consistent hot water supply, suitable for various regions. |
|
Ozsoy et al. |
Passive Solar Water Heating System |
50% to 60% |
Passive systems provide hot water with energy savings and environmental benefits, viable for moderate sunlight regions. |
|
Elsheniti et al. |
Solar Water Heating System |
65% to 72% |
Solar water heating systems achieve significant energy savings, reducing reliance on conventional energy sources for water heating. |
|
He et al. |
Solar Water Heating System |
70% to 85% |
Integration with a heat pump achieves higher energy efficiency and a consistent hot water supply, even under unfavorable weather conditions. |
|
Kumar et al. |
Solar Air Heating System |
60% |
A fin-and-tube heat exchanger achieves a thermal efficiency of 60%, with significant energy savings compared with conventional heating methods. |
|
El-Sebaii et al. |
Solar Air Heating System |
68% |
A double-pass air collector increases thermal efficiency and improves heat transfer, suitable for space heating in residential buildings. |
|
Krishnananth et al. |
Solar Air Heater |
80% |
A solar air heater integrated with heat storage achieves continuous and efficient space heating with stable and reliable heat transfer. |
|
Liu et al. |
Solar Power Tower System |
49.66% |
An sCO2 power tower system achieves higher thermal efficiency and cost competitiveness for large-scale solar power generation. |
|
Siva et al. |
Solar Concentrators and Power Towers |
N/A |
Achievements in thermal energy storage at temperatures above 1000 °C, enabling continuous and dispatchable solar power generation. |
|
Kumar et al. |
Solar Power Tower System |
$8.23/kg of H2 |
Solar power tower technology shows cost effectiveness and scalability for large-scale hydrogen production in India. |
|
Wang et al. |
Nanofluids in Solar Thermal Systems |
18.7% enhancement |
Nanofluids significantly improve heat transfer performance in solar thermal collectors. |
|
Pu et al. |
Microchannel Heat Exchangers |
1.86 times |
Microchannel heat exchangers improve heat transfer and energy efficiency for solar air heating applications. |
|
Basbous et al. |
Nanofluids in Solar Thermal Systems |
43.5% enhancement |
Copper oxide nanofluids significantly improve the heat transfer coefficient and overall thermal performance in solar collectors. |
|
Nguyen et al. |
Micro-structured Surfaces |
42% enhancement |
Micro-structured surfaces significantly enhance heat transfer by promoting turbulence and increasing the effective surface area for heat exchange. |
|
Selvakumar et al. |
Selective Solar Absorber Coating |
95% solar absorptance, 10% thermal emittance |
Carbon-nanotube-based coating exhibits high solar absorptance and low thermal emittance, enabling efficient solar energy absorption and minimizing thermal radiation losses. |
|
Elsanusi et al. |
PCM-based Heat Exchangers |
25% efficiency improvement |
PCM-based storage improves overall system efficiency and reduces energy losses during storage and retrieval. |
|
Mazman et al. |
PCMs in Solar Thermal Systems |
70% energy storage increase |
PCMs enhance energy storage capacity, improve system efficiency, and facilitate utilization of solar energy during non-sunlight hours. |
|
Liu et al. |
Composite Materials in Solar Absorbers |
92% solar absorptance |
Composite-material-based solar absorbers significantly enhance solar absorption and thermal conductivity. |
|
Razmi et al. |
Solar Thermal Biomass-Based CHP |
78.5% overall energy conversion efficiency |
A hybrid system achieves higher overall energy conversion efficiency and reduces greenhouse gas emissions. |
|
Chen et al. |
Solar Thermal Industrial CHP |
15% overall energy efficiency increase |
Integration of solar thermal collectors with CHP units increases overall energy efficiency and provides a more reliable energy supply for industrial processes. |
|
Corbin et al. |
Solar Thermal and PVT Collectors |
66% thermal efficiency, 16% electrical efficiency |
Hybrid PVT systems demonstrate improved energy utilization and are a promising option for sustainable energy generation |
PCM = Phase Change Materials
______
______
Section-8
Solar photovoltaic technologies:
A photovoltaic (PV) cell, commonly called a solar cell, is a nonmechanical device that converts sunlight directly into electricity. Some PV cells can convert artificial light into electricity. This is photons to electrons transfer of energy as solar radiation photons dislodges an electron from the atoms of recipient object to generate electric current i.e. electricity. Photovoltaic panels are installed for the conversion of solar radiation energy into electricity, while solar thermal panels convert solar radiation energy into heat. That is why these solutions do not compete with each other. Instead, they may complement each other. In fact upon solar irradiation, PV panel generate electricity and also heats up. Not all photons generate electricity, some generate electricity, some heat and some reflected.
_
Photovoltaic Solar Panels: Converting Photon energy to Electron movement:
The solar panels that you see on rooftops are also called photovoltaic (PV) panels, or photovoltaic cells, which as the name implies (photo meaning “light” and voltaic meaning “electricity”), convert sunlight directly into electricity. A module is a group of panels connected electrically and packaged into a frame (more commonly known as a solar panel), which can then be grouped into larger solar arrays.
Solar panels are “first cousins” to the chips inside computers or cell phones. The technology used to make solar panels is similar to making computer chips. Both use a class of material called semiconductors — materials that have a limited ability to conduct an electric current. Silicon is a semiconductor which is currently used to make photovoltaic cells as well as computer chips. Basically, when light strikes the panel, a certain portion of it is absorbed by the semiconductor material. This means that the energy of the absorbed light is transferred to the semiconductor. The energy knocks electrons loose, allowing them to flow freely.
PV solar panels work with one or more electric fields that force electrons freed by light absorption to flow in a certain direction. This flow of electrons is a current, and by placing metal contacts on the top and bottom of the PV cell, we can draw that current off for external use. This current, together with the cell’s voltage (which is a result of its built-in electric field or fields), defines the power (or wattage) that the solar cell can produce.
That’s the basic process, but there’s really much more to it. Now, let’s take a deeper look into one example of a PV panel: the single-crystal silicon panel.
_
How Silicon makes Solar Panels:
Let’s start with basics:
An atom is consisting of a nucleus and electrons orbiting the nucleus. The electrons cannot orbit the nucleus at any distance in the atomic space surrounding the nucleus, but only certain, very specific orbits are allowed, and only exist in specific discrete levels. These energies are called energy levels. Electrons arrange themselves in layers called shells inside an atom. The outermost shell in the atom is known as a valence shell. The electrons in this valence shell are the ones that form bonds with neighboring atoms. Such bonds are called covalent bonds. Most conductors have just one electron in the valence shell. Semiconductors, on the other hand, typically have four electrons in their valence shell. However, if atoms nearby are made of the same valence, electrons may bind with the valence electrons of other atoms. Whenever that happens, atoms organize themselves into crystal structures. We make most semiconductors with silicon crystals. A large number of atoms gather to form a crystal, and interacts in a solid material, then the energy levels became so closely spaced that they form bands. This is the energy band. Metals, semiconductors and insulators are distinguished from each other by their band structures.
_
Electrons occupy the lowest energy levels first. In semiconductors and insulators, almost all the states in the lowest energy bands are filled by electrons, whereas the energy states in the higher energy bands are usually empty. The lower energy bands with mostly filled energy states are called the valence bands. The higher energy bands with mostly empty energy states are called conduction bands. The difference between the highest valence band and the lowest conduction band is called the energy band gap or the energy gap. An electron in a valence band needs the energy equal to or higher than the energy gap to experience a transition from the valence to the conduction band.
_
The valence band is the band of electron orbitals that electrons can jump out of, moving into the conduction band when excited. The valence band is simply the outermost electron orbital of an atom of any specific material that electrons actually occupy. Conduction band is the outermost electrons that are not tightly held to the nucleus due to which sometimes they leave the outermost orbit at room temperature and become free electrons. These free electrons tend to conduct current in conductors and this is the reason they are known as conduction electrons.
_
The energy difference between the highest occupied energy state of the valence band and the lowest unoccupied state of the conduction band is called the band gap and is indicative of the electrical conductivity of a material. A large band gap means that a lot of energy is required to excite valence electrons to the conduction band. Conversely, when the valence band and conduction band overlap as they do in metals, electrons can readily jump between the two bands meaning the material is highly conductive.
In insulator, the energy gap or bandgap is large so that the valence bands are completely filled and conduction bands are totally devoid of electrons. Typically for insulator, bandgap is larger than 5 to 6 eV. The bandgap of diamond, a good crystalline insulator, is 5.5 eV. For semiconductors, energy bandgaps vary between 0.1 eV and 3.5 eV. The energy bandgap of silicon (Si), which is the most important semiconductor material, is approximately 1.12 eV at room temperature. The energy bandgap of silicon dioxide—the most widely used insulator material in microelectronics—is 9 eV. In a conductor, valence band and conduction band overlap each other and therefore there is no energy/forbidden/band gap in a conductor.
_
Indirect vs direct bandgap:
If the momentum of the lowest energy state in the conduction band and the highest energy state of the valence band of a material have the same value, then the material has a direct bandgap. If they are not the same, then the material has an indirect band gap and the electronic transition must undergo momentum transfer to satisfy conservation. Such indirect “forbidden” transitions still occur, however at very low probabilities and weaker energy. For materials with a direct band gap, valence electrons can be directly excited into the conduction band by a photon whose energy is larger than the bandgap. In contrast, for materials with an indirect band gap, a photon and phonon must both be involved in a transition from the valence band top to the conduction band bottom, involving a momentum change. A phonon is a definite discrete unit or quantum of vibrational mechanical energy, just as a photon is a quantum of electromagnetic or light energy. Therefore, direct bandgap materials tend to have stronger light emission and absorption properties and tend to be better suited for photovoltaics (PVs), light-emitting diodes (LEDs), and laser diodes; however, indirect bandgap materials are frequently used in PVs and LEDs when the materials have other favorable properties. Examples of direct bandgap materials include hydrogenated amorphous silicon and some III–V materials such as InAs and GaAs. Indirect bandgap materials include crystalline silicon and Ge. Some III–V materials are indirect bandgap as well, for example AlSb.
Light with a photon energy close to the band gap can penetrate much farther before being absorbed in an indirect band gap material than a direct band gap one (at least insofar as the light absorption is due to exciting electrons across the band gap). This fact is very important for photovoltaics (solar cells). Crystalline silicon is the most common solar-cell substrate material, despite the fact that it is indirect-gap and therefore does not absorb light very well. As such, they are typically hundreds of microns thick; thinner wafers would allow much of the light (particularly in longer wavelengths) to simply pass through. By comparison, thin-film solar cells are made of direct band gap materials (such as amorphous silicon, CdTe, CIGS or CZTS), which absorb the light in a much thinner region, and consequently can be made with a very thin active layer (often less than 1 micron thick). The absorption spectrum of an indirect band gap material usually depends more on temperature than that of a direct material. Photovoltaic materials with direct band gap transitions absorb light more readily than those with indirect gaps, allowing for thinner devices. However, direct bands also suffer faster rates of radiative recombination than indirect bandgap materials.
_
Silicon has special chemical properties, especially in its crystalline form. An atom of silicon has 14 electrons, arranged in three different shells. The first two shells — which hold two and eight electrons respectively — are completely full. The outer shell, however, is only half full, with just four electrons. A silicon atom will always look for ways to fill up its last shell, and to do this, it will share electrons with four nearby atoms. It’s like each atom holds hands with its neighbors, except that in this case, each atom has four hands joined to four neighbors. That’s what forms the crystalline structure, and that structure turns out to be important to this type of PV cell. The only problem is that pure crystalline silicon is a poor conductor of electricity because none of its electrons are free to move about, unlike the electrons in more optimum conductors like copper.
To address this issue, the silicon in a solar cell has impurities — other atoms purposefully mixed in with the silicon atoms — which changes the way things work a bit. We usually think of impurities as something undesirable, but in this case, the cell wouldn’t work without them. Consider silicon with an atom of phosphorus here and there, maybe one for every million silicon atoms. Phosphorus has five electrons in its outer shell, not four. It still bonds with its silicon neighbor atoms, but in a sense, the phosphorus has one electron that doesn’t have anyone to hold hands with. It doesn’t form part of a bond, but there is a positive proton in the phosphorus nucleus holding it in place.
_
When energy is added to pure silicon, in the form of heat for example, it can cause a few electrons to break free of their bonds and leave their atoms. A hole is left behind in each case. These electrons, called free carriers, then wander randomly around the crystalline lattice looking for another hole to fall into and carrying an electrical current. However, there are so few of them in pure silicon that they aren’t very useful.
But the impure silicon with phosphorus atoms mixed in is a different story. It takes a lot less energy to knock loose one of the “extra” phosphorus electrons because they aren’t tied up in a bond with any neighboring atoms. As a result, most of these electrons do break free, and there are a lot more free carriers than there would be in pure silicon.
The process of adding impurities on purpose is called doping, and when doped with phosphorus, the resulting silicon is called N-type (“n” for negative) because of the prevalence of free electrons. N-type doped silicon is a much better conductor than pure silicon.
The other part of a typical solar cell is doped with the element boron, which has only three electrons in its outer shell instead of four, to become P-type silicon. This means that instead of making four bonds of shared pairs of electrons with other silicon atoms, there is one open “hole.” Instead of having free electrons, P-type (“p” for positive) has free openings and carries the opposite (positive) charge. P-type silicon is silicon doped with boron that turns it into a conductive material that readily accepts electrons when voltage is applied.
_
Anatomy of a Solar Panel:
Until now, these two separate pieces of silicon were electrically neutral; the interesting part begins when you put them together. That’s because without an electric field, the cell wouldn’t work; the field forms when the N-type and P-type silicon come into contact. A solar cell consists of a layer of p-type silicon placed next to a layer of n-type silicon. A solar cell (also known as a photovoltaic cell or PV cell) is an electrical device that uses the photovoltaic effect to convert light energy into electrical energy. A solar cell is a p-n junction diode in its most basic form. Solar cells are a type of photoelectric cell, which is defined as a device whose electrical properties such as current, voltage, or resistance, change when exposed to light. Solar cells can be connected to form modules, which are generally referred to as solar panels. The maximum open-circuit voltage of a standard single junction silicon solar cell is around 0.5 to 0.6 volts. This isn’t much on its own, but keep in mind that these solar cells are tiny. Remember single solar cell produces an open-circuit voltage or electrical potential of approximately 0.5 to 0.6 volts. The voltage of a cell (10 cm x 10 cm) under load is approximately 0.46 volts, generating a current of about 3 amperes. The power that one cell produces is, in other words, approximately 1.38 watts (voltage multiplied by current). As an individual solar cell only generates a low voltage, approx. 0.5V – 0.6V; a number of cells are wired together to form a solar panel or ‘module’ that can generate anything between 80–360 watts. Typically 60 cells or 72 cells are combined into a single module. Solar panels are strung together in an array, which forms your solar system. Significant amounts of renewable energy can be generated when solar panels are merged into a huge solar panel.
In terms of the voltage required by solar panels to charge batteries, manufactured panels can charge 12 volt or 24-volt batteries as a rule of thumb. For example, a standard panel consisting of 36 crystalline silicon cells will give a peak open-circuit voltage output (Voc) of approximately 18 to 21 volts, which on load will reduce to about 12-14 volts, enough to charge a 12-volt battery. You should also consider that the battery charged by the panel(s) will link to an inverter that converts the DC voltage to AC voltage (e.g., 12 volts DC to 120 volts AC).
_
Construction of Solar Cell:
A solar cell is essentially a junction diode, though its construction differs slightly from that of standard p-n junction diodes. On a thicker p-type semiconductor, a very thin layer of n-type semiconductor is developed. On top of the n-type semiconductor layer, we place a few finer electrodes. The thin n-type layer is not obstructed by these electrodes. A p-n junction exists just under the n-type layer. A current-collecting electrode is also provided at the bottom of the p-type layer. To protect the solar cell from mechanical shock, we encase the complete unit in thin glass.
In the n-type layer, there is an excess of electrons, and in the p-type layer, there is an excess of positively charged holes (which are vacancies due to the lack of valence electrons). Near the junction of the two layers, the electrons on one side of the junction (n-type layer) move into the holes on the other side of the junction (p-type layer). This creates an area around the p-n junction, called the depletion zone, in which the electrons fill the holes. When all the holes are filled with electrons in the depletion zone, the p-type side of the depletion zone (where holes were initially present) now contains negatively charged ions, and the n-type side of the depletion zone (where electrons were present) now contains positively charged ions. The presence of these oppositely charged ions creates an internal electric field that prevents electrons in the n-type layer to fill holes in the p-type layer as seen in the figure below.
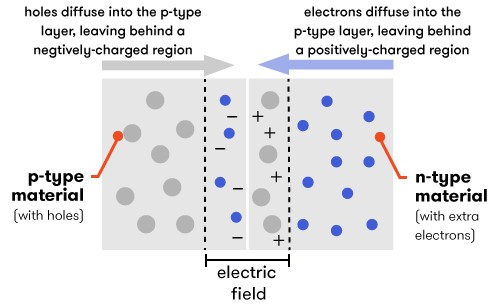
Figure above shows that holes diffuse into the n-type layer, and electrons diffuse into the p-type layer. This creates an electric field at the junction of the two layers.
_
Working Principle of Solar Cell:
When light reaches the p-n junction, photons can readily pass through the thin n-type layer and into the junction. The particles in light energy supply the junction with enough energy to build a number of electron-hole pairs. Under illumination, electron-holes pairs are generated and due to local electrical field forces (p-n junction field), holes and electrons go to opposite sides. It is this electrical field that separate electron from holes, leading to a positive potential difference (voltage) from the p to the n side of the junction. That voltage is observed even when the junction is not connected to any other electrical circuit (null current), being known as open circuit voltage 𝑉oc. In the same way, if a short-circuit is established between both semiconductor terminals (null voltage), carriers will follow through it, from n to p region.
The p-n junction will function like a tiny battery cell when the concentration of electrons increases on one side, i.e., the n-type side of the junction, and the concentration of holes increases on the other side, i.e., the p-type side of the junction. A voltage is established, which is referred to as photovoltage. If you connect the n-type and p-type layers with a metallic wire, the electrons will travel from the n-type layer to the p-type layer by crossing the depletion zone and then go through the external wire back of the n-type layer, creating a flow of electricity. PV modules are generally made by connecting several individual solar panels together to achieve useful levels of voltage and current, and putting them in a sturdy frame complete with positive and negative terminals.
_
The Sun emits a spectrum of radiation, ranging from around 300 nanometres to 2,000 nanometres, but by far the majority of it is within the range of 420 to 700 nanometres. Most solar panels are made of crystalline silicon. It can absorb light in the visible-light spectrum, from 400 nm (violet) to 700 nm (red). This is where high-energy photons are found. Capturing this light well boosts the solar panel’s efficiency. Besides visible light, solar panels can also collect some infrared and ultraviolet light. Because of its design, crystalline silicon can’t capture all of these wavelengths. Yet it can still get some of the infrared and ultraviolet light. This extra ability improves how well solar panels work.
_
When photons are incident on a conducting material, they collide with the electrons in the individual atoms. If the photons have enough energy, they knock out the electrons in the outermost shells. These electrons are then free to circulate through the material. Depending on the energy of the incident photons, they may be ejected from the material altogether.
According to Planck’s law, the energy of the incident photons is inversely proportional to their wavelength. Short-wavelength radiation occupies the violet end of the spectrum and includes ultraviolet radiation and gamma rays. On the other hand, long-wavelength radiation occupies the red end and includes infrared radiation, microwaves and radio waves.
Sunlight contains an entire spectrum of radiation, but only light with a short enough wavelength will produce the photoelectric or photovoltaic effects. This means that a part of the solar spectrum is useful for generating electricity. It doesn’t matter how bright or dim the light is. It just has to have – at a minimum – the solar cell wavelength. High-energy ultraviolet radiation can penetrate clouds, which means that solar cells should function on cloudy days – and they do.
_
Band Gap:
A photon must have a minimum energy value to excite electrons enough to knock them from their orbitals and allow them to move freely. In a photovoltaic cell, two different semiconducting materials are fused to create what physicists call a PN-junction. In practice, it’s common to use a single material, such as silicon, and to dope it with different chemicals to create this junction. For example, doping silicon with phosphorus creates an N-type semiconductor, and doping with boron makes a P-type semiconductor. Electrons knocked out of their orbits collect near the PN-junction and increase the voltage across it. The threshold energy to knock an electron out of its orbit and into the conduction band is known as the band gap.
_
When electrons are hit with particles of light, called photons, they can absorb enough energy to jump from the low-energy valence band into the high-energy conduction band. Once in the conduction band, the extra energy in the electron can be harvested as electricity. It’s as if the electrons are sitting at the bottom of a hill (the valence band) and being hit by a photon that gives them the energy to leap to the top (the conduction band). The amount of energy needed for electrons to jump into the conduction band depends on the type of material. Essentially, the size of the metaphorical hill varies based on the properties of a given material. The size of this energy gap matters because it impacts how efficiently solar cells convert light into electricity. Specifically, if photons hit the electrons with less energy than the electron needs to jump from the valence band to the conduction band, none of the light’s energy is captured. Alternatively, if the light has more energy than is needed to overcome that gap, then the electron captures the precise energy it needs and wastes the remainder. Both of these scenarios lead to inefficiencies in solar harvesting, making the choice of solar cell material an important one.
_
Minimum and Maximum Wavelengths:
For a voltage to develop across the PN-junction of a solar cell. the incident radiation must exceed the band gap energy. This is different for different materials. It is 1.12 electron volts for silicon, which is the material used most often for solar cells. One electron volt = 1.6 × 10^-19 joules, so the band gap energy is 1.79 × 10^-19 joules for silicon.
The equation that defines Planck’s constant is called the Planck-Einstein relation, and it looks like this:
E = hv.
Here, E is the energy of each packet (or ‘quanta’) of light, measured in Joules; v is the frequency of light, measured in hertz; and h is of course Planck’s constant.
Wavelength is related to energy and frequency.
E = hν = hc/λ, where E = energy, h = Planck’s constant, ν = frequency, c = the speed of light, and λ = wavelength.
Rearranging Plank’s equation and solving for wavelength tells you the wavelength of light that corresponds to this bandgap energy of silicon:
λ = hc/E = 1,110 nanometers=1.11×10^−6 meters
For (multi)crystalline silicon ((m)c-Si) solar cells λ opt = 1100 nm (with bandgap = 1.12 eV); for amorphous silicon (a-Si:H) the optimum wavelength is λ opt = 700 nm (with bandgap = 1.77 eV). However, as these cells only contain a thin absorber layer, the optimum spectrum response occurs at about 550 nm (Schropp and Zeman 1998, Van Sark 2002).
The wavelengths of visible light occur between 400 and 700 nm, so the bandwidth wavelength for crystalline silicon solar cells is in the very near infrared range. Any radiation with a longer wavelength, such as microwaves and radio waves, lacks the energy to produce electricity from a solar cell.
Any photon with a energy greater than 1.12 eV can dislodge an electron from a silicon atom and send it into the conduction band. In practice, however, very short wavelength photons (with an energy of more than about 3 eV) send electrons clear out of the conduction band and render them unavailable to do work. The upper wavelength threshold to get useful work from the photoelectric effect in solar panels depends on the structure of the solar cell, the materials used in its construction and the circuit characteristics.
_
Spectral mismatch correction:
One major problem encountered when trying to increase the conversion efficiency lies in the spectral mismatch between the absorption spectrum of the semiconductor and the solar emission spectrum. As a remedy, wavelength-converting materials are being developed and because solar cells perform best in a relatively narrow spectral range which depends on their bandgap energy, lanthanide luminescent divalent and trivalent ions are particularly well suited for this purpose. In addition, nonluminescent ions feature special crystallographic and conduction properties which make them invaluable in lattice-matched multijunction devices.
______
Energy loss in a Solar Panel:
Light can be separated into different wavelengths, which we can see in the form of a rainbow. Since the light that hits solar cell has photons of a wide range of energies, it turns out that some of them won’t have enough energy to alter an electron-hole pair. They’ll simply pass through the cell as if it were transparent. Still other photons have too much energy. Only a certain amount of energy, measured in electron volts (eV) and defined by cell material (about 1.12 eV for crystalline silicon), is required to knock an electron loose. This is called the band gap energy of a material. If a photon has more energy than the required amount, then the extra energy is lost. (That is, unless a photon has twice the required energy, and can create more than one electron-hole pair, but this effect is not significant.) These two effects alone can account for the loss of about 70 percent of the radiation energy incident on the cell. In short, PV cells are sensitive to light from the entire spectrum as long as the wavelength is above the band gap of the material used for the cell, but extremely short wavelength light is wasted. This is one of the factors that affects solar cell efficiency.
_
Why can’t we choose a material with a really low band gap, so we can use more of the photons? Unfortunately, band gap also determines the strength (voltage) of the electric field, and if it’s too low, then what we make up in extra current (by absorbing more photons), we lose by having a small voltage. Remember that power is voltage times current. The optimal band gap, balancing these two effects, is around 1.4 eV for a cell made from a single material. Crystallin silicon had bandgap of 1.12 eV close to optimal 1.4 eV, and silicon is cheap and abundant. Gallium arsenide (GaAs) has a band gap of 1.42 eV, close to the value giving peak solar cell efficiency. Gallium arsenide is more costly than silicon since GaAs are much rarer and harder to get.
_
There are other losses as well. Electrons have to flow from one side of the cell to the other through an external circuit. We can cover the bottom with a metal, allowing for good conduction, but if we completely cover the top, then photons can’t get through the opaque conductor and we lose all of the current (in some solar panels, transparent conductors are used on the top surface, but not in all). If we put contacts only at the sides of our cell, then the electrons have to travel an extremely long distance to reach the contacts.
Remember, silicon is a semiconductor — it’s not nearly as good as a metal for transporting current. Its internal resistance (called series resistance) is fairly high, and high resistance means high losses. To minimize these losses, cells are typically covered by a metallic contact grid that shortens the distance that electrons have to travel while covering only a small part of the cell surface. Even so, some photons are blocked by the grid, which can’t be too small or else its own resistance will be too high.
Another issue is the thickness of the semiconducting material. If photons have to travel a long way through the material, they lose energy through collisions with other particles and may not have enough energy to dislodge an electron.
Another factor affecting efficiency is the reflectivity of the solar cell. A certain fraction of incident light bounces off the surface of the cell without encountering an electron. To reduce losses from reflectivity and increase efficiency, solar cell manufacturers usually coat the cells with a nonreflective, light-absorbing material to prevent useful light from being reflected back into space without ever hitting an electron in the solar cell. This is why solar cells are usually black. Likewise, putting a reflector on the back of the solar cell also allows more light to be harvested. The light that reaches the solar cell and makes it all the way through to the back without hitting an electron gets bounced to the front of the cell, giving the cell another chance of collecting the light.
In addition to decreasing material costs, clever engineering tricks are pushing the efficiency of silicon solar cells closer to their theoretical maximum. In order for photons to be converted into energy, they must first collide with an electron. One trick to increase the likelihood of a photon-electron collision involves patterning the silicon in solar cells in microscopic pyramid shapes. When light is absorbed into a pyramid, it travels further, increasing the probability that the light will collide with the electrons in the silicon before escaping the cell.
_
Unfortunately, the process for converting solar light into usable power is not perfect. As of 2023, commercially available solar panels have less than 30 percent efficiency, meaning two-thirds of the potential concentrated solar power is wasted. In lab settings, some researchers have been able to reach 47 percent efficiency, but they were using a directed light beam that is several times more powerful than our ambient outdoor sunlight.
As of yet, the only practical solution to this efficiency problem is to install more solar panels over larger areas, but this greatly increases the cost of creating a solar farm in both real estate and natural resources. From a monetary standpoint, solar used to be one of the most expensive power sources to build in comparison with the energy collected. However, prices have trended downward in recent years, and brought photovoltaics more in line with the cost of wind turbine construction.
______
______
Classification and evolution of PV Technologies:
Most solar modules are currently produced from crystalline silicon (c-Si) solar cells made of polycrystalline or monocrystalline silicon. In 2021, crystalline silicon accounted for 95% of worldwide PV production, while the rest of the overall market is made up of thin-film technologies using cadmium telluride (CdTe), copper indium gallium selenide (CIGS) and amorphous silicon (a-Si).
Emerging, third-generation solar technologies use advanced thin-film cells. They produce a relatively high-efficiency conversion for a lower cost compared with other solar technologies. Also, high-cost, high-efficiency, and close-packed rectangular multi-junction (MJ) cells are usually used in solar panels on spacecraft, as they offer the highest ratio of generated power per kilogram lifted into space. MJ-cells are compound semiconductors and made of gallium arsenide (GaAs) and other semiconductor materials. Another emerging PV technology using MJ-cells is concentrator photovoltaics (CPV).
_
The evolution of PV technologies can be classified into three generations based on the materials used, production methods, and aims to address various challenges and opportunities within the evolving landscape of solar energy.
The first generation of PV cells, characterized by their use of crystalline silicon as the primary material, established the foundation of solar energy conversion.
The second generation introduced thin-film technologies, incorporating materials like amorphous silicon, cadmium telluride, and copper indium gallium selenide.
The third generation encompasses emerging technologies, such as organic and dye-sensitized solar cells, aiming to enhance efficiency, lower manufacturing costs, and introduce novel form factors.
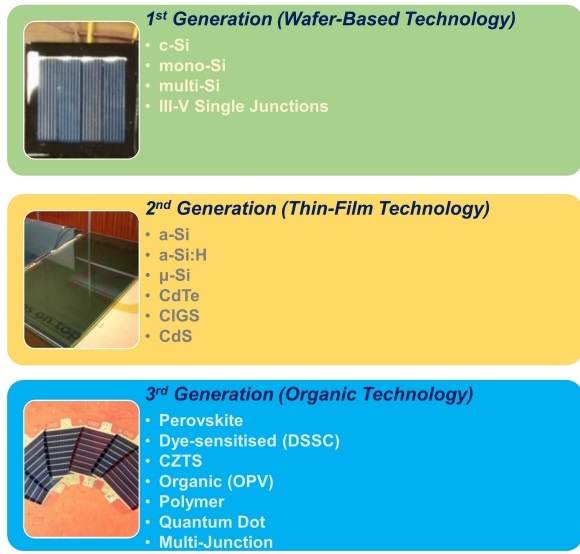
Figure above shows categorisation of photovoltaic generations.
_
First-generation PV cells:
First-generation PV cells, predominantly based on crystalline silicon, marked the early stage of PV technology development. Silicon is one of the base materials of the first generation solar cells. Two key factors that contribute for this supremacy is the attractive bandgap energy of Silicon, at 1.12 eV and the abundance of high-quality material, due to an already scaled silicon-based semiconductor production for microchips. Crystalline silicon cells, either monocrystalline or polycrystalline, exhibited relatively high energy conversion efficiencies but involved expensive manufacturing processes and required thick silicon wafers. These cells served as the foundation for the growth of the PV industry and set the stage for subsequent advancements. Crystalline silicon-based PV cells have been extensively studied and optimized over the years.
_
In photovoltaic design, the bandgap of the semiconductor absorber defines a range where the material is efficient at converting the incident photons into charge carries. This, in combination with the Sun’s emission spectrum determines a range for semiconductor bandgap energies if a good conversion efficiency is to be expected. In homojunction devices, this range corresponds to 1.1 eV to 1.7 eV. Silicon, with 1.12 eV is not at the maximum of around 1.4 eV, but within this range. Yet, its efficiency is diminished due to Auger recombination. Recombination is the opposite process of generation, and involves the annihilation of an electron-hole pair. Recombination is classified as either intrinsic or extrinsic, whereby intrinsic recombination processed in silicon are radiative and Auger recombination, and extrinsic recombination is recombination via defects — commonly referred to as Shockley Read Hall (SRH, also referred to as trap-assisted) recombination. Auger recombination is a non-radiative process where the energy of the photogenerated carrier is dissipated not by photon emission, but rather by increasing the kinetic energy of another free carrier. Auger recombination is the prevalent intrinsic recombination process in silicon. Auger recombination limits the lifetime and ultimate efficiency. So another semiconductor with a higher bandgap value would be preferable for photovoltaic energy conversion. Here is where the microchip industry had a big part in determining the future of photovoltaic cells. With an already scaled production of high-grade silicon wafers, the cost of silicon was more advantageous than developing a dedicated semiconductor production for photovoltaic cells even if Silicon characteristics were not the ideal. Moreover, wafers of lower grade Silicon, that could not be used for integrated circuits, could be purchased at lower cost by the photovoltaic industry. So semiconductors with more attractive attributes, for example GaAs, were limited to applications where specific qualities were of greater importance than cost, as in space, for power sources of satellites.
_
Since its appearance, crystalline Silicon (c-Si) photovoltaic cells have increased in efficiency 20.1%, from 6% when they were first discovered to the present efficiency record of 26.1%. The advances in semiconductor production, needed to increase computing power of microprocessors, had a direct impact in increasing photovoltaic conversion efficiency, as bulk defects were progressively eliminated in wafers. However, good bulk quality is just one requirement for high efficiency cells, there are other factors that limit module efficiency, so other type of fabrication breakthroughs are also credited for the increase in efficiency over the years. Notable breakthroughs were, at wafer processing, multi-wire sawing that allowed for a reduction in material lost, decreasing the overall cost of the cell. Block casting that, even though it results in lower grade wafers of polycrystalline silicon, is cheaper to produce and assemble into modules. Surface texturing, of the top and bottom surfaces to reduce reflection. The introduction of an aluminium back surface (Al-BSF) to decrease rear surface recombination velocity. Additionally, the development of passivated emitter and rear cell (PERC), to further reduce rear surface recombination velocity.
_
Currently, crystalline silicon cells are responsible for 95% of the global photovoltaic energy production, so their prevalence is clear. However, with the demonstrated increase in efficiency of thin film solar cells, closely matching c-Si with the added benefit of reduced semiconductor costs, this figure is expected to change. Moreover, complex architectures based on heterojunctions have already surpassed c-Si homojunction efficiency records, and assuming a reduction in production cost as the technology and related processes get more streamlined, they could play an important role in the future of photovoltaics.
_
Monocrystalline vs polycrystalline silicon cells:
The term “single crystal panel” is also used to describe monocrystalline solar panels. They are constructed from pure silicon crystals divided into many wafers, which make up the cells. Since they are comprised of only silicon, they can be recognized by their distinctive black or dark blue color. Monocrystalline solar panels generate more kW/hour of electricity due to their better conversion efficiency. They have greater room for the electrons to flow because they are made of a single silicon crystal. Compared to other panels, monocrystalline panels have stronger heat resistance, indicating that the heat has less of an impact on their ability to create electricity and that they do so more efficiently in hotter environments. The production of single-crystal silicon cells is a complicated process. Hence monocrystalline panels are more expensive than conventional panels.
There are several silicon crystals included in polycrystalline solar panels. They are produced using broken pieces of silicon that are heated and then poured into square molds. A polycrystalline solar panel is made from these crystals once they have cooled and then cut into thin wafers and assembled. Polycrystalline solar panels are less efficient than monocrystalline ones because there is less space for electrons to flow because they are made up of many silicon crystals. The cells’ square shape and gleaming blue color with straight edges serve as telltale signs that a panel is polycrystalline. The production method for these panels is easier, and less silicon is wasted during the entire process, making them more economical than monocrystalline solar panels.
_
Numerous researchers have undertaken efforts to enhance the efficiency of monocrystalline silicon cells. One such approach involves employing passivated emitter rear contact (PERC) technology. This technique entails passivating the rear surface of the solar cell to reduce the recombination of charge carriers and improve overall efficiency. This approach enhances light capture and helps achieve higher conversion efficiency. Another avenue of advancement is the utilization of bifacial solar cells. These specialized cells can capture sunlight from both the front and rear sides, utilizing reflected and diffuse light from surrounding surfaces. This can lead to increased energy production and higher efficiencies. Additionally, researchers like Uzu et al. used multi-junction solar cells by stacking multiple layers of different semiconductor materials on top of each other. Each layer absorbed a different portion of the solar spectrum, increasing the overall efficiency of light absorption and energy conversion.
_
Second-generation PV cells:
A good metric to maintain in photovoltaic module production is that the overall cost of the module is half of its installation cost, and that the cost of the cells, are likewise less than half of the module. From this, a logical way to achieve a cheaper module was to reduce the high material demand of the cells, and the inherent cost associated. The second generation of cells is then based on thin film technology, marked for their thin absorber layer. In the order of a couple μm, rather than 100–200 μm of the previous generation. The trade-off, however, was a decrease in efficiency. With a thin substrate the efficiencies of the previous generation could not be achieved at first. But counterpointing the efficiency decrease is ability to utilise other manufacturing techniques such as spray coating into a thin glass substrate, and other vacuum based methods, requiring overall lower temperatures in its production process. Their flexibility, that opened up several new possible applications for photovoltaic cells, such as wearable electronics. Additionally, in comparison, their reduced energy payback time and green house gas emission make them an environment friendlier solution. Currently, the initial efficiency drawback is no longer prevalent, as values above 20% were achieved, with a present record of 23.4%.
_
Figure below shows thin-film silicon laminates being installed onto a roof.
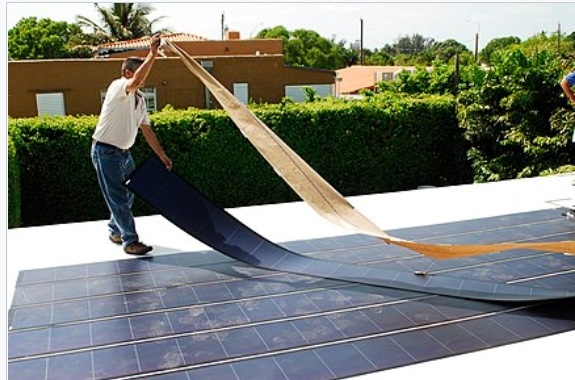
Thin-film solar cells are a second generation of photovoltaic (PV) solar cells. Thin-film solar cells are made by depositing one or more thin layers (thin films or TFs) of photovoltaic material onto a substrate, such as glass, plastic or metal. Thin-film solar cells are typically a few nanometers (nm) to a few microns (µm) thick–much thinner than the wafers used in conventional crystalline silicon (c-Si) based solar cells, which can be up to 200 µm thick. Thin-film solar cells are commercially used in several technologies, including cadmium telluride (CdTe), copper indium gallium diselenide (CIGS), and amorphous thin-film silicon (a-Si, TF-Si).
_
Thin-film cells have several advantages over first-generation silicon solar cells, including being lighter and more flexible due to their thin construction. This makes them suitable for use in building-integrated photovoltaics and as semi-transparent, photovoltaic glazing material that can be laminated onto windows. Other commercial applications use rigid thin film solar panels (interleaved between two panes of glass) in some of the world’s largest photovoltaic power stations. Additionally, the materials used in thin-film solar cells are typically produced using simple and scalable methods more cost-effective than first-generation cells, leading to lower environmental impacts like greenhouse gas (GHG) emissions in many cases. Thin-film cells also typically outperform renewable and non-renewable sources for electricity generation in terms of human toxicity and heavy-metal emissions.
_
Despite initial challenges with efficient light conversion, especially among third-generation PV materials, as of 2023 some thin-film solar cells have reached efficiencies of up to 29.1% for single-junction thin-film GaAs cells, exceeding the maximum of 26.1% efficiency for standard single-junction first-generation solar cells. Multi-junction concentrator cells incorporating thin-film technologies have reached efficiencies of up to 47.6% as of 2023. Still, many thin-film technologies have been found to have shorter operational lifetimes and larger degradation rates than first-generation cells in accelerated life testing, which has contributed to their somewhat limited deployment. Globally, the PV market share of thin-film technologies remains around 5% as of 2023. However, thin-film technology has become considerably more popular in the United States, where CdTe cells alone accounted for nearly 30% of new utility-scale deployment in 2022.
_
Thin-film PV cells offer advantages such as lower material costs, flexibility, and the potential for large-scale production. One notable thin-film technology is cadmium telluride (CdTe) solar cells. A study by Dharmadasa et al. highlighted that CdTe thin-film solar cells have achieved high conversion efficiencies, reaching a record efficiency of 22.1%. The study emphasized the potential of CdTe technology in commercial-scale applications due to its low manufacturing costs and high performance under real-world conditions. Another significant second-generation thin-film technology is copper indium gallium selenide (CIGS) solar cells. A study by Nakamura et al. demonstrated a record efficiency of 23.35% for CIGS thin-film solar cells. The study highlighted the potential of CIGS technology for high-efficiency, low-cost, and lightweight solar cells, making them suitable for various applications, including building-integrated photovoltaics.
_
Third-generation PV cells:
Solar cells made with newer, less established materials are classified as third-generation or emerging solar cells. This includes some innovative thin-film technologies, such as perovskite, dye-sensitized, quantum dot, organic, and CZTS thin-film solar cells. Third generation photovoltaic cells were built upon thin film technology, but diverged from the previous, as it was no longer reliant on a standard p-n junction, in the sense that they were built with new and different materials such as organic compounds, hence the name. Another great improvement achieved in this generation was the ability to tune band gap energies with composition changes, a key factor in the production of multi junction cells. Third-generation PV cells encompass a range of emerging technologies that aim to further enhance the efficiency and capabilities of solar energy conversion. Perovskite solar cells have gained significant attention due to their potential for high efficiency and low-cost production. A study by Yoo et al. reported a perovskite solar cell with a certified efficiency of 25.2%. The study highlighted the rapid advancements in perovskite solar cells and their potential for commercialization, although challenges such as stability and scalability still need to be addressed. Another emerging technology in third-generation PV cells is tandem solar cells. Tandem (multijunction) solar cells combine different semiconductor materials with complementary absorption properties to achieve higher conversion efficiencies. A study by Al-Ashouri et al. demonstrated a record efficiency of 29.15% for a four-terminal perovskite/silicon tandem solar cell. The study emphasized the potential of tandem solar cells to exceed the efficiency limits of single-junction cells and pave the way for even more efficient PV systems. Organic solar cells are also third-generation PV cells; they are widely studied in academia and much effort has been invested to commercialize this technology. These cells are also known as organic photovoltaics (OPVs). OPVs utilize organic materials as the active semiconductor layer to convert sunlight into electricity. These cells offer flexibility and the potential for low-cost manufacturing. Despite lower efficiencies compared with traditional silicon-based cells, recent advancements have pushed reported efficiencies beyond 18%. An example of such progress is work by Cai et al., which demonstrated a power conversion efficiency of 18.6% using two compatible non-fullerene acceptors. This showcases the growing potential of OPVs as a lightweight, flexible, and adaptable solar energy solution within the evolving PV landscape.
_
Various studies demonstrate the continuous advancements in PV technologies across different generations. While first-generation PV cells based on crystalline silicon remain highly efficient and stable, second-generation thin-film technologies such as CdTe and CIGS offer advantages in terms of cost effectiveness and flexibility. Third-generation PV cells, including perovskite and tandem solar cells, hold great promise for achieving higher efficiencies and pushing the boundaries of solar energy conversion. These examples highlight the ongoing research and development efforts in the field of PV technologies, driving innovation and paving the way for more efficient and economically viable solar energy systems
______
______
PV technology:
Solar cell technologies are typically named according to their primary light-absorbing material. As shown in Figure below, PV cells can be classified as either wafer-based or thin film. Wafer-based cells are fabricated on semiconducting wafers and can be handled without an additional substrate, although modules are typically covered with glass for mechanical stability and protection. Thin-film cells consist of layers of semiconducting material deposited onto an insulating substrate, such as glass or flexible plastic. The thin-film PV category can be further divided into commercial and emerging thin-film technologies.
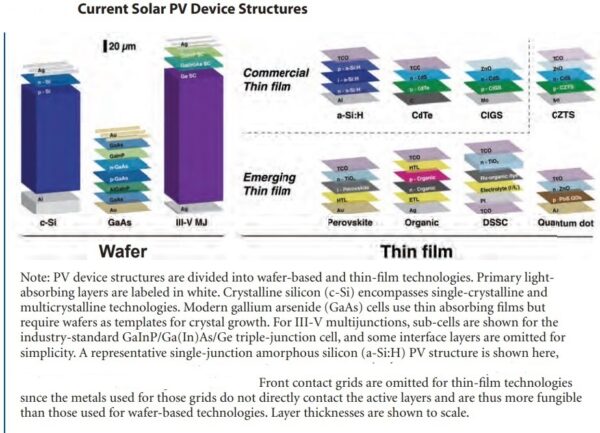
_
The vast majority of commercial PV module production has been — and remains — silicon based, for reasons that are both technical and historical. Silicon can be manufactured into non-toxic, efficient, and extremely reliable solar cells, leveraging the cumulative learning of more than 60 years of semiconductor processing for integrated circuits. Crystalline silicon (c-Si) solar cells are divided into two categories: single-crystalline (sc-Si) and multicrystalline (mc-Si). The higher crystal quality in sc-Si cells improves charge extraction and power conversion efficiencies, but requires more expensive wafers (by 20% to 30%). A key disadvantage of c-Si is its relatively poor ability to absorb light, which encourages the use of thick and brittle wafers. This shortcoming translates to high capital costs, low power-to-weight ratios, and constraints on module flexibility and design. Despite these limitations, c-Si will remain the leading deployed PV technology in the near future, and present c-Si technologies could achieve terawatt-scale deployment by 2050 without major technological advances. Current innovation opportunities include increasing commercial module efficiencies, reducing manufacturing complexity and costs, reducing the amount of silicon used per watt, and reducing reliance on silver for contact metallization
_
Commercial thin-film PV technologies are represented primarily by cadmium telluride (CdTe), copper indium gallium diselenide (CIGS), and hydrogenated amorphous silicon (a-Si:H). These materials absorb light 10–100 times more efficiently than silicon, allowing the use of films just a few microns thick, as shown in Figure below. Their low use of raw materials is thus a key advantage of these technologies. Advanced factories can produce thin-film modules in a highly streamlined and automated fashion, leading to low per-watt module costs.
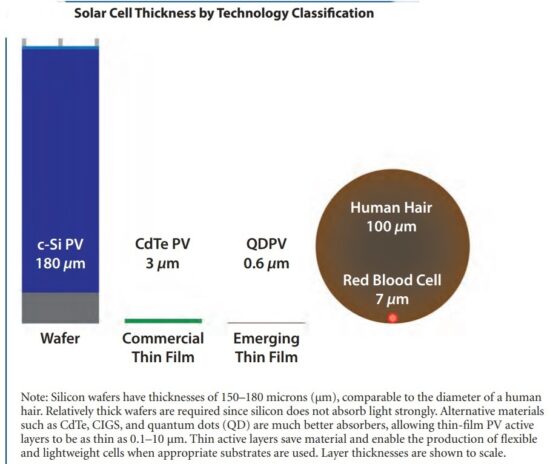
A key disadvantage of today’s commercial thin-film modules is their comparatively low average efficiency, typically in the range of 12%–15%, compared to 15%–21% for c-Si. Reduced efficiencies increase system costs due to area-dependent BOS components. Most thin-film materials today are polycrystalline and contain much higher defect densities than c-Si. Some compound semiconductors (e.g., CIGS) have complex stoichiometry, making high-yield, uniform, large-area deposition a formidable process-engineering challenge. Sensitivity to moisture and oxygen often requires more expensive hermetic encapsulation to ensure 25-year reliability. Recycling of regulated, toxic elements (e.g., cadmium) and reliance on rare elements (e.g., tellurium and indium) can limit the potential for large-scale deployment. Current innovation opportunities in thin-film technology include improving module efficiency, improving reliability by introducing more robust materials and cell architectures, and decreasing reliance on rare elements by developing new materials with similar ease of processing.
______
______
NREL’s efficiency chart:
|
Multijunction Cells |
Cell Type |
Top Efficiency [%] |
|
3J (concentrator) |
44.4 |
|
|
3J (non-concentrator) |
39.5 |
|
|
2J (concentrator) |
35.5 |
|
|
2J (non-concentrator) |
32.9 |
|
|
4J+ (concentrator) |
47.1 |
|
|
4J+ (non-concentrator) |
39.2 |
|
|
GaAs |
Single crystal |
27.8 |
|
Concentrator |
30.5 |
|
|
Thin film crystal |
29.1 |
|
|
Crystalline Si |
Single crystal (concentrator) |
27.6 |
|
Single crystal (non-concentrator) |
26.1 |
|
|
Multicrystalline |
23.3 |
|
|
Silicon heterostructures (HIT) |
26.7 |
|
|
Thin film crystal |
21.2 |
|
|
Thin film |
CIGS (concentrator) |
23.3 |
|
CIGS |
23.4 |
|
|
CdTe |
22.1 |
|
|
a-Si:H (stabilised) |
14.0 |
|
|
Emerging |
Dye-sensitised |
13.0 |
|
Perovskite |
25.5 |
|
|
Perovskite/Si tandem (monolithic) |
29.5 |
|
|
Organic |
18.2 |
|
|
Organic tandem |
14.2 |
|
|
Inorganic (CZTSSe) |
13.0 |
|
|
Quantum dot |
18.1 |
|
|
Perovskite/CIGS tandem |
24.2 |
_____
_____
Bifacial Solar Panels:
Bifacial solar panels provide a unique advantage in solar energy generation by capturing sunlight from both the front and back of the module. This innovative design allows them to utilize reflected sunlight from various surfaces, such as the ground, water, or nearby structures, resulting in increased electricity yield. While monofacial cells require only one diffusion step when forming their single p-n junction, bifacial solar cell require two p-n junctions with different dopants which increase the number of high temperature processes in the manufacturing and, therefore its cost. Bifacial panels yield 5-30% more power than traditional panels. This boost comes from their ability to capture light from both sides, significantly increasing energy output.
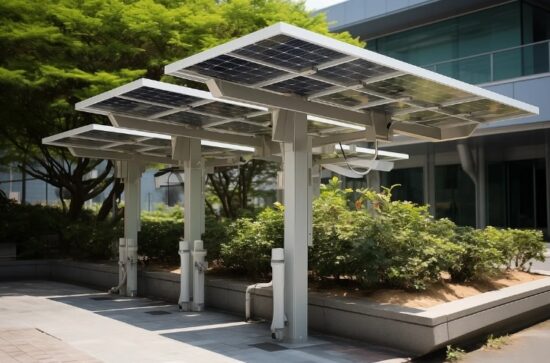
Industrial and utility-scale solar projects, particularly those with solar trackers, are ideal solutions for bifacial solar panels. Recent advancements in bifacial solar panels technology have contributed to their growing market share in the renewable energy sector. The global bifacial solar panel market has witnessed notable growth due to factors such as increased demand for clean energy, improved efficiency, cost reduction, and environmental benefits. Researchers are currently exploring the development of bifacial perovskite solar cells, further enhancing the potential of this cutting-edge, next-generation technology.
______
Passivated Emitter and Rear Cell (PERC):
In recent years, there has been a surge in the popularity of Passivated Emitter and Rear Contact (PERC) solar panels within the solar industry due to their ability to enhance solar power efficiency. These panels utilize PERC solar cells, an upgraded iteration of traditional solar cells. With their innovative design, they can produce 6 to 12 % more energy compared to their conventional counterparts.
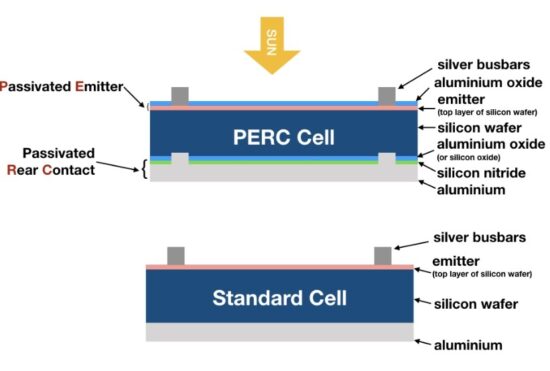
The most powerful solar panels now on the market, called Mono-PERC panels, are made with high efficiency using PERC technology and monocrystalline cells. Invented in 1983, PERCs are used today in nearly 90 percent of solar panels on the market. They incorporate coatings on the front and back to capture sunlight more effectively (see figure above) and to avoid losing energy, both at the surfaces and as the sunlight travels through the cell. The coatings, known as passivation layers, are made from materials such as silicon nitride, silicon dioxide, and aluminum oxide. The layers keep negatively charged free electrons and positively charged electron holes apart, preventing them from recombining at the surface of the solar cell and wasting energy.
Researchers have developed several ways to boost the performance of PERC panels, hitting a record of 24.5 percent efficiency in 2022. One of the technologies is a multilayer antireflective coating that helps solar panels trap more light. They also created extremely fine metallization fingers—narrow lines on solar cells’ surfaces—to collect and transport the electric current and help capture more sunlight. And they developed an advanced method for laying the strips of conductive metal that run across the solar cell, known as bus bars. Experts predict the maximum efficiency of PERC technology will be reached soon, topping out at about 25 percent.
____
TOPCon:
Researchers have been working on tunnel oxide passivated contact (TOPCon) technology. A TOPCon cell uses a thin layer of “tunneling oxide” insulating material—typically silicon dioxide—which is applied to the solar cell’s surface. Similar to the passivation layers on PERC cells, the tunnel oxide stops free electrons and electron holes from combining and wasting energy. The TOPCon solar cell structure consists of a thin tunnel oxide layer sandwiched between a transparent conductive oxide (TCO) layer and a p-doped crystalline silicon layer. The TCO layer acts as a front contact for the solar cell, while the p-doped layer acts as the absorber layer. The tunnel oxide layer acts as a passivation layer, preventing the recombination of charge carriers at the surface of the solar cell. The maximum efficiency of TOPCon cells is around 28%, which is higher than the maximum efficiency of about 24% for PERC cells. This higher efficiency results in more electricity generation from a given surface area.
______
Table below shows comparison of different monocrystalline silicon solar panels for residential use:
|
Power output |
Efficiency % |
Temperature coefficient |
Annual degradation rate |
|
|
PERC 108HC |
400 – 410 watts |
20.5–21 |
-0.343% |
0.55% |
|
PERC 66 |
390 – 400 watts |
19.4–19.9 |
-0.367% |
0.58% |
|
144HC Bifacial PERC |
545 – 555 watts |
21.30-21.69 |
-0.34% |
0.45% |
|
144HC TOPCon |
580 – 590 watts |
22.47-22.86 |
-0.30% |
0.40% |
HC stands for half-cut. Numbers 108, 66, 144 stands for number of solar cells.
PERC 72 model features 72 solar cells and an output of 425 watts. However, this type of solar panel is much larger than the PERC 66 and PERC 108HC panels and is designed for commercial and utility solar arrays.
______
______
Multi-Junction cells:
The intrinsic properties of the semiconductor base chosen, such as bandgap energy and carrier recombination velocity, represent inherent limitations to the performance of the cell. Consider silicon, the most prevalent material in photovoltaic cells, it has a band gap energy of approximately 1.12 eV, therefore only incident photons of equal or higher energy value will lead to the formation of charge carriers, and even so there are still thermalisation and recombination losses to consider. As only part of the solar spectrum meets the needed energy requirements for carrier formation, for a given semiconductor, the limitation becomes apparent. This limit, with an estimation of 29.4%, for silicon-based homojunction solar cells is the well-known Shockley–Queisser limit.
With the objective of reducing thermalisation losses and increasing efficiency, several approaches can be considered. One approach would be to tailor the incident radiation with a specific material, for example by using a prism and pairing each band with the adequate substrate. This approach, even though used in some concentrator photovoltaic devices like a photovoltaic mirror or a spectral splitting device like a dichroic mirror, is not a common and practical solution.
A common solution is the multi-junction or tandem architecture, that consists in stacking different substrates with decreasing band gap energies, from top to bottom, so that photons of decreasing energy values are absorbed by the different layers as they penetrate the cell structure, thus achieving a sort of band selectivity. With this solution, it is possible to overcome the previous value of the Shockley–Queisser limit. The theoretical maximum efficiency value of this architecture is approximately 85% for an infinite number of junctions with perfect substrate pairing under concentration, and to approximately 65% under one sun.
Crystalline group IV (Si and Ge) and III–V compound semiconductors (GaAs, InP, and the numerous III–V alloys) are the best candidates for multijunction cells. Indeed, the highest-efficiency solar cells made are Ga0.5In0.5P/Ga0.99In0.01As/Ge triple-junction devices with concentrated efficiencies of ∼40%.
_____
_____
Perovskite solar cells:
A perovskite solar cell (PSC) is a type of solar cell that includes a perovskite-structured compound, most commonly a hybrid organic–inorganic lead or tin halide-based material as the light-harvesting active layer. Perovskite materials, such as methylammonium lead halides and all-inorganic cesium lead halide, are cheap to produce and simple to manufacture.
Perovskites are a broad class of materials defined by the fact that they have a particular kind of molecular arrangement, or lattice, that resembles that of the naturally occurring mineral perovskite. There are vast numbers of possible chemical combinations that can make perovskites, and these materials have attracted worldwide interest because at least on paper, they could be made much more cheaply than silicon or gallium arsenide. That’s partly because of the much simpler processing and manufacturing processes, which for silicon or gallium arsenide requires sustained heat of over 1,000 degrees Celsius. In contrast, perovskites can be processed at less than 200 C, either in solution or by vapor deposition.
The other major advantage of perovskite over silicon or many other candidate replacements is that it forms extremely thin layers while still efficiently capturing solar energy. Perovskite cells have the potential to be lightweight compared to silicon, by orders of magnitude.
The active perovskite materials used in PSCs typically have energy band gaps between 1.48 eV and 1.62 eV, where the optimum bandgap of the best-performing PSCs is almost pinpointed in the range from 1.53 eV to 1.56 eV. Perovskites have a higher bandgap than silicon, which means they absorb a different part of the light spectrum and thus can complement silicon cells to provide even greater combined efficiencies. But even using only perovskite with a single active layer, we can make efficiencies that threaten silicon, and hopefully within punching distance of gallium arsenide. And both of those technologies have been around for much longer than perovskites have. The band gap of PSCs should be modified to match the wavelength of solar energy to maximize light absorption and thus enhance the performance of the PSCs. The common techniques for band gap tuning in perovskite materials are compositional engineering, doping, interface engineering, dimensional modification, and pressure or strain.
_
Solar-cell efficiencies of laboratory-scale devices using these materials have increased from 3.8% in 2009 to 25.7% in 2021 in single-junction architectures, and, in silicon-based tandem cells, to 29.8%, exceeding the maximum efficiency achieved in single-junction silicon solar cells. Perovskite solar cells have therefore been the fastest-advancing solar technology. With the potential of achieving even higher efficiencies and very low production costs, perovskite solar cells have become commercially attractive. However, owing to their low stability, the widespread manufacturing of perovskite solar cells (PSCs) for commercialization is still far off.
_
Perovskites have attracted keen attention due to their superior semiconducting characteristics such as tunable band gap, high carrier mobility, high‐efficiency light absorption capability of perovskite layers, and low manufacturing costs. Combining the fabrication process, compositional, and interfacial engineering strategies, the record power conversion efficiency (PCE) of rigid perovskite solar cells (PSCs) has now reached 26%. The excellent mechanical flexibility of perovskite materials facilitates the implementation of flexible PSCs (f‐PSCs) on a variety of flexible substrates. Owing to the advantages such as a high power‐to‐weight ratio, excellent flexibility, low processing temperature, and low‐cost roll‐to‐roll (RTR) manufacturing, f‐PSCs hold promise to display a high commercial value in a wide range of scenarios. Benefiting from the application of engineering strategy and the development of low‐temperature preparation technology, the highest PCE of f‐PSCs has reached 23.84%. In addition to PCE, mechanical stability is also one of the important evaluation indicators for f‐PSCs. The application scenarios for f‐PSCs are more flexible than for rigid devices and therefore require superior bending stability. However, the strain generated by folding and bending has emerged as the most significant impediment to improving performance. Certainly, strain not only occurs in the application process of the device but also in the preparation process of the semiconductor device, which may have a negative impact on the performance of the device.
_____
_____
III-V Solar Cells:
A III-V compound semiconductor is an alloy, containing elements from groups III and V in the periodic table. This type of photovoltaic technology is named after the elements that compose them. III-V solar cells are mainly constructed from elements in Group III—e.g., gallium and indium—and Group V—e.g., arsenic and antimony—of the periodic table. These solar cells are generally much more expensive to manufacture than other technologies. But they convert sunlight into electricity at much higher efficiencies. Because of this, these solar cells are often used on satellites, unmanned aerial vehicles, and other applications that require a high ratio of power-to-weight. III-V compound semiconductors are used for space solar cells, concentrator solar cells, and in thermophotovoltaic generators. III-V multijunction cells can generate sufficient voltage and current to spontaneously split water, thereby producing hydrogen that can be stored. III–V Multijunction solar cells have reached the highest conversion efficiencies of any photovoltaic technology.
Gallium Arsenide (GaAs) Wafer is a significant type III-V direct bandgap semiconductor used in various devices such as infrared emitting diodes, laser diodes, and microwave frequency integrated circuits. It is also utilized in the production of high efficiency photovoltaic cells. It is often utilized in concentrated PV systems and space applications. Their efficiency is up to 25%, and up to 28% at concentrated solar radiation. Special types have efficiency over 30%. GaAs single junction solar cell belong to first generation of PV technology while GaAs multi-junction cell belong to third generation of PV technology.
______
______
Transparent solar cells:
Transparent solar panels or solar windows are a fascinating product for the future as they make windows serve as solar energy generators. Similar to ordinary windows, these transparent panels can be installed on buildings without significantly changing their appearance yet gather solar energy. The major improvement is incorporation of transparent organic solar cells that are cast onto glass substrates. These organic photovoltaic cells convert light in the near-infrared and ultraviolet portion of the spectrum to electrical energy while being transparent to visible light. Organic photovoltaic material is placed between two glass or plastic sheets to form a transparent and weather resistant solar module. The solar cells themselves are nearly imperceptible at a glance and permit more than 60% of visible light to pass through. Some of the unique advantages include a more sophisticated design with minimal intrusions on the aesthetic value of a house or city landscape windows and the potential to transform virtually any glass surface into a solar power plant. A typical residential window can produce more than 100 watts of power. To be compared with the fact that most typical rooftop solar panels produce approximately 300 watts per panel. This invisible solar panel is a demonstration of how photovoltaic self-consumption will not only be for those who have large rooftops or outdoor spaces to place them.
_____
_____
Quantum Dots:
Quantum dot solar cells conduct electricity through tiny particles of different semiconductor materials just a few nanometers wide, called quantum dots. Quantum dots provide a new way to process semiconductor materials, but it is difficult to create an electrical connection between them, so they’re currently not very efficient. However, they are easy to make into solar cells. They can be deposited onto a substrate using a spin-coat method, a spray, or roll-to-roll printers like the ones used to print newspapers. Quantum dots come in various sizes and their bandgap is customizable, enabling them to collect light that’s difficult to capture and to be paired with other semiconductors, like perovskites, to optimize the performance of a multijunction solar cell.
_____
_____
EFG and CIS solar cells:
Among less frequently used solar cell types we find solar cells produced by EFG (Edge Defined Film fed Growth) method and copper-indium selenide (CIS) solar cells.
EFG monocrystalline solar cells are produced directly from silicon melt eliminating sawing to wafers, which results in lower production costs and material saving for there is no waste due to sawing. Using EFG procedure, a silicon ribbon shaped in proper tube with eight flat sides is drawn from silicon melt. The tube length amounts to several metres. Flat sides are sawn by laser into separate solar cells. Most solar cells are proper square shaped in dimension of 100×100 mm. Consequently, the module power is greater with lesser surface compared to crystal modules of square shaped cells with truncated sides. Contacts are made in shape of copper bands. Separate cells are then combined in a similar manner than with other cell types.
CIS solar cells stand for copper indium gallium selenium (CIGS) solar which is a thin film solar cell used to convert solar energy into electrical energy. CIS/CIGS is manufactured by depositing a thin layers of copper, indium and selenium on plastic or glass backing, besides the electrodes on the front and back sides to collect current. Since the material has a high absorption coefficient and absorbs sunlight strongly, a much thinner film is required in comparison to other semiconductor materials. Cadmium telluride and copper-indium selenide (CIS) cells are scarcely used, mostly in lab research. Commercial modules from above mentioned materials are still hard to find.
______
______
Fabric PV:
Printed Organic Photovoltaic Modules on Transferable Ultra-thin Substrates as Additive Power Sources, a 2022 study demonstrated large-area, ultra-thin organic photovoltaic (PV) modules produced with scalable solution-based printing processes for all layers. Researchers further demonstrated their transfer onto light-weight and high-strength composite fabrics, resulting in durable fabric-PV systems ∼50 microns thin, weighing under 1 gram over the module area (corresponding to an area density of 105 g/m2), and having a specific power of 370 W/kg. Integration of the ultra-thin modules onto composite fabrics lends mechanical resilience to allow these fabric-PV systems to maintain their performance even after 500 roll-up cycles. A typical rooftop solar installation in Massachusetts is about 8,000 watts. To generate that same amount of power, this fabric photovoltaics would only add about 22 kilograms (48 pounds) to the roof of a house. A standard 60-cell 1.7m2 300-watt solar panel weighs around 18kg. Standard 8000 watt solar installation would weigh 480 kg (1058 pounds).
______
______
Intermediate band solar cells (IBSCs):
Intermediate band solar cells (IBSCs) is an emerging technology that has the potential to revolutionize clean energy generation by enabling the efficient conversion of sunlight into electrical energy beyond the Shockley-Queisser limit [~32% for single-gap solar cells (SGSCs)] to efficiency as high as ~63%. In a typical intermediate band system, solar radiation can excite carriers from the valence to the conduction band through two pathways: direct excitation from the valence band to the conduction band, or a stepwise excitation from the valence band to the intermediate band and then to the conduction band. To efficiently capture solar energy, it is essential to engineer the material carefully and match these three transitions to the solar radiation. This enables a single photon to result in multiple exciton generations (MEG) through a two-step absorption process, even for photons with energies slightly above the bandgap. This is unlike SGSCs where MEG only occurs when the solar photon energy is at least twice the bandgap. Chemically tuned intermediate band states in atomically thin CuxGeSe/SnS quantum material for photovoltaic applications, a 2024 study demonstrated design of new generation of quantum material derived from intercalating zerovalent atoms such as Cu into the intrinsic van der Waals gap at the interface of atomically thin two-dimensional GeSe/SnS heterostructure. The charge carriers across the heterojunction are both energetically and spontaneously spatially confined, reducing nonradiative recombination and boosting quantum efficiency. Using this intermediate band material in a solar cell prototype enhances absorption and carrier generation in the near-infrared to visible light range, and achieved quantum efficiency as high as 190% across a broad range of solar wavelengths; a measure that far exceeds the theoretical Shockley-Queisser efficiency limit for silicon-based materials and pushes the field of quantum materials for photovoltaics to new heights.
Note:
Quantum efficiency (QE) is the measure of the effectiveness of a device to convert incident photons into electrons. For example, if a device had a QE of 100% and was exposed to 100 photons, it would produce 100 electrons of signal.
______
______
Concentration Photovoltaics:
Concentration PV, also known as CPV, focuses sunlight onto a solar cell by using a mirror or lens. By focusing sunlight onto a small area, less PV material is required. PV materials become more efficient as the light becomes more concentrated, so the highest overall efficiencies are obtained with CPV cells and modules. However, more expensive materials, manufacturing techniques, and ability to track the movement of the sun are required, so demonstrating the necessary cost advantage over today’s high-volume silicon modules has become challenging.
In Concentrated Photovoltaics, mirrors or lenses are typically used to focus the incoming radiation on a receiver, that in turn are designed for a certain level of concentration, ranging from just above 1 sun, in Low Concentration Photovoltaics (LCPV), to 2000 suns and higher in High Concentration Photovoltaics (HCPV). Longitude and latitude as well as the time of the year play an important role in CPV design. In order to assure a precise focus of the incoming radiation on the receiver, different reflector designs are chosen for a given geography. Additionally, given that the relative position of the Earth regarding the Sun also changes during the year, the modules are usually accompanied with a solar tracking system, especially in HCPV. The added costs of the solar tracking systems, the needed cooling systems, more so in higher levels of concentration, and the added device complexity can offset the benefits of reduced cell area, so the choice is once again in terms of the intended application. Nonetheless, CPV using multijunction III–V cells have recorded highest efficiency. As of 2024, the world record for solar cell efficiency is 47.6%, set in May 2022 by Fraunhofer ISE, with a III-V four-junction concentrating photovoltaic (CPV) cell. Another pathway that has been explored recently is the combination of III–V alloys with Si in multijunction architectures. The premise here is to make use of the low bandgap of Si, ideal for the last junction of such devices, offsetting some of the cost of a full III–V multijunction device. The challenge then becomes the lattice difference between the usual III–V alloys and Si.
_
Luminescence solar concentrators:
A Luminescence Solar Concentrators (LSC) is a simple light energy absorber, converter, and concentrating device consisting of a thin slab of a transparent material of ideally high refractive index with embedded a low concentration of luminescent emitters (luminophores or fluorophores). LSCs’ emitters absorb a substantial portion of the sun radiation spectrum that is then re-emitted at longer wavelengths via the photoluminescence (PL) process. LSCs can be directly connected with existing PVs, and do not require modifications of the PV electronics. The photoconversion in LSC allows tunability to better match the PV response and can offer new prospects for innovative product design ideas. The concentration of sun light is not anymore the primary purpose of LSCs, and their research is now basically focused on the spectral conversion of sunlight to better match the needs of building integrated PV to meet future energy and emission targets.
_______
_______
Advancements in PV Technologies:
The advancements in PV technologies, including efficiency improvements, cost reduction strategies, and the utilization of novel materials and manufacturing techniques, are driving the progress and commercialization of solar energy. By continuously pushing the boundaries of performance, scalability, and affordability, PV technologies are becoming increasingly competitive and viable for widespread adoption in the global energy landscape. A summary of the findings obtained by various researchers using different types of PV cells is presented in Table below.
|
Sources |
Type of PV Cell |
Output Efficiency |
Main Findings |
|
Saga et al. |
Monocrystalline |
>25% |
Improved efficiency and reduced manufacturing costs through diamond-wire sawing. |
|
Dharmadasa et al. |
CdTe Thin-film |
22.1% |
High conversion efficiency and low manufacturing costs for commercial-scale applications. |
|
Nakamura et al. |
Copper Indium Gallium Selenide (CIGS) |
23.35% |
High-efficiency, low-cost, and lightweight solar cells suitable for various applications. |
|
Yoo et al. |
Perovskite |
25.2% |
Rapid advancements in perovskite solar cells with commercialization potential. |
|
Al-Ashouri et al. |
Tandem |
29.15% |
Four-terminal perovskite/silicon tandem solar cell with high conversion efficiency. |
|
Hallam et al. |
Silicon |
25.7% |
ALD passivation layers enhance silicon solar cell performance. |
|
Geisg et al. |
Multi-junction |
47.1% |
Four-junction solar cell with high conversion efficiency. |
|
Cao et al. |
Perovskite |
25.2% |
Earth-abundant tin-based perovskite materials for low-cost PV technologies. |
|
Ansari et al. |
Gallium Arsenide |
28.3% |
Gallium arsenide solar cells with potential for high conversion efficiency. |
|
Morales-Acevedo et al. |
Dye-sensitized |
11.3% |
Enhanced efficiency and stability of dye-sensitized solar cells using improved materials. |
|
Liu et al. |
Organic–Inorganic Hybrid |
11% |
Enhanced efficiency and thermal stability of organic–inorganic hybrid solar cells. |
|
Zielke et al. |
Silicon Heterojunction |
17.4% |
High-efficiency silicon heterojunction solar cells with reduced recombination losses. |
|
Pandey et al. |
Perovskite–Silicon Tandem |
30.7% |
Record efficiency for perovskite–silicon tandem solar cells, demonstrating great potential. |
|
Pandey et al. |
Quantum Dot |
12.1% |
Quantum dot solar cells with tunable bandgaps for efficient energy conversion. |
|
Sahli et al. |
Perovskite–Silicon Tandem |
25.2% |
Improved performance and stability of perovskite–silicon tandem solar cells. |
|
Ma et al. |
Ternary Organic |
17.5% |
Ternary organic solar cells with enhanced PV performance. |
|
Schmidt-Mende et al. |
Dye-sensitized |
6.3% |
Efficiency improvements and enhanced stability of dye-sensitized solar cells. |
|
Carrillo et al. |
Perovskite |
20.3% |
Lead-free perovskite solar cells with competitive efficiency and stability. |
|
Descoeudres et al. |
Silicon Heterojunction |
21.38% |
Silicon heterojunction solar cells with improved rear-side passivation for higher efficiency. |
|
Philipps et al. |
III–V Multijunction |
41.6% |
High-efficiency III–V multijunction solar cells with potential for space applications. |
|
Sung et al. |
Graphene-Based |
17.1% |
Graphene-based solar cells with enhanced electron transport properties. |
|
Barraud et al. |
Silicon Heterojunction |
22.1% |
Silicon heterojunction solar cells with improved rear passivation and carrier collection. |
_____
_____
Section-9
Factors impacting solar technology output:
Module performance is generally rated under standard test conditions (STC): irradiance of 1,000 W/m2, solar spectrum of AM 1.5 and module temperature at 25 °C. The actual voltage and current output of the module changes as lighting, temperature and load conditions change, so there is never one specific voltage at which the module operates. Performance varies depending on geographic location, time of day, the day of the year, amount of solar irradiance, direction and tilt of modules, cloud cover, shading, soiling, state of charge, and temperature. Performance of a module or panel can be measured at different time intervals with a DC clamp meter or shunt and logged, graphed, or charted with a chart recorder or data logger.
For optimum performance, a solar panel needs to be made of similar modules oriented in the same direction perpendicular to direct sunlight. Bypass diodes are used to circumvent broken or shaded panels and optimize output. These bypass diodes are usually placed along groups of solar cells to create a continuous flow.
_
Electrical characteristics include nominal power (PMAX, measured in W), open-circuit voltage (VOC), short-circuit current (ISC, measured in amperes), maximum power voltage (VMPP), maximum power current (IMPP), peak power, (watt-peak, Wp), and module efficiency (%).
Open-circuit voltage or VOC is the maximum voltage the module can produce when not connected to an electrical circuit or system. VOC can be measured with a voltmeter directly on an illuminated module’s terminals or on its disconnected cable.
The peak power rating, Wp, is the maximum output under standard test conditions (not the maximum possible output). Typical modules, which could measure approximately 1 by 2 metres (3 ft × 7 ft), will be rated from as low as 75 W to as high as 600 W, depending on their efficiency. At the time of testing, the test modules are binned according to their test results, and a typical manufacturer might rate their modules in 5 W increments, and either rate them at +/- 3%, +/-5%, +3/-0% or +5/-0%.
______
Influence of temperature:
The performance of a photovoltaic (PV) module depends on the environmental conditions, mainly on the global incident irradiance G in the plane of the module. However, the temperature T of the p–n junction also influences the main electrical parameters: the short circuit current ISC, the open circuit voltage VOC and the maximum power Pmax. In general, it is known that VOC shows a significant inverse correlation with T, while for ISC this correlation is direct, but weaker, so that this increase does not compensate for the decrease in VOC. As a consequence, Pmax decreases when T increases. This correlation between the power output of a solar cell and the working temperature of its junction depends on the semiconductor material, and is due to the influence of T on the concentration, lifetime, and mobility of the intrinsic carriers, i.e., electrons and gaps. inside the photovoltaic cell.
_
Voltage is the difference in electrical charge between two points in a circuit. This difference in charge allows electricity to flow. Current is the rate at which electricity flows through the system. Electrical power is the product of voltage and current and it is the rate at which energy is generated by solar panels. Electric power is measured in watts or kilowatts, while electric energy is measured in kilowatt-hours.
In hot environments, PV panels tend to be less efficient due to the negative impact of high temperatures on the performance of PV cells. As the temperature rises, the output voltage of a solar panel decreases, leading to reduced power generation. For every degree Celsius above 25°C (77°F), a solar panel’s efficiency typically declines by 0.3% to 0.5%. Solar cell voltage decreases fundamentally as temperature increases owing to increased internal carrier recombination rates, caused by increased carrier Brownian motion.
In a semiconductor, as the temperature increases, the electrons get excited and jump from the valance band into the conduction band and thereby increases conductance resulting in the decrease of resistance. When temperature of solar cell increases, the current increases due exited electrons jumping from valence into conduction bands. However weak increase in current cannot compensate for significant fall in voltage resulting in reduces solar cell output. This decrease in efficiency can be significant in regions where temperatures rise dramatically during the day, such as deserts or tropical areas. In these environments, it’s best to select PV panels with a low-temperature coefficient. Also, installing cooling systems and ensuring adequate ventilation can help mitigate the effects of heat on solar panel efficiency.
In contrast, cold environments can offer improved solar panel efficiency due to the favorable temperature conditions for PV cell performance. Lower temperatures lead to increased output voltage, boosting overall power generation. At freezing temperature (0 C), there is a 10% increase in voltage and at more extreme temperatures it can be as much as a 25% increase. Many areas in North America and Europe regularly get well below 0 C and the voltage increase can become substantial.
If you look at the data sheet provided by your solar panel manufacturer, they will refer to a term normally described as the temperature coefficient pMax. This value, which is normally given in the form of negative percentage, reveals the impact of temperature on the panel.
Solar panels are power tested at 25 C, so the temperature coefficient percentage illustrates the change in efficiency as it goes up by a degree. For example, if the temperature coefficient of a particular type of panel is -0.3%, then for every 1C rise, the panels maximum power will reduce by 0.3%. So on a hot day, when panel temperatures may reach 45C, a panel with a temperature coefficient of -0.3% would result in a maximum power output reduction of 6%. Conversely, if it was a sunny winter’s morning, the panels will actually be more efficient.
Note:
Solar panels can reach temperatures around 66°C (150°F) or even higher under direct sunlight. The temperature increase is due to the conversion of absorbed sunlight into heat. Elevated temperatures can negatively impact solar panel efficiency, reducing energy production. Proper installation and ventilation can help mitigate this issue.
_____
Productivity by location:
The productivity of solar power in a region depends on solar irradiance, which varies through the day and year and is influenced by latitude and climate. PV system output power also depends on ambient temperature, wind speed, solar spectrum, the local soiling conditions, and other factors.
A location typically receives the most solar energy during periods of clear skies when the sun is high in the sky, which typically occurs around midday. This is when the sun’s rays are most direct, leading to maximum solar irradiance and energy production. Additionally, locations closer to the equator tend to receive more consistent and intense sunlight throughout the year compared to those farther away. However, weather conditions, such as cloud cover and atmospheric pollution, can also affect the amount of solar energy received at any given time.
The locations with highest annual solar irradiance lie in the arid tropics and subtropics. Deserts lying in low latitudes usually have few clouds and can receive sunshine for more than ten hours a day. These hot deserts form the Global Sun Belt circling the world. This belt consists of extensive swathes of land in Northern Africa, Southern Africa, Southwest Asia, Middle East, and Australia, as well as the much smaller deserts of North and South America. Thus, solar is (or is predicted to become) the cheapest source of energy in all of Central America, Africa, the Middle East, India, South-east Asia, Australia, and several other regions.
_____
_____
Peak Sun Hours:
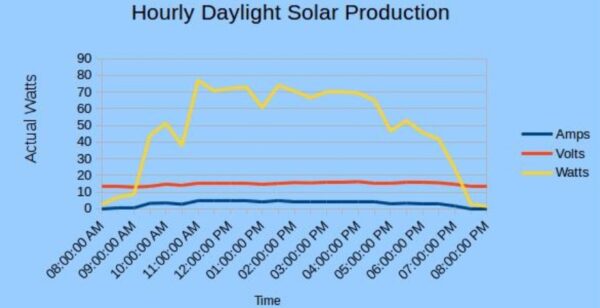
A peak sun hour is defined as one hour in which the intensity of solar irradiance (sunlight) reaches an average of 1,000 watts (W) of energy per square meter throughout one hour. In other words, one peak sun hour is 1 kWh radiation energy received in 1 square meter over 1 hour. For example, you receive 300 watts/m2 continually for 12 hours in a day, it would come to 3.6 peak sun hours (300 x 12 = 3600 / 1000 = 3.6). This allows you to precisely measure the amount of irradiance (sunlight) that will hit solar panels installed in a given location. This, in turn, allows you to calculate the expected energy production for a given solar system size installed at that location. In other words, peak sun hours tell you how much power a solar installation on your roof will generate. They also allow you to compare sunlight availability between locations. Solar installers need to consider the peak sun hours available in a given area when determining the size and location of a solar installation. Typically, the intensity of sunlight is greatest in the middle of the day. That’s also when solar panels receive the most direct sunlight. Illinois, for example, averages 3 – 4 peak sun hours per day. During those hours, solar panels will receive close to 1,000 watts of solar energy per square meter throughout one hour. Texas averages 4.5 – 6 peak sun hours per day, so a solar array in Austin could produce more energy than the same-sized system in Chicago.
_
Knowing your region’s average peak sun hours can be a useful gauge of your home’s solar potential. Using the example below, you can use peak sun hours to calculate how much electricity you need your solar panel system to create:
- Peak sun hours = 6
- Your home used 15,000 kWh of electricity last year
- 15,000 kWh / 365 days = 41.09 kWh per day
- 41.09 kWh per day / 6 peak sun hours per day = 6.8 kW
- You should install a 7kW solar PV system
Your solar panels need the direct sunlight of peak sun hours to generate the maximum electricity possible for your home. However, you don’t need to move to a state with the highest number of peak sun hours to enjoy the perks of solar power. It just means that a home in Massachusetts that uses 15,000 kWh a year will need more solar panels in their rooftop array to generate that much electricity than a home in Arizona with the same amount of annual usage. Knowing the peak sun hours of your service area can help you determine whether solar panels will offer a good return on investment for a client. In locations that don’t have as many sunny days as Arizona, generous incentives can make solar panels still worth it. Illinois, for example, has a low sun number. But the state government’s aggressive push for renewable energy can make solar panels a solid proposition for ratepayers.
_
Other factors that affect Average Daily Peak Sun Time:
A solar panel system should operate at its peak output rating in lab conditions. In real-world conditions, the system will have some output loss caused by high temperatures, among other factors. Other factors that impact how efficient and productive a solar system can be include:
Roof orientation: South-facing roofs typically have the most optimum angle for sunlight.
Shading: Properties with large trees or buildings obstructing the roof can block some sunlight from reaching a photovoltaic system.
Time of day: When the sun is low in the sky, sunlight has to filter through more of the atmosphere. This reduces the intensity of solar radiation.
______
______
Direction and tilt of solar panels:
Solar panel angle or tilt:
The angle between the horizontal ground and the solar module is known as the solar panel tilt angle. This angle varies based on several factors, including the latitude of your location and the time of year. Fixed racks can hold modules stationary throughout the day at a given tilt (zenith angle).
Solar Panel Orientation:
It is the direction of solar panels towards south or north or west or east etc. Fixed racks can hold modules stationary throughout the day facing a given direction (azimuth angle).
_
It is easy to understand that solar panels work best when they can get as much direct sunlight as possible. So, it’s no surprise that one of the most common questions is “What is the best direction for solar panels?” The position of solar panels can be hugely significant in determining their output; and when your panels’ output affects their cost-effectiveness it is essential to get it right. Whether you are having a domestic or a commercial solar panel installation, it is important to understand the factors involved in finding the ideal location for your panels to get the most out of your system. The direction and position of your panels can have a remarkably large effect on their efficiency, so it’s worth spending some time to get this right. This advice applies to any type of panel that gets energy from the sun; photovoltaic, solar hot water, etc. Here we discuss the panel that is fixed, or has a tilt that can be adjusted seasonally. Panels that track the movement of the sun throughout the day can receive 10% (in winter) to 40% (in summer) more energy than fixed panels. Here we are not discussing tracking panels.
__
Which direction is best for solar panels?
At noon, the sun’s light comes from the south in the Northern Hemisphere and from the north in the Southern Hemisphere. If you live in the U.S., which is in the Northern Hemisphere, the general recommendation is to orient your panels facing true south. By facing south, your solar panels are positioned to receive maximum sunlight exposure throughout the day. This is because the sun’s rays are most intense when it is directly overhead. South-facing panels have a longer duration of direct sunlight compared to panels facing other directions, ensuring a more consistent and efficient energy production. South-facing panels make the most of the available sunlight by maximizing their exposure to the sun’s rays. This results in higher energy output and greater efficiency, allowing you to generate more clean and renewable energy for your home or business.
A south-facing roof receives maximum sunlight over the course of a day, especially in the northern parts of the US. With a south-facing roof, your solar panels will produce the greatest amount of energy overall, but east or west-facing roofs can also work well and will produce energy for a large portion of the day.
North-facing roofs are the most unfavourable option for solar panels, since they receive very little direct sunlight. North-facing panels will need to be angled much more steeply, around 60 degrees, to capture as much of the indirect and reflected light as possible, but the energy output will still be much lower than other roof locations throughout the year.
_
Magnetic Declination:
Magnetic declination refers to the angle between true north and magnetic north. It’s important to take magnetic declination into account when orienting your solar panels. Solar panels should always face true south if you are in the northern hemisphere, or true north if you are in the southern hemisphere. True north is not the same as magnetic north. If you are using a compass to orient your panels, you need to correct for the difference, which varies from place to place. By aligning your panels with true south rather than magnetic south, you can ensure optimal performance.
_
Can solar panels face other directions?
While south-facing solar panels are generally recommended for maximum energy generation, panels can still be effective when facing other directions. East-facing panels receive the most sunlight in the morning, which can be advantageous for certain energy needs. Similarly, west-facing panels receive more sunlight in the afternoon, which may align better with your energy consumption patterns. It’s important to note that the overall energy production may be slightly lower than that of south-facing panels. However, with advancements in solar technology, even panels facing east or west can still provide a significant amount of clean energy for your home or business.
_
What if my roof doesn’t face south?
If your roof doesn’t face south, don’t worry! Solar panels can still be installed and generate substantial energy. While south-facing panels are ideal, it’s important to consider other factors such as the available space, roof pitch, and obstructions that may impact panel placement. East or west-facing roofs can still harness the power of the sun and contribute to your energy needs. Consulting with a professional solar installer will help determine the best configuration for your specific situation, maximizing the efficiency of your solar system.
Are there exceptions to the south-facing rule?
Yes, there are exceptions to the south-facing rule. In some cases, due to shading or other obstructions, it may be more practical to install solar panels on a different side of your property. For example, if you have tall trees or nearby buildings that cast shadows on your south-facing roof, it may be more beneficial to install panels on an east or west-facing roof to minimize shading. Remember that solar panels require direct sunlight to generate electricity efficiently, so it’s crucial to assess your unique circumstances before making a decision. Consulting with a professional solar installer will provide valuable insights and ensure you make an informed choice that maximizes your solar energy production.
___
Which angle is best for solar panels?
There is virtually no debate regarding the most effective direction of solar panels. However, opinions vary when it comes to the best angle to optimise energy generation. If you were directly on the equator this would be simple, as a horizontal panel at 90 degrees would always have the sun directly above. However, for solar panels in most other locations, the sun’s angle changes throughout the year.
The optimal angle will depend on the specifics of your property and the angle of your roof. Ideally your panels should be pointing directly at the sun in the middle of the day during the summer. A good rule of thumb for maximum annual energy output is to tilt your panels at an angle equal to your latitude. For example, if you live in a place with a latitude of 35 degrees, tilting your panels at 35 degrees would be optimal.
Bear in mind that this will make your solar PV system slightly less effective in the winter, because the sun is lower in the sky later in the year. Some homeowners and businesses choose to tilt their panels equal to their latitude, plus 15 degrees in winter, or minus 15 degrees in summer. It is simplest to mount your solar panels at a fixed tilt and just leave them there. But because the sun is higher in the summer and lower in the winter, you can capture more energy during the whole year by adjusting the tilt of the panels according to the season.
_
According to the U.S. Energy Information Administration, the optimal angle of your solar panels is typically equal to your home’s geographic latitude. So if you live at 30 degrees latitude, your solar panels will be installed at a 30-degree angle due to the position of the sun in the sky.
The sun is lower in the sky at higher latitudes, which means solar panels are installed at a greater angle to receive direct sunlight as seen in the figure below. But the sun is higher in the sky at lower latitudes, so solar panels are positioned at a lower angle to receive more sunlight.
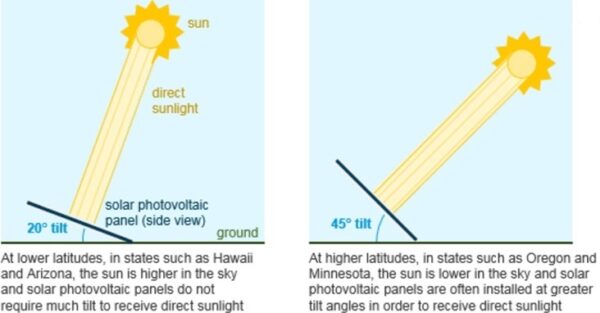
__
Still confused about tilt angles?
A zero tilt angle means that the face of the panel is aimed directly overhead. A positive tilt angle means that the panel faces more towards the equator. In the northern hemisphere that would mean tilting so it faces towards the South. Rarely, the tilt angle can be negative; this means the panel faces away from the equator.
The sweet spot for solar panels in the continental U.S. is facing roughly south, tilted between 15 and 40 degrees, according to the Department of Energy. That keeps the panels in the sun longer than other setups—which means more electricity per panel per year, and bigger savings on your utility bills.
South-facing solar panel systems will almost always generate the most electricity. But east-west roofs can work well for solar, too.
The direction is more important than the angle. Angle is rarely a make-or-break factor, and most roof tilts will work fine—though there are some exceptions. Small roofs, bad solar policies, and heavy shading are all much more likely than the roof orientation to wreck the economics of solar.
North is the worst direction for solar:
North-facing panels spend much less time in the sun than panels that face any other direction—and the greater the tilt, the worse the production.
_
Direction (orientation) dilemma:
The Pecan Street Research Institute found that homeowners who aimed their panels toward the west, instead of the south, generated 2% more electricity over the course of a day. More importantly, those west-facing panels reduced household electricity usage during the times when electricity is most expensive—and power grids are most likely to become overloaded—by 65%, while south-facing panels only reduced usage during those times by 54%. In Texas, as in most places, those “peak times” are from 3pm to 7pm, and correspond with the heat of the day. It’s obvious that west-facing solar panels produce more electricity later in the day, when the sun is setting in the west, and quantifying the way that favoring late-day sunlight helps homeowners save money.
_
The position that maximises the energy collected by a solar panel in the UK is facing south and tilted at an angle of 35 degrees from the horizontal. As the direction the panel faces moves away from due south, the annual incident energy will fall off. Similarly, as the angle of tilt increases towards vertical or decreases towards horizontal the incident energy will also drop.
However, as shown in the figure below, the effect is not that pronounced.
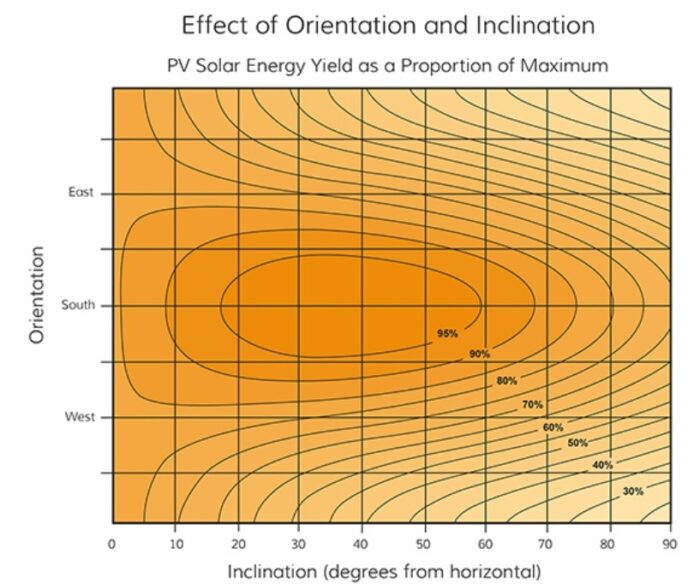
For a typical roof of 35 degrees pitch, it can be seen that panels facing southeast or southwest will receive 95% of the light energy each year compared to panels facing south. Panels facing east and west receive 80%, which can easily be made up with additional panels.
As the cost of solar falls, people are already talking about placing panels on north facing roofs as well as the southerly aspect. At northeast/west a 35 degree roof receives more than 60% of the light energy of a south facing roof, and a fully north facing roof 55%.
The reason for this? Around half of the light energy through the year in the UK is diffuse (reflected off clouds or ground or landscape), and this light energy is less effected by the orientation of the panel than the light arriving direct from the sun.
______
______
How does the design of my roof factor in?
There are so many styles of property that roof designs can vary between homes and commercial premises, which in turn affects how solar panels are positioned. Many house roofs have slopes of between 30 and 40 degrees, so the panels can lie flush and produce sufficient electricity. However, if your roof is steeper or shallower than this, it will affect the mounting system used. In either case, a specialised mounting may be needed to fit the panels to your property. For properties with flat roofs, mounting system will be used to tilt the panels upwards and they will be spaced to prevent them from shading each other.
Do they have to be attached to the roof?
If you do not have adequate space for solar panels or prefer not to mount them on your roof, installing ground mounts is an excellent alternative. With ground mounts, solar panels are mounted on freestanding frames placed in open areas of your property like your yard or garden. Alternatively, integrated solutions such as façade and flat-roof solar panels can be used to replace conventional building materials.
Ground mounts offer more flexibility in positioning and angling your solar panels compared to roof mounts. They can be oriented south for maximum exposure and tilted at the optimal angle for your location. Ground mounts do require available space on the ground clear of shade, but they can be a simple way to achieve an efficient solar setup if you have the room.
There are some downsides to consider with ground mounted solar panels. They are more at risk of shading from surrounding trees, buildings or other obstacles which can then impact energy generation. They’re also more prone to the effects of weather like heavy winds, requiring sturdy frames and mounts which can increase installation costs.
______
______
Weather and Solar Energy:
Weather conditions can impact the amount of electricity a solar system produces, but not exactly in the way you might think. Perfect conditions for producing solar energy include a clear sunny day, of course. But like most electronics, solar panels are actually more efficient in cold weather than in warm weather. This allows the panel to produce more electricity in the same amount of time. As the temperature rises, the panel generates less voltage and produces less electricity. The productivity and efficiency of solar panels decrease by about 0.3% for every degree increase in temperature above 77° Fahrenheit (25° Celsius). When your solar panels are exposed to excessively high temperatures, it causes a voltage drop between the solar cells, leading to a reduced optimum power generation capacity of the system. For example, solar panels of 100-Watt power exposed to 45° Celsius in summer will produce 75-Watt power.
_
But even though solar panels are more efficient in cold weather, they don’t necessarily produce more electricity in the winter than in summer. Because the sun is more directly overhead in summer months, a solar panel puts out more power than during the winter, when the sun’s rays are less intense, and the days are also shorter. Sunnier weather often occurs in the warmer summer months. In addition to fewer clouds, the sun is usually out for more of the day. So even though your panels may be less efficient in warm weather, they’ll still likely produce more electricity in summer than in winter. During the winter, solar panels will produce an average of 50% less energy compared to the summer. Less output is produced in the winter because the panels have less exposure to the sunlight. They will still work during the winter, but the output will be much larger during the summer months with additional sunlight. Understanding the role of weather conditions in solar panel performance can help maximize their output and lifespan, making them a more cost-effective investment.
_
Clouds play a significant role in determining the efficiency of solar power systems. Solar panels generate electricity by converting sunlight into electrical energy. While they can work under a range of weather conditions, their output is highest when they receive direct, unobstructed sunlight. During cloudy conditions, the amount of sunlight that reaches the panels is diminished, resulting in decreased power production. However, it’s important to note that solar panels do not entirely stop producing electricity on cloudy days. Solar radiation still reaches the earth’s surface, albeit in a diffused form, on overcast days. This diffused light can still be converted into electricity, although output of this process is lower compared to clear conditions. Research also shows that certain types of solar panels, such as thin-film panels and panels equipped with micro-inverters, can perform better under these conditions by optimizing the capture and conversion of diffused light. Depending on the cloud cover and the quality of the solar panels, the output of the solar panels’ electricity production commonly drops from 10 to 25 percent or more compared to a sunny day. In other words, solar power can still work well in typically cloudy, cold locations. New York, San Francisco, Milwaukee, Boston, Seattle are all cities that experience inclement weather, from rain and fog to blizzards, yet they’re also cities where people see huge savings by getting solar.
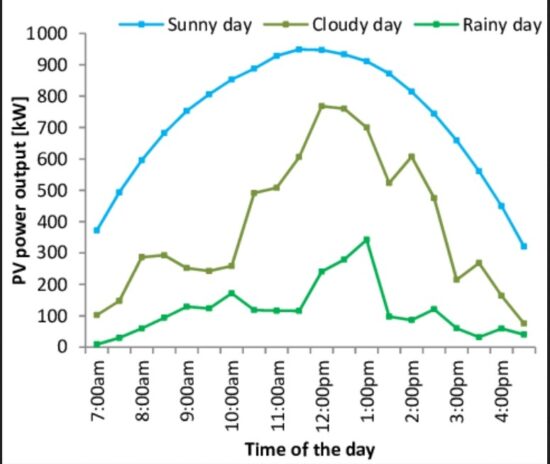
Figure above shows solar power output for different weather conditions: a sunny day (20 April, 2013), cloudy day (15 April, 2013) and rainy day (13 April, 2013).
_
How can you optimize weather conditions for solar panels?
Though controlling the weather isn’t a possibility, there are some steps you can take to make the most of the sunlight you get wherever you are in the country. Here are some best practices to increase solar power production levels.
-1. Place your solar panels in an area that receives maximum sunlight hours and exposure throughout the day. For homes in the Northern Hemisphere, this entails south-facing panels at a roof pitch of between 30 and 45 degrees.
-2. Avoid shading from trees, buildings, or other objects around your home.
-3. Keep your solar panels clean of dust, debris, or anything else that can damage the panels and reduce exposure.
-4. Use solar tracking systems that follow the sun’s movement throughout the day to help optimize placement and improve energy output.
-5. Ensure proper ventilation to your roof space to avoid any risk of overheating or extreme cold.
______
______
Eclipse caused 80% drop in New York solar power production:
The solar eclipse that passed over New York in April 2024 led to a sharp temporary drop in power production from solar panels. While it didn’t disrupt the power grid because solar provides such a small amount of the state’s energy, the event illustrated the need to anticipate similar occurrences in future years as solar and wind projects become more important in New York’s energy mix.
“In the hours leading up to the eclipse, solar resources generated just over 3,000 megawatts. As the eclipse crossed New York, solar generation declined to just under 600 MW by 3:30 p.m. ― an 80 percent reduction,” according to a report released by the New York Independent System Operator. The organization oversees and helps operate the state’s power grid, or system of interconnected power lines that move electricity from where it is generated to where it is needed.
Because solar at this point makes up a small percentage of the state’s power generation — less than 3 percent — other forms of generation were easily able to make up for the shortfall. “Hydro-pumped storage, conventional hydro facilities, and fossil-fuel resources were dispatched to make up for the reduced solar generation during that period,” stated the report, which also noted solar generation went back up to almost 1,200 MW at 4 p.m. on April 8, 2024 before dropping again as the sun started to set. A megawatt can power up to 1,000 homes.
_____
_____
Shading and solar energy:
Just like a battery, solar panels have two terminals: one positive and one negative. When you connect the positive terminal of one panel to the negative terminal of another panel, you create a series connection. When solar panels are wired in parallel, the positive terminal from one panel is connected to the positive terminal of another panel and the negative terminals of the two panels are connected together.
Solar panels wired in series increase the voltage, but the amperage remains the same. Solar inverters may have a minimum operating voltage, so wiring in series allows the system to reach that threshold. When wired in parallel, the amperage increases while the voltage stays the same, allowing you to produce the energy you need without exceeding the inverter’s voltage limits. Most solar panel systems are designed with both series and parallel connections.
_
Shading: Partial and Complete:
There are two types of shading to consider: partial and complete. Partial shading refers to when only a part of the solar panel is shaded. Depending on the extent and position of the shade, it can cause a considerable reduction in power output. Complete shading, on the other hand, is when the entire panel is shaded, stopping all solar cell energy production.
Sources of Shading:
Sources of shading can range from temporary objects like birds and fallen leaves to permanent structures like buildings and trees. Even dust and dirt accumulation on the panel surface can cause shading altering solar energy production process. It’s essential to be mindful of potential sources when installing solar panels.
Impact of Shading on Solar Panels:
Depending on your panel design and configuration, shading can affect your energy production in varying ways.
For Series Panels: In a series panel configuration, the impact of shading can be quite drastic. If even one panel is partially shaded, it can significantly reduce the output of the entire string.
For Parallel Panels: On the other hand, parallel configurations are a bit more resilient. If one panel is shaded, it only affects the production of that particular panel, not the whole array.
Technological Solutions to Counteract Shading:
Technological advancements have also provided some solutions to counteract the impact of shading.
Microinverters: Unlike traditional inverters that convert power for an entire string of panels, microinverters are installed on each panel. This means each panel’s performance is independent of the others, reducing the impact of shading on the whole system.
Power Optimizers: Power optimizers, like microinverters, are installed on each panel. They “condition” the DC power from the panel to maximize its output before sending it to a centralized inverter.
Bypass Diodes: Bypass diodes allow the current to bypass shaded cells, reducing power loss.
_____
Bypass diodes as solution to shading:
The standard test condition for solar irradiance is 1000W/m². This means that a 200W solar panel can only produce 200 watts if it’s receiving 1000W/m² of solar irradiance. When a solar panel is partially shaded, we intuitively think that the loss in power production is going to be proportional to the shaded area of the solar panel. This is not the case. Partial shading causes disproportional losses in energy production. In some cases, shading 10% of a solar panel can reduce its output power to 0 Watts. For example, shading the bottom 6 cells of a 60 cell solar panel can cause a 100% loss in power production.
When a solar panel is equally shaded, the amount of light it is receiving is very low. This does not always reflect on its voltage, but it directly affects the current. And since power is the product of voltage and current (Power = Voltage x Current), the power production is going to be mediocre. But what if only a portion of the solar panel is shaded, say… one or a few cells? If the solar panel is only partially shaded, depending on which cells are shaded and if the solar panel has working bypass diodes, it might still work. In general, solar panels can work in the shade, but the effects that shade has on solar panels might be different than what you would expect.
For example, in the image below, you can see that one shaded cell (out of 36 cells) can have an enormous impact on power production. This might seem strange but it is true.
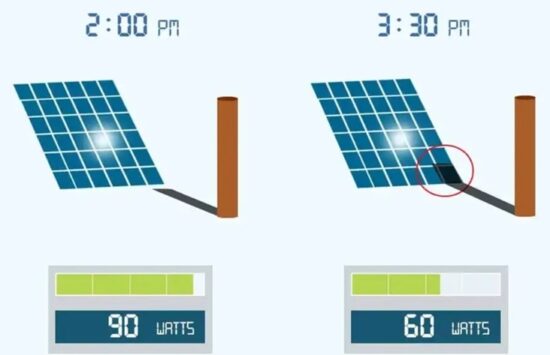
_
Effects of shading on a single solar cell:
A solar panel is made of individual solar cells, which are generally all connected in series (positive of cell connected to the negative of the next cell and so on). The standard individual solar cell produces around 0.2 Amps per square inch (about 0.03 Amps per square centimeter) and about 0.5 Volts.
When it is shaded, the amount of current a solar cell produces is proportional to the unshaded area. As long as it’s not completely blocked from light, the voltage of a solar cell doesn’t really react to shading. When 50% of the cell is blocked from sunlight, its current is cut in half. Its voltage on the other hand stays the same. When it’s completely blocked from sunlight, the shaded cell doesn’t have any outputs.
However, as mentioned above, a solar panel is a series connection of solar cells (e.g. 36 cells). This means that the effects of shade on the output of a solar panel are different than the effects on a single solar cell. For example, you could shade 10% of the area of a solar panel and end up with 0% output. When a solar panel is only partially shaded, the amount of power it produces does not only depend on how much of the solar panel is shaded, but also on which cells are shaded and the number of bypass diodes it has.
_
To understand the effects of shade on a solar panel, we must take a closer look at what makes a solar panel.
For example, the image below shows a 60-cell solar panel:
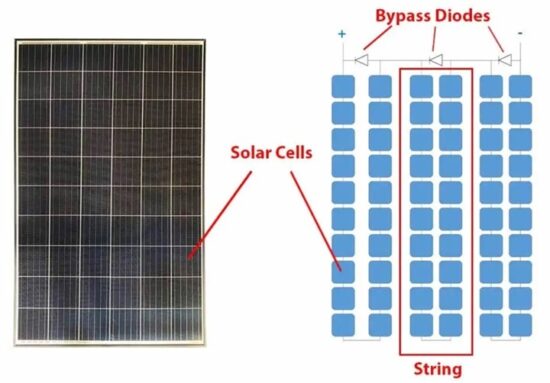
This panel consists of 60 solar cells, which are all connected in series. When exposed to sunlight (or light in general), each solar cell produces its own voltage and current.
The solar panel has 3 diodes, with each diode connected in parallel to a group of solar cells. This group of solar cells is referred to as a string. In this case, each string contains 20 cells.
Now let’s see exactly what are the effects of shading on a solar panel.
When a solar panel has one or a few of its cells under shade, the shaded cells receive a very low amount of light and therefore produce a very low amount of current.
When this happens, the whole string – that contains the shaded cell – experiences a drop in current.
For example, the image below shows a string of 20 solar cells:
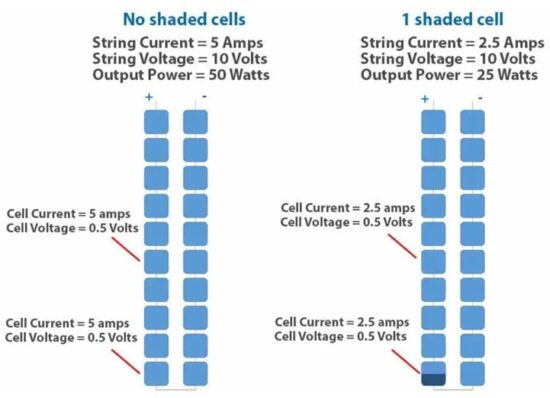
The image compares the output of the whole string when there is no shade vs when only one cell is shaded.
Basically, the current produced by the string will not exceed the current produced by the shaded cell.
Notice that only 50% of the cell is shaded, thus, it only produces 50% of the current. If the shaded cell was completely blocked from sunlight, it would produce 0 Amps, and the whole string would produce 0 Amps.
Even if the other cells are under optimal lighting conditions, their performance is limited by the performance of the shaded cell.
_
But where does the extra energy produced by the unshaded cells go?
When a solar panel has one or a few of its cells under shade, unless the bypass diodes are activated, the shaded cells will limit the power production and will consume the extra energy produced by the unshaded cells. So, not only does the shaded cell reduce the output of the whole string, but in doing so, it also consumes a big portion of what the other sunlit cells are producing. As a result, the shaded cell essentially becomes a resistor that turns electrical energy into heat.
In general, hotspots occur when one or some of the cells are blocked from sunlight, this can be due to shading, dirt, leaves, etc… In the long term, hot-spotting causes the overall performance of the solar panel to drop and accelerates the degradation of the affected solar cells. In some cases, it can even cause fires.
To mitigate these problems, manufacturers use bypass diodes that protect these shaded cells by ensuring that the current is flowing in the right direction.
However, in order for the bypass diodes to protect the shaded cell(s), a whole string of cells has to be bypassed.
Bypass diodes are generally activated when there’s a 20%-30%+ difference in the current. The unshaded cells are essentially trying to push current through the shaded cells. The shaded cells become resistive, the bypass diodes are then activated and serve as a less resistive path for the current. This allows the current to flow in the right direction, which in turn:
–Protects the shaded cells from overheating and prevents hot spotting.
–Reduces power losses by limiting the drop in current to only one string of the solar panel.
However, the way bypass diodes are wired to the solar cells, don’t really allow them to select which cells to bypass. In order to bypass the shaded cell, the diode short-circuits a whole string of cells. This means that one shaded cell causes the bypass diode to cut off a whole portion of the solar panel, and with it, a whole portion of the energy production.
In the example above, 20 out of 60 solar cells are bypassed because of one shaded cell. This means that around 33% of power production is lost. This seems like a worst-case scenario, but it isn’t. If the solar panel didn’t have bypass diodes, 100% of the power production would be lost. If it only had 2 diodes, 50% of production would be lost.
_____
_____
Half-cut cells as solution to shading:
Traditional monocrystalline solar panels usually have 60 to 72 solar cells, so when those cells are cut in half, the number of cells increases. Half-cut panels have 120 to 144 cells and are usually made with PERC technology, which offers higher module efficiency. The cells are cut in half, very delicately, with a laser. By cutting these cells in half, the current within the cells is also halved, which essentially means that resistive losses from traveling energy via current are reduced, which, in turn, equals better performance. Since the solar cells are cut in half, and are thereby reduced in size, they have more cells on the panel than traditional panels do. The panel itself is then split in half so that the top and bottom portions operate as two separate panels – generating energy even if one half is shaded. All of the cells on the panel’s top half are connected in one series, while those on the bottom are connected in a different series. This enables the panel to keep producing power in its upper half even when its bottom half is in shadow. They improve the power output and performance of solar modules because they offer a higher shade tolerance due to their unique wiring system. This means that if your home has some trees that cast shade onto your roof at certain times during the day, your entire solar panel will not be unusable, like it would with a traditional solar panel.
_____
_____
Summary of factors affecting the Solar Panel output:
If you are thinking about installing a solar system for your home, output is a key factor in determining the size and number of solar panels required. Various factors such as low maintenance, shading, roof orientation, or the type of roofing materials used can impact their output.
Let’s explore the factors that can make all the difference in ensuring solar panel output:
Geographic Location:
Geographical location plays a pivotal role in a successful solar panel installation. As the Earth orbits the sun on a tilted axis, regions closer to the equator reap higher energy production. Weather conditions like precipitation, pollution, and fog affect efficiency, yet solar panels can generate power even in cloudy conditions.
Time of Day:
Unlike daylight hours, peak sun hours refer to the time frame when solar irradiance hits a power density of 1,000 watts per square meter throughout one hour. Typically occurring between 11 am and 4 pm. These hours coincide with the sun’s highest position in the sky, ensuring optimal solar radiation for your panels.
Seasonal Changes:
When it comes to the solar system for home, understanding the influence of weather conditions is crucial. The angle and intensity of the sun’s rays vary throughout the year, necessitating adjustments in panel orientation.
Obstructions and Shading:
Don’t let objects or trees cast shadows on your solar panels, as shading can slash the efficiency of the solar system for your home by more than half. This detrimental effect can directly impact your solar system’s return on investment. To ensure uninterrupted sunlight, consider trimming branches and removing any obstructions. Trust professional solar installers for expert guidance on ideal solar panel placement, avoiding shadow blockage.
Roof Pitch and Orientation:
While solar panels facing directly east or west generate around 20% less electricity than south-facing systems, they still save you money. To cover all your electricity needs, consider installing a few extra panels. In the northern hemisphere, north-facing roofs are the least ideal for solar production. Explore alternatives like ground-mounted solar or carport installations to make the most of the solar system for your home.
Tilt angle:
Determining the ideal tilt angle for solar panels is very important for maximizing solar panel installation energy generation. The generally accepted principle is to align the panel’s tilt angle with the location latitude. By doing so, you can achieve the highest energy output possible. By adjusting the tilt angle, you can optimize the panels’ efficiency and enhance energy output. Setting the tilt angle close to the latitude value can optimize energy generation from solar panels.
Temperature:
Although sunlight is crucial for solar panel operation, high temperatures can reduce their efficiency. Heatwaves can significantly impact the efficiency of solar panels as they are designed to operate optimally between 15°C and 35°C, with peak performance at 25°C. Generally, a silicon solar panel’s efficiency drops by 0.3 per cent to 0.5 per cent for each degree Celsius over 25°C. Prolonged exposure to high temperatures can also cause increased wear and tear, potentially leading to microcracks and other physical damage over time. These factors result in lower efficiency, posing economic and operational challenges for the project. Since a considerable portion of the sunlight that hits the cells converts into heat, effective heat management is essential for enhancing solar panels’ efficiency and longevity. To keep your solar panels in good condition, ensure they have adequate ventilation and are cleaned regularly to prevent dirt from accumulating on their surfaces. If overheating is still a concern, consider investing in a cooling system.
Wind:
Wind can play a surprisingly relevant role in solar panel performance, with both negative and positive consequences. While a gentle breeze can help cool solar panels, improving their efficiency, strong winds, especially during storms or hurricanes, can put their structural integrity at risk. While there isn’t a specific hurricane classification for solar panels, most are engineered to endure wind speeds up to 140 mph. You can improve solar panel safety during installation using various methods, such as fasteners, through-bolting modules, or a three-frame rail system. Also, roof-top solar panels may be more vulnerable to wind damage than panels mounted on the ground due to increased exposure to high winds and gusts.
Humidity:
Humidity can have mixed impacts on the performance of solar panels, and it’s a factor that requires close attention, especially if you live in a region where high humidity levels are a regular occurrence. High humidity often leads to increased cloud cover and rainfall, which can sometimes decrease the amount of sunlight reaching the panels throughout the day.
As humidity generally refers to water in the air, it can also impact panels in three ways:
-1. Causing water droplets to form on the panel’s surface.
-2. Causing dirt and dust to stick to the panel’s surface.
-3. Increasing the likelihood of weather-related damage, such as rust, mold, and mildew.
These factors can negatively affect the panels’ performance and longevity.
But, when it comes to solar energy production, humidity can also play a more positive role. Water vapor in the air can scatter sunlight, causing it to hit the panels from different angles, potentially increasing the total irradiance.
Snow and ice:
It may seem counterintuitive to think of solar panels working well in cold weather with snow and ice. But with increased reflectivity of sunlight off snow can actually help make solar panels even more efficient. Cooler temperatures can also be a benefit with solar panels, though only to a point. Any snow or ice on the panels themselves can freeze and expand if the temperature drops below freezing. This can damage the solar cells or the panel structure.
There are two other potentially negative consequences of snow or ice on your solar panels:
-1. Reduced sunlight exposure:
When snow and ice accumulate on the surface of solar panels, less sunlight reaches the solar cells, resulting in a reduction in their energy output.
-2. Structural damage:
Accumulated snow and ice add weight and stress to the solar panel structure. Too much weight could potentially damage or collapse the panels.
Keeping an eye on your solar panels with regular cleaning and maintenance, especially in winter, can help prevent these potential effects.
_____
Optimal weather conditions for solar panels:
It is worth understanding the best weather conditions for the peak performance of solar panels. For maximum panel efficiency, you’ll need:
- Temperatures between 70 and 90°F
- Sunny days with minimal cloud cover
- Light breezes to keep the panels cool
- Low humidity
______
______
Solar panel at Night:
The reality is that the electricity generated by solar panels at night is minimal. On a perfect night, with no cloud cover and a full moon, a solar panel will only produce between 0.2%- 0.3% of the normal energy they would produce in direct sunlight. This amount of energy isn’t even enough to power a basic light bulb. On a clear night with a full moon, you should only expect 0.3% of the energy production that you would experience in direct sunlight. That means that if your solar panels typically produce 300 watts of power during the daytime, they will only generate roughly one watt in direct, full moonlight. Given that moonlight is just sunlight reflected off the moon, you’ll be relieved to learn that yes, solar panels can operate with moonlight. Your solar panels will, however, create very little power at night, even if the moon is shining directly on them with no clouds in the sky.
The latest solar technology has led to the development of anti-solar panels that can generate power during the night. The anti-solar panels use a thermoradiative cell to generate electricity as opposed to photovoltaic cells in conventional solar panels. While a solar panel is made from silicon to capture light in the visible spectrum, the anti-solar panel is made from materials (mercury alloys) designed for capturing extremely long-wavelength light. These specially designed panels capture the heat that is radiated from the earth in the form of infrared radiation during the night. Obviously, the process will generate less amount of power when compared to day-time generation figures. The inability to generate power at night is considered a major drawback of solar energy. With this technology, solar energy can be more reliable as well as a practical option in various industries. While widespread use of the technology will take some time, it will have a significant impact on the future of solar energy.
______
______
Section-10
Land factor:
People are concerned about the impacts of land use for energy production for several reasons. The first is the technical question of whether we even have enough land to produce all of our energy from particular sources at all. The second is an aesthetic concern about how much of our landscapes might be taken up by these technologies. The third is the impact of land use on natural habitats and the environment. To date, land use for solar energy is negligible compared to other human land uses. However, the obtained results show that in future scenarios, with a largely decarbonized electricity system, high penetration rates of solar energy will require significant amounts of land to be occupied by solar power plants. At 25–80% penetration in the electricity mix of those regions by 2050, we find that solar energy may occupy 0.5–5% of total land. According to a 2021 study, obtaining 25% to 80% of electricity from solar farms in their own territory by 2050 would require the panels to cover land ranging from 0.5% to 2.8% of the European Union, 0.3% to 1.4% in India, and 1.2% to 5.2% in Japan and South Korea. Occupation of such large areas for PV farms could drive residential opposition as well as lead to deforestation, removal of vegetation and conversion of farm land. However some countries, such as South Korea and Japan, use land for agriculture under PV, or floating solar, together with other low-carbon power sources. Worldwide land use has minimal ecological impact. Land use can be reduced to the level of gas power by installing on buildings and other built-up areas.
_
The technologies harnessing renewable energy sources are characterized by a power density several orders of magnitude lower than fossil fuels. As a consequence, the transition to these sources of energy is expected to intensify the global competition for land. For example, the sprawl of bioenergy has been already identified as the major driver of recent land use change (LUC) in developed regions. Increasing land competition can cause various environmental impacts intensifying biodiversity loss, water use or indirect land use change (iLUC) emissions. The latter refers to emissions produced by using cropland for energy purposes and, therefore, indirectly increasing land competition elsewhere in the world to meet global food demand, potentially replacing land with high carbon stocks, such as natural forests. For example, the literature estimates that the indirect land competition induced by liquid biofuels in developed regions leads to global land clearing and associated iLUC emissions higher than the emission savings achieved by replacing gasoline by these biofuels during 30 years.
_
For sources of renewable energy other than bioenergy, land requirements and the associated environmental impacts remain understudied in the literature from a quantitative point of view. In the case of solar energy, the land competition element is usually expected to be negligible due to its higher relative energy density compared to bioenergy and the possibility to integrate it in urban areas or non-productive land, and as such is currently excluded from official statistical reporting and integrated assessment models (IAMs). However, recent studies based on satellite views of utility-scale solar energy (USSE) under operation, either in the form of photovoltaics (PV) or concentrated solar power (CSP), show that their land use efficiency (LUE) is up to six times lower than initial estimates. Applying such observed LUEs accordingly reduces the potential contribution of solar on rooftop space.
_
The installation of USSE on land is subject to a diversity of constraints: solar resource constraints, which are related to the solar irradiance in a certain area; geographical constraints such as the slope and the existing use of the land; and regulatory constraints, e.g. the protected status of the land, often related to ecosystem and wildlife preservation. Therefore, where available, deserts and dry scrubland with high solar irradiance and which are generally not suitable for human activities, are used or planned to be used for solar energy. However, beyond hard restrictions, other features such as the lack of road, electricity and water infrastructures, and the distance from human settlements complicate the large scale construction, operation and maintenance of solar power in these areas. On top of that, spatial frictions might occur if land which is made available for solar energy by national or local governments is in reality a biodiversity hotspot or the home of human communities. Recent developments show that USSE in densely populated countries is often installed on arable land that is used or potentially suitable for other productive uses such as agriculture or forestry, intensifying land competition for the same reasons as the sprawl of bioenergy does. Furthermore, clearing currently vegetated land for USSE also has local impacts on biodiversity, carbon cycling and aesthetics.
_
Use of non-competing space on rooftops and in deserts and dry scrublands:
Rooftop space is often used for smaller scale PV systems and has the advantage of not competing for space with other uses and avoiding some of the losses related to electricity transmission and distribution. On the other side, rooftop spaces are often not optimal, and only about 2 to 3% of urbanized surface area can be used for PV systems with reasonable efficiencies (taking into account specific factors such as roof slopes and shadows between buildings). Taking these constraints into account, rooftop space is limited to 3% of expected urbanized land by 2050 in each geo-political region, while non-optimality of rooftop space has been modelled through a supply curve which represents increasing capital costs for each additional space used for rooftop PV systems.
Land that is not used and neither has potential for any other productive use from a human perspective, such as deserts and dry scrublands, can be suitable for solar energy. By default, deserts are exempted from land competition in Global Change Assessment Model GCAM, while only 10% of current scrublands are included in the land competition module in GCAM v4.3, taking into account both non-fertility of scrublands as well as the protected status of some of these land areas. The EU, Japan and South-Korea have limited amounts of deserts and scrublands, and of which a significant share is protected. Therefore, apart from the 10% of scrublands which enter by default into the land competition module, there is no additional availability of suitable deserts and scrublands for solar energy in these regions. For India, the pre-identified potential for PV and CSP capacity in identified “wasteland” is included to the model as an alternative to competitive land.
_
A combination of technical and geopolitical reasons complicates the installation of solar energy far from consumption points. Therefore, a high share of solar generation in the energy mix in relatively densely populated regions with high per capita energy demands can require a significant share of domestic land, comparable to the current built-up area in these regions. The most relevant factors influencing the land use per unit of solar energy are solar irradiation, latitude, and future solar module efficiencies. At the domestic level, solar energy is found to predominantly compete for land with cropland and managed forests, while on a global scale, 27 to 54% of the land required for solar energy is found to indirectly displace unmanaged forests, predominantly outside the region where the solar energy is consumed.
_____
_____
Which sources of energy require the least amount of land?
One part of the total land use is the space that a power plant takes up: the area of a coal power plant, or the land covered by solar panels. More land is needed to mine the coal, and dig the metals and minerals used in solar panels out of the ground. To capture the whole picture, we compare these footprints based on life-cycle assessments. These cover the land use of the plant itself while in operation; the land used to mine the materials for its construction; mining for energy fuels, either used directly (i.e. the coal, oil, gas, or uranium used in supply chains) or indirectly (the energy inputs used to produce the materials); connections to the electricity grid; and land use to manage any waste that is produced.
In the chart below we see how the different energy sources compare. Here we’re only looking at key sources of electricity – since oil is predominantly used to transport, it’s not included. Their land use is given in square meters-annum per megawatt-hour of electricity produced. This takes account of the different capacity factors of these sources i.e. it is based on the actual output from intermittent technologies like solar or wind.
Land use of energy sources per unit of electricity is depicted in figure below:
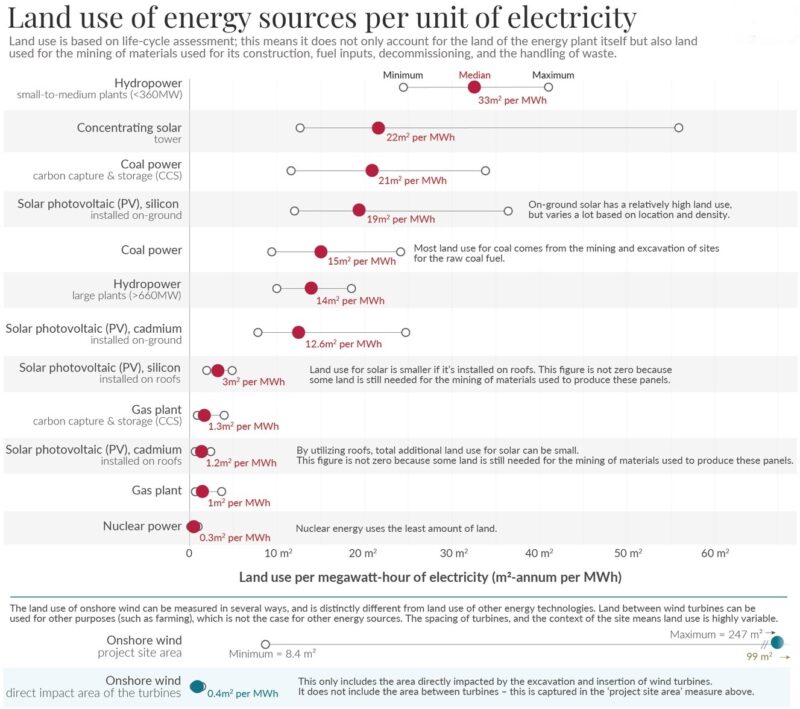
First, we see that there are massive differences between sources. At the bottom of the chart, we find nuclear energy. It is the most land-efficient source: per unit of electricity it needs 50-times less land compared to coal; and 18 to 27-times less than on-ground solar PV.
Second, we see that there are large differences within a single energy technology. This is shown by the wide range from the minimum to the maximum land footprint. This shows that land use depends a lot on how the technology is deployed, and the local context.
Solar energy is one example where the context and type of material matter a lot. Solar panels made from cadmium use less energy and materials than silicon panels, and therefore use less land per unit. It also matters a lot whether you mount these panels on rooftops or on the ground. Rooftop solar obviously needs much less additional land; we’re just using space that is already occupied, on top of existing buildings. However, they do need some land over their life-cycle because they still require mining of the materials to make them, as well as the energy (mostly electricity) used in refining the silicon. Finally, the density and spacing of the panels also makes a difference.
Wind is the most obvious electricity source that we should consider differently when it comes to land use. You find it separated from the other sources, at the bottom of the chart. There are several reasons for this. First, offshore wind takes up space, but it’s marine, not land area. Second, onshore wind is different from other electricity sources because you can use the land between turbines for other activities, such as farming. This is not the case for a coal, gas or nuclear plant. This means the land use of wind farms is highly variable.
Take the Roscoe Wind Farm in Texas, which uses 184 m2 per MWh. This is a large project, where farmers can generate additional income through electricity production while they continue their farming operations between the wind turbines. The wind farm is almost a secondary land use. This contrasts with much more dense wind farms, such as Fântânele-Cogealac in Romania, or the Tehachapi Pass in California, where energy production is the primary land use. These can have a small land footprint of just 8 m2 per MWh.
Our choices around where and how we deploy wind energy mean that it could use a lot of land, or possibly, less land than we use today.
Some suggest that we could apply the same principle to solar energy. In the UNECE assessment – the numbers shown on the above chart – the surface area of solar panels is counted in its direct land use. But, not all analyses count this in the same way. Some suggest that, because the land underneath solar panels can sometimes be used for other purposes (such as farming), it should be counted as ‘co-used land’. There is evidence that these agrivoltaic systems, where PV panels are installed on agricultural land, could be great examples of shared land. Recent studies show that, under certain conditions, the yield of agrivoltaic crops can even increase compared with conventional crops, because of better water balance and evapotranspiration, as well as reduced temperatures.
That highlights an important point: the costs of land use can vary a lot depending on where energy sources are built, and what the alternative uses of that land are. An energy source expanding into natural habitats or forests is not the same as building a solar farm in an unproductive desert.
Assessing our low-carbon energy transition as a whole: it might not take as much land as we assume. A transition built solely on nuclear power would need much less land than we use today. One built solely on renewables might require more land, but perhaps not much more.
Given the fact that transitioning to low-carbon energy technologies would prevent millions of premature deaths each year from air pollution, and tackle climate change, a small increase in land use – especially on unproductive lands – seems like a reasonable price to pay.
______
______
Capacity factor and land use:
The capacity factor of a power plant is the ratio of its actual output over a period of time, to its potential nominal output if operating constantly at full nameplate capacity over the same period of time. It basically measures how often a plant is running at maximum power. A plant with a capacity factor of 100% means it’s producing power all of the time. The capacity factor is the measure of a plant’s productivity. More specifically, the capacity factor of a power plant is equal to the amount of electricity produced for a given time, divided by the amount of electricity that would have been produced if the plant was running continuously at its installed capacity for that time. Here is a comparison of typical capacity factors for different energy sources:
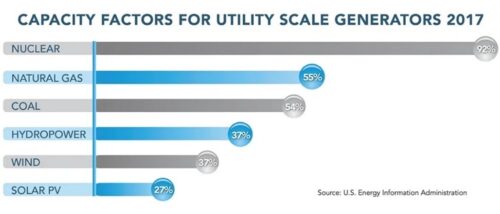
As you can see, nuclear energy has by far the highest capacity factor of any other energy source. This basically means nuclear power plants are producing maximum power more than 92% of the time during the year.
That’s about nearly 2 times more as natural gas and coal units, and almost 3 times or more reliable than wind and solar plants.
_
A typical 1GW nuclear power plant with a capacity factor of about 90% requires 1.3 square miles (3.4km2) of land. A typical nuclear reactor produces 1 gigawatt (GW) of electricity. That doesn’t mean you can simply replace it with a 1-gigawatt coal or renewable plant. Based on the capacity factors above, you would need almost two coal or three to four renewable plants (each of 1 GW size) to generate the same amount of electricity onto the grid.
Photovoltaic (PV) solar farms have relatively low capacity factors because unsurprisingly, the PV panels do not generate electricity at night or less on cloudy days. The capacity factor of solar PV varies from 17–28%. Thus to generate the same amount of electricity as the aforementioned nuclear plant, a solar farm would need an installed capacity of 3.3–5.4GW, requiring between 45–75 square miles (116–200km2).
Like solar, because of wind power’s intermittence, the capacity factor of wind power is on the lower side and ranges from 32–47%. To match the electricity output of the nuclear power plant, a wind farm would need to have an installed capacity of 1.9–2.8GW. While wind power has a higher capacity factor than solar power, wind farms require a lot more land because the wind turbines need to be spaced very far apart and thus the equivalent wind farm would require between 260–360 square miles (670–930km2)! Solar requires significantly more land than nuclear, and wind requires even more than solar.
_
PV solar requires about 50x more area than nuclear to generate the same amount of electricity. However, one of solar’s great advantages is its modularity and flexibility and the fact that the panels do not necessarily need to be installed on the ground directly. Solar panels can be installed on homes and buildings, parking lots, highways, even canals.
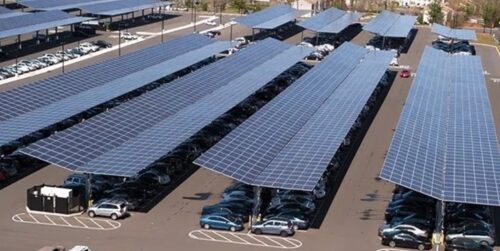
Solar parking lots like the one in above image not only generate electricity but also provide shade for the cars, all without requiring direct land use. Also, a new sector that is developing quickly is agrivoltaics, the dual-use of land for both PV solar and agriculture. The solar panels are elevated on fixed support systems about 4 meters above the crop field. This configuration allows to double up on generating electricity and producing crops for regions with limited land resources. Agrivoltaics installation panels help to retain moisture in the soil and boost crop growth. As these examples demonstrate, solar does not necessarily require direct and unique land. Moreover, solar farms can also be installed in places that people do not frequent and which are not suitable for agriculture — namely deserts and “brown fields” (closed landfills, old coal mines, even Chrenobyl hosts a 1MW solar farm).
Wind power requires 200x more land than nuclear — which seems quite astonishing. The direct land footprint of a wind turbine is actually quite small, but for a wind farm generally composed of 50–100 wind turbines (or sometimes up to thousands), the turbines must be spaced very far apart to avoid obstacles and wind turbulence. The general rule-of-thumb for spacing between two turbines is 7 rotor diameters (1 rotor diameter is equal to twice the length of a blade).
______
______
Estimating the land footprint of solar:
The size of a solar farm defines how much electricity it creates. The bigger the solar farm, the greater the power output. In fact, instead of using a land measurement to describe the size of a solar farm, they are classified according to how much electricity they can generate from the sun. This quantity is called their capacity to generate electricity. Capacity is measured in watts, the standard unit for electrical power.
_
Each kilowatt requires 100 sq. ft solar panel. This is the standard area used in calculations of this sort. A 5 MW (megawatt, where 1 MW = 1,000 kW) solar farm would require a minimum of 100 x 5,000 = 500,000 sq. ft. Given the equivalence of 1 acre = 43, 560 sq. ft., that works out to be about 11 ½ acres needed for a 5 MW solar park. Note that’s just for the panels. Figure in an additional 8-10 acres more to house other solar system hardware plus the space needed between rows to avoid shading (and consequent power loss) as well as space for periodic array maintenance and allowing path for vehicle movement. That brings the total for a 5 MW solar farm to 11.5 + 10 acres = 21.5 acres. This is a conservative estimate.
The amount of land required for a 5 MW solar farm depends on various factors, such as the type of solar panels used, panel efficiency, spacing, and local solar irradiance. In general, a rough estimate for the land area needed for a solar farm is about 4 to 6 acres per megawatt (MW) of installed capacity. Considering this range, a 5 MW solar farm would require approximately 20 to 30 acres (8 to 12 hectares) of land. Keep in mind that these figures are rough estimates and the actual land requirement for your specific project may differ. Other sources suggest 6-8 acres for each megawatt of power produced is needed to build a profitable solar farm. Note that as PV module technological improvements result in higher panel efficiencies, fewer acres per megawatt will be needed.
_
Here’s a table of information that gives you a better idea of how much land is required for solar farms of various capacities. The data are derived from a National Renewable Energy Laboratory (NREL) 2013 report.
|
Technology |
Direct Area |
Total Area |
||
|
|
Capacityweighted average land use (acres/MWac) |
Generationweighted average land use (acres/GWh/yr) |
Capacityweighted average land use (acres/MWac) |
Generationweighted average land use (acres/GWh/yr) |
|
Small PV (>1 MW, <20 MW) |
5.9 |
3.1 |
8.3 |
4.1 |
|
Fixed |
5.5 |
3.2 |
7.6 |
4.4 |
|
1-axis |
6.3 |
2.9 |
8.7 |
3.8 |
|
2-axis flat panel |
9.4 |
4.1 |
13 |
5.5 |
|
2-axis CPV |
6.9 |
2.3 |
9.1 |
3.1 |
|
Large PV (>20 MW) |
7.2 |
3.1 |
7.9 |
3.4 |
|
Fixed |
5.8 |
2.8 |
7.5 |
3.7 |
|
1-axis |
9.0 |
3.5 |
8.3 |
3.3 |
|
2-axis CPV |
6.1 |
2.0 |
8.1 |
2.8 |
|
CSP |
7.7 |
2.7 |
10 |
3.5 |
|
Parabolic trough |
6.2 |
2.5 |
9.5 |
3.9 |
|
Tower |
8.9 |
2.8 |
10 |
3.2 |
|
Dish Stirling |
2.8 |
1.5 |
10 |
5.3 |
|
Linear Fresnel |
2.0 |
1.7 |
4.7 |
4.0 |
Notes about the table above:
The “ac” written after the wattage unit stands for alternating current. This refers to the electricity that has already been transformed from the direct current (DC) electricity produced by the PV array. AC current is necessary for integration with electric grid power lines.
Fixed panels do not move along with the sun. Single- and dual-axis trackers move the PV modules up and down and from left to right during the day in order to capture the maximum amount of sunlight all the time. CPV is an advanced solar technology.
_
NREL found total land-use requirements for solar power plants to have a wide range across technologies. Generation-weighted averages for total area requirements range from about 3 acres/GWh/yr for CSP towers and CPV installations to 5.5 acres/GWh/yr for small 2-axis flat panel PV power plants. Across all solar technologies, the total area generation-weighted average is 3.5 acres/GWh/yr with 40% of power plants within 3 and 4 acres/GWh/yr. For direct-area requirements the generation-weighted average is 2.9 acres/GWh/yr, with 49% of power plants within 2.5 and 3.5 acres/GWh/yr. On a capacity basis, the total-area capacity-weighted average is 8.9 acres/MWac, with 22% of power plants within 8 and 10 acres/MWac. For direct land-use requirements, the capacity-weighted average is 7.3 acre/MWac, with 40% of power plants within 6 and 8 acres/MWac. Other published estimates of solar direct land use generally fall within these ranges.
_
Land Requirements for Utility-Scale PV: An Empirical Update on Power and Energy Density, 2021 study:
The rapid deployment of large numbers of utility-scale photovoltaic (PV) plants in the United States, combined with heightened expectations of future deployment, has raised concerns about land requirements and associated land-use impacts. Yet our understanding of the land requirements of utility-scale PV plants is outdated and depends in large part on a study published nearly a decade ago, while the utility-scale sector was still young. Authors provide updated estimates of utility-scale PVs power and energy densities based on empirical analysis of more than 90% of all utility-scale PV plants built in the United States through 2019. Authors use ArcGIS to draw polygons around satellite imagery of each plant within their sample and to calculate the area occupied by each polygon. When combined with plant metadata, these polygon areas allow them to calculate power (MW/acre) and energy (MWh/acre) density for each plant in the sample, and to analyze density trends over time, by fixed-tilt versus tracking plants, and by plant latitude and site irradiance. Authors find that the median power density increased by 52% for fixed-tilt plants and 43% for tracking plants from 2011 to 2019, while the median energy density increased by 33% for fixed-tilt and 25% for tracking plants over the same period. Those relying on the earlier benchmarks published nearly a decade ago are, thus, significantly overstating the land requirements of utility-scale PV.
Updated benchmarks as of 2019 established by this study are as follows.
-1) Power density: 0.35 MWDC/acre (0.87 MWDC/hectare) for fixed-tilt and 0.24 MWDC/acre (0.59 MWDC/hectare) for tracking plants.
-2) Energy density: 447 MWh/year/acre (1.10 GWh/year/ hectare) for fixed-tilt and 394 MWh/year/acre (0.97 GWh/year/hectare) for tracking plants.
While these are nationwide, median benchmarks, this study also illuminates how the latitude of and irradiance at each plant site can cause individual plant densities to diverge from the medians, and how one might adjust the median benchmarks to account for that divergence.
_
Factors that can influence the land requirements include:
-1. Panel efficiency: Higher efficiency solar panels generate more electricity per unit area, potentially reducing the amount of land needed.
-2. Type of solar mounting system: The choice between fixed-tilt or tracking systems will impact the spacing requirements between solar panels. Tracking systems typically require more space as they need to avoid shading each other as they follow the sun’s path across the sky.
-3. Spacing between rows: To minimize shading and improve airflow, rows of solar panels need to be spaced appropriately. More spacing might be needed in regions with lower sun angles or to accommodate maintenance and cleaning equipment.
-4. Terrain and site characteristics: The land’s topography, soil type, and environmental constraints, such as floodplains or protected habitats, will also influence the amount of usable space within a given area.
-5. Additional infrastructure: Don’t forget to account for space needed for access roads, electrical equipment, inverters, transformers, and substations, as well as any buffer zones or setbacks required by local regulations.
Before planning a solar farm, it’s essential to perform a detailed site analysis, consider local permitting requirements, and consult with an experienced solar project developer to obtain a more accurate estimate of the land area needed for your specific project.
_
How much does it cost to set up a solar farm?
According to the latest national average cost figures from the Solar Energy Industries Association (SEIA) taken from their second quarter (Q2) report of 2021, the turnkey installation cost of non-residential and fixed tilt utility PV ranges between $0.77 to $1.36 per watt. By comparison, a residential rooftop or ground-mounted solar system costs between $2.50 and $3.50 per watt. When buying in large quantities for solar farm projects, solar developers save on equipment costs. Generally, solar developers pay a total installation cost of $3 million per megawatt to build a solar farm (excluding the cost of land). This amounts to about $500,000 per acre. For a quick return on investment, solar developers are usually unwilling to build a solar farm under 1 MW in capacity. However, for land that is optimally suited to yield a quick return on investment, they may consider it.
_____
_____
Does Solar Power deplete farmlands of rich soil?
Farmers are leasing land in the Midwest for solar development as the industry moves there due to the government’s massive subsidies, and the area’s cheap rents, access to transmission and wide-open spaces. While the leases provide for damage control, the land is being depleted of its rich top soil as the solar developers build their roads and other infrastructure. Solar power is just one more industry that is removing important farmland from production by offering much higher rents for the land than farmers can afford to pay. The target for solar operations is increasingly in the Midwest, where government handouts to solar allow them to pay more to rent land than the farmers providing food for the nation. Unless government policy lavishing benefits on solar power changes, a large amount of farmland will be converted to solar power to meet Biden’s climate goals, removing it from crop production. Despite the growing number of acres being converted to solar power use, the real issue is the quality of the land coming out of production, and what that means for local economies, state economies and the country’s future abilities to provide food for Americans. Farmland preservation groups believe 83 percent of new solar installations will come from farm and ranch lands with half of these installations on the richest land for food and crops.
Example of Damages to Cropland:
In 2019, one Indiana farmer leased about 445 acres of his 1200 acre farm near Whitfield to Dunns Bridge Solar LLC for one of the largest solar developments in the Midwest. According to the solar lease, Dunns Bridge would use “commercially reasonable efforts to minimize any damage to and disturbance of growing crops and crop land caused by its construction activities” outside the project site and “not remove topsoil” from the property itself. Sub-contractors, however, graded the fields to assist in the building of roads and installation of posts and panels, despite warnings that it could make the land more vulnerable to erosion. The crews spread fine sand across large stretches of rich topsoil. Much of the land beneath the panels is now covered in yellow-brown sand, where no plants grow. The Dunns Bridge Solar project is a subsidiary of NextEra Energy Resources LLC, the world’s largest generator of renewable energy from wind and solar. According to the company, it would review any remedial work needed to the land at the end of its contract in 2073, as per the terms of the lease agreement.
Counterview:
A spokesperson from the National Farmers Union (NFU), which represents tens of thousands of farmers in England and Wales say that their “preference” is that solar farms are built on lower quality agricultural land. But they add: “Renewable energy production is a core part of the NFU’s net-zero plan and solar projects often offer a good diversification option for farmers.” Kevin McCann, policy manager at trade body Solar Energy UK, says: “Solar is also helping to keep UK farmers in business, by providing them with a stable revenue stream. More solar also means less dependence on gas, which is the reason why the UK is in a cost of living crisis.” Land used for solar power can still be used for farming both livestock and crops, often with little negative impact on yields. As planning permission for solar projects is not granted on a permanent basis, the land in question is technically only temporarily out of use and could even improve in quality while not being farmed. Also, solar projects will not necessarily be built on farmland. The Department for Environment, Food and Rural Affairs (Defra) has made it clear that climate change, not solar power, is the “biggest medium- to long-term risk” to the nation’s domestic food supply.
______
______
Agrivoltaics:
Agrivoltaics is the dual use of land for solar energy production and agriculture. The technique was conceived by Adolf Goetzberger and Armin Zastrow in 1981. Agrivoltaics includes multiple methods of combining agriculture with photovoltaics, according to the agricultural activity, including plants, livestock, greenhouses, and pollinator support. Agrivoltaic practices and the relevant law vary from one country to another. In Europe and Asia, where the concept was first pioneered, the term agrivoltaics is applied to dedicated dual-use technology, generally a system of mounts or cables to raise the solar array some three to five metres above the ground in order to allow the land to be accessed by farm machinery, or a system where solar paneling is installed on the roofs of greenhouses. By 2019, some authors had begun using the term agrivoltaics more broadly, so as to include any agricultural activity among existing conventional solar arrays. As an example, sheep can be grazed among conventional solar panels without any modification. Likewise, some conceive agrivoltaics so broadly as to include the mere installation of solar panels on the roofs of barns or livestock sheds. Because the sunlight is shared, system design requires trading off objectives such as optimizing crop yield, crop quality, and energy production. Some crops benefit from the increased shade, lessening or even eliminating the trade-off.
_
In an agrivoltaic system, crops can be planted below and among raised photovoltaic panels. The idea is that if you put the solar panels on top of the crop fields, you might get benefits from both worlds. Because many crops do not need the full amount of light that the sun provides, that “extra sunlight” can be harnessed for energy generation. However, agrivoltaic installations are not just limited to growing crops. Agrivoltaics can mean 1,000 acres of pollinator habitat and native vegetation providing ecosystem services. It can also mean 500 acres of sheep-grazing underneath the panels. It can also mean five acres of someone growing tomatoes and peppers and watermelon underneath the panels. Japan is a world leader in agrivoltaics, with the first installations in that country coming online in 2004. According to a 2021 paper, Japan has nearly 2,000 agrivoltaic installations and more than 120 different crops are grown beneath the panels. The country also started the world’s first national funding programme to promote the technology, nearly a decade ago. Today, examples of agrivoltaic installations can be found around the world, with pilot projects or working agrivoltaic farms on every inhabited continent. In the US, the vast majority of agrivoltaic installations are on land that is used either for native pollinator habitat or grazing land.
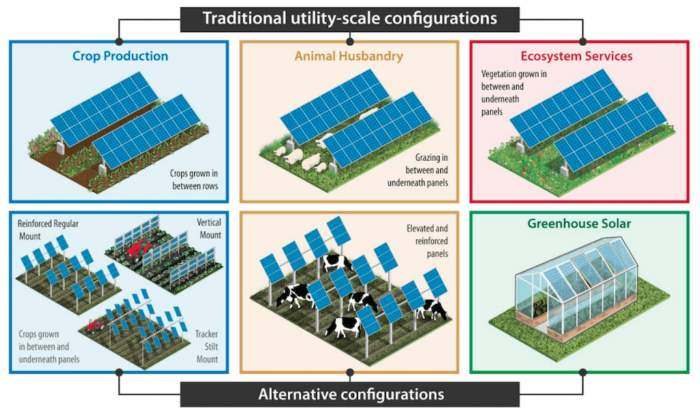
Figure above shows several types of agrivoltaic configurations.
In 2021, the energy-generating capacity of all agrivoltaic systems worldwide exceeded 14 gigawatts, according to the Fraunhofer Institute for Solar Energy Systems, which notes that this capacity has “increased exponentially” since the early 2010s. The institute also projects that Germany alone has the potential to generate 1.7 terawatts of power from agrivoltaic systems.
The growing interest in agrivoltaics reflects a growing recognition of the vulnerability of agriculture to climate change. What has become abundantly clear across the world is that climate change is absolutely here and it’s affecting every sector of our human lived experience, and it’s especially pertinent in terms of agriculture and land use and land sustainability. Given the sort of reality of climate change that is being felt in real time now versus even five or six years ago, people are much more willing to consider and think about putting in solar production, both as a climate mitigation strategy, but also as a farm mitigation strategy. Photovoltaic cells on a farm can provide an extra, stable source of income for farmers whose yields may become increasingly erratic due to climate change and increasingly frequent weather extremes. Solar arrays can give footholds for small farms to remain in families, because it provides a constant stream of income versus crops which can fail or the prices can fluctuate.
_
What are the impacts of solar panels on farming?
The effects of agrivoltaic arrays on crops is an active area of research, with some crops lending themselves to the system better than others. For example, tall fruit and nut trees that grow above the elevated solar panels can block the panels and reduce their electricity generation. But other plants, such as leafy greens or berries, can benefit from the extra shade provided by the panels. In general, agrivoltaics do well with low-growing crops that are typically harvested by hand and, therefore, do not require new, specialised equipment that can navigate the solar array.
_
A wide range of crops, including tomatoes, basil and pasture grass, have been experimentally shown to have comparable yields in agrivoltaic systems as in conventional farming. On grazing lands, solar arrays increase the forage quality, the water and nutrient content of plant matter and reduce water demand. For example, a 2018 study in Oregon in the US found that grazing grasses grew better in the shade of solar panels, with “dramatic gains in productivity” providing 90% more biomass through the summer thanks to the areas under the panels being 328% more water efficient.
The panels can benefit livestock, too. A four-year trial in Australia found that wool from merino sheep improved in both quality and quantity on farms that had installed solar panels. This was down to the “panels providing shelter for the sheep and grass.
_
Just as the choice of crop can affect the potential of an agrivoltaic system, so too can the climate and location. In the western US, where there is an “abundance of sun” and a lack of water, agrivoltaic research has had “very promising” results. In arid regions, the shade provided by photovoltaic panels can improve water retention and protect delicate plants. The added shade can also be beneficial to farm labourers and grazing livestock during the heat of the day. By contrast, the research has shown “much more nuanced results” in the northeastern US. During a typical summer, agrivoltaics have resulted in depressed yields of some crops. But in unusually hot or dry summers, the results are similar to those seen in arid regions. So agrivoltaics may be able to help mitigate some of the climate extremes.
_
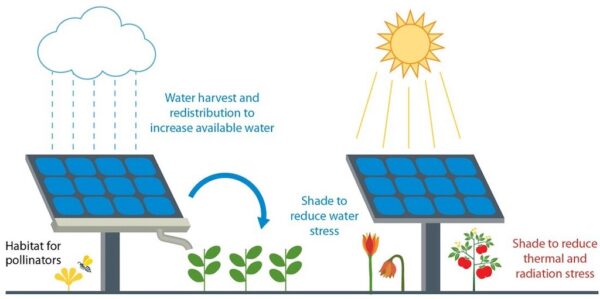
Figure above shows some of the potential benefits of agrivoltaic systems.
_
While much of the agrivoltaic research on crops has focused on vegetables, there is growing evidence that such setups can be profitable in “major crop” systems – those that grow staple crops such as rice, wheat and maize, which are typically less shade-tolerant.
A 2019 study found that stilt-mounted photovoltaic panels could be installed on cornfields without reducing maize production. And a recent study found that agrivoltaics deployed on rice paddies “will always be profitable” due to the relative prices of crops and electricity. With the right governmental policies and strategies in place, smallholder farmers could lease their land to energy companies in return for a portion of the profits from the panels.
_
Just as photovoltaics can affect the crops below them, the crops can influence the efficiency of the panels above. One 2019 study found that photovoltaic energy production potential is actually greater over croplands than other types of land because of the cooling effect of the crops’ evapotranspiration. What that study does not take into account, is that the increased relative humidity can hasten the panels’ degradation. Instead of the 25-year lifespan of a conventional photovoltaic array, an agrivoltaic array may only last 20 years, which should be taken into account when planning such an array and evaluating its economic potential.
_____
Electric farms in Japan are using solar power to grow profits and crops in 2022:
In many respects, Takeshi Magami’s farm is like any other in Japan, growing everything from potatoes to ginger and eggplants. But one major difference sets it apart from its neighbors: the 2,826 solar panels perched above the crops. The panels, covering much of the one hectare (2.5 acres) of land in the tranquil countryside in Chiba Prefecture, serve a dual purpose. They supply nearly all the power needed to run the farm, and are a source of extra income by selling surplus renewable energy to the grid. For Magami that can mean ¥24 million ($187,000) of additional revenue a year, eight times more than the maximum ¥3 million generated from his produce. While he benefits from generous tariffs that have since been reduced, it’s an indication of the added value available to farms in Japan and globally.
______
Agri-PV in Portugal: How to combine agriculture and photovoltaic production, a 2024 study:
Energy is one of the main topics being discussed by governmental institutions, mainly due to today’s society’s high dependence on non-renewable energy sources and the clear evidence of global warming by climate change. With this problem and the fact that the world’s population is growing, another problem arises which is the lack of food worldwide. One solution for these problems is combining solar PV systems with agriculture in a dual-land usage setup creating the concept of Agri-PV. The present research work aims to study the viability of implementing Agri-PV in Portugal, a country with good climate characteristics of solar production, in financial, production and environmental terms. The case studies consist of two Agri-PV applications, spaced and elevated PV rows with distinct layouts, and a regular PV implementation for comparison reasons. Both applications are considering selling all the energy produced by the panels, to have a clear image for the financial analysis, but since is a bit unrealistic scenario, the self-consumption study with Agri-PV application was made with certain assumptions to cover the agriculture expenditures. Results have shown that combining agriculture with photovoltaic systems can be very beneficial from energy production and a financial point of view, where despite the considerable initial investment cost, the payback time does not surpass more than 5 years and it is concluded that Agri-PV worth more than only PV or only agriculture productions. Agri-PV is a solution simultaneously to the food and energy global challenges.
______
______
Solar power plant and rainwater harvesting:
Solar panels can also be used for harvesting most of the rainwater falling on them. Drinking or breweries water quality, free from bacteria and suspended matter, can be generated by simple filtration and disinfection processes, as rainwater is very low in salinity. Good quality water resources, closer to populated areas, are becoming a scarcity and increasingly costly for consumers. Exploitation of rainwater for value-added products like bottled drinking water makes solar PV power plants profitable even in high rainfall and cloudy areas by the increased income from drinking water generation.
The concepts of combining solar PV and agriculture, dubbed “agrivoltaics” (Dupraz et al., 2011) or dual-use of water for both solar PV and aquaculture, called “aquavoltaics” (Pringle et al., 2017) or a PV power system floating on a water source, defined “floatovolatics (FV)”, are appropriate works for sustainability. Santra (2018) performed rainwater harvesting in an agri-voltaic system. Interspace area (49% of the total installation area) and below panel area (24% of the total installation area) were used for crop cultivation. The idea and practices of collecting rainwater from roofs are widely used. Agrivoltaics and aquavoltaics concepts have been frequently mentioned recently. Although there are many PV power plants around the world, we need to study rainwater collection in these plants. Here is one such study.
Rainwater harvesting in 600 kW solar PV power plant, a 2021 study:
This study has been tried to find a solution to the water scarcity caused by climate change by conducting regional studies with innovative adaptation technologies and systems. A new concept study was carried out by using a solar power plant with large surface areas in rainwater harvesting with a different approach. This study aims to analyze a PV power plant type rainwater harvesting system (PVPPRWHS) in a 600 kW grid-connected solar photovoltaic (PV) power plant. An experimental rainwater harvesting was carried out in only 128 m2 of Altınoluk Solar Power Plant, which has a surface area of 4320 m2. Using rainwater for PV cleaning provides an innovative approach. This study showed that the potential for collecting rainwater from a small part of the PV plant is approximately 118 m3 per year and that the harvesting system will reach 1646 m3/year when applied to the whole plant. A study was also conducted to reveal the rainwater collection potential of the power plants in Çorum, which have been licensed since 2016. The highest rainwater harvesting potential belongs to the two power plants located in the Sungurlu district, Derekisla and Alembeyli, which are 10129 m3/year and 11591 m3/year, respectively. The total rainwater harvesting potential of the power plants that have been licensed since 2016 in Çorum has been calculated as 56388 m3/year. This study presents an innovative approach with rainwater harvesting from solar power plants with a large surface area for the use in panel cleaning and agriculture of the obtained water, combating climate change and drought. Rainwater harvesting systems, which can be created with small investments in PV power plants, are seen as much more effective methods compared to the methods of producing water from the air.
Figure below shows Rainwater Harvesting System.
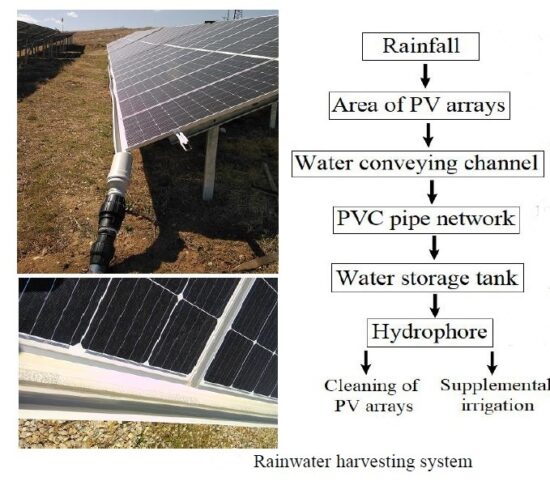
For rainwater harvesting, a group of 144 PV panels with 32° inclination angle located in Çorum was examined. Figure above shows the rainwater harvesting system. The rainwater harvesting system has a gutter assembly that collected and funnelled water from the PV arrays to branch pipes. The branch pipes are directed water to tank or tanks. The storage capacity of a rainwater harvesting system varies depending on rain amount and water consumption. In the first attempt pilot study, the rainwater harvesting system has a 1 m3 tank. In the second attempt pilot study, a system with a tank capacity of 25 m3 was installed. In addition, a 5.5 kW booster was added to the system. A hydrophore and a 400 m long waterline were installed to irrigate the walnut saplings in an area 40 m higher than the existing power plant.
______
______
Section-11
Solar PV system:
_
Types of photovoltaic system scales:
Solar panels are installed at three main scales: residential, commercial, and utility.
-1. As a homeowner, you can take advantage of residential-scale solar, typically in the form of rooftop solar or ground-mounted solar installed on open land. Generally, residential solar panel systems are between 5 and 20 kilowatts (kW), depending on the size of your home.
-2. Commercial solar energy projects are typically installed at a greater scale than residential solar. While individual installations can vary greatly in size and cost, commercial-scale solar arrays serve a consistent purpose: They provide on-site solar power to businesses and nonprofits.
-3. Finally, utility-scale solar projects are typically large-scale solar power plants that are several megawatts (MW) in size. Utility-scale solar installations provide solar energy to a large number of utility customers and may lower electricity costs in the future, but don’t currently provide any direct bill savings.
If you can’t install solar on your home or business, you can still save with community solar. Developers typically build community solar farms in central locations so they can provide power to multiple properties. As a subscriber, you’ll support the development of clean energy in your community and save between 5-20% on annual electricity costs.
All scales will require system flexibility measures, such as energy storage and demand-response, whereby demand is shifted to match electricity supply.
_
Solar PV System Types:
The three main types of solar power systems are:
-1. On-grid – also known as a grid-tie solar system
-2. Off-grid – also known as a stand-alone power system
-3. Hybrid – Solar system with battery storage with grid-connection
_
Solar system components and how they work:
Solar panels:
Solar panels or solar modules are installed together in what is known as a solar array. Modern solar panels are made up of many solar cells or Photovoltaic (PV) cells which generate direct current (DC) electricity from sunlight or energy from the sun. Note that it is light energy or irradiance, not heat, which produces electricity in photovoltaic cells.
Solar inverter:
Solar panels generate DC electricity which needs to be converted to alternating current (AC) electricity for use in our homes and businesses. This is the role of the inverter. In a micro inverter system, each panel, or every two panels, has its own micro inverter attached to the back side of the panel. The panel still produces DC, but is converted to AC on the roof, and is fed straight to the electrical distribution board
Distribution Board:
AC electricity is sent to the distribution board where it is directed to the various circuits and appliances in your house that are using electricity at the time. Any excess electricity can be sent to either a battery storage system if you have one in off-grid or hybrid system, or to the electricity grid if you have an on-grid system.
Solar Batteries:
In an off-grid or hybrid solar system the electricity is stored in batteries which store the energy until it is required, these batteries can be lead acid, AGM, gel or Lithium.
_
On-Grid System:
These systems are connected to the public electricity grid and do not require battery storage. Rated input DC voltage from solar panels – typically between 75 V (minimum value) and 750 V (maximum value) is generated for most inverters used in residential grid-tied systems. Most inverters in the market have a DC input voltage range of typically 150 to 400VDC. Any solar power that you generate from an on-grid system during the day (which is not used directly in your home) is exported onto the electricity grid and you usually get paid a feed-in-tariff for the energy that you export. At night you would use grid electricity. Grid-tie solar is the best option if you want to offset your electricity bill and save money over the life of your system. Most grid-tie systems pay for themselves within 5-10 years. With solar panels warrantied for 25 years, grid-tie solar is the only option that reliably turns a profit for the system owner over the life of the panels.
Unlike hybrid systems, grid-tie solar systems are not able to function or generate electricity during a blackout or power outage due to safety reasons; since blackouts usually occur when the electricity grid is damaged. If the solar inverter was still feeding electricity into a damaged grid, it would risk the safety of the people repairing the fault/s in the network. However most hybrid solar systems with battery storage are able to automatically isolate from the grid (known as islanding) and continue to operate during a blackout.
_
Off-Grid System:
An off-grid system is not connected to the electricity grid and therefore requires battery storage. For off-grid systems, 48V battery voltages offer many advantages over 12V or 24V batteries, particularly for larger systems. Off-grid inverter converts DC input voltage accepted from the battery bank – the most typical voltages are 12V, 24V, and 48V into output voltage – usually 120 VAC or 240 VAC. An off-grid solar system must be designed appropriately so that it will generate enough power throughout the year and have enough battery capacity to meet the home’s requirements, even in the depths of winter when there is less sunlight. The high cost of batteries and inverters means off-grid systems are much more expensive than on-grid systems. Off-grid solar is best for delivering power to remote locations where there is no access to a utility line.
- The battery bank.
In an off-grid system there is no public electricity grid. Once solar power is used by the appliances in your property, any excess power will be sent to your battery bank. Once the battery bank is full it will stop receiving power from the solar system. When your solar system is not working (night time or cloudy days), your appliances will draw power from the batteries.
- Backup Generator.
For times of the year when the batteries are low on charge and the weather is very cloudy you will generally need a backup power source, such as a backup generator or gen-set.
_
Hybrid System:
Due to the decreasing cost of battery storage, systems that are already connected to the electricity grid can start taking advantage of battery storage as well. This means being able to store solar energy that is generated during the day and using it at night. When the stored energy is depleted, the grid is there as a back-up, allowing consumers to have the best of both worlds. Hybrid systems also have the advantage of powering your loads during load shedding.
There are also different ways to design hybrid systems
- The battery bank.
In hybrid system once solar power is used by the appliances in your property, any excess power will be sent to your battery bank. Once the battery bank is full, it will stop receiving power from the solar system.
- The meter and electricity grid.
Depending on how your hybrid system is set up and whether your utility allows it, once your batteries are fully charged excess solar power not required by your appliances can be exported to the grid via your meter. When your solar system is not in use, and if you have drained the usable power in your batteries your appliances will then start drawing power from the grid.
_
To see how solar works, let’s look at a typical PV system:
- Solar panels are attached to an aluminium mounting system, which is secured to the roof (typically directly to the rafters). Solar cells can also be integrated directly into the roof tiles – this is more suitable for new builds than retrofits.
- When the sun shines, the panels will generate direct current (DC) which flows into a box called an inverter to create an alternating current (AC) – AC is used by the appliances in your home / building. Note that the panels work best in sunlight; however they will still generate some energy when it is overcast using ‘diffuse sunlight’.
- The AC flows from the inverter into the fuse box. If you are using electricity, the electricity will flow straight into these appliances (topped up, if necessary by additional electricity from the national grid). If you do not need the electricity it can flow into the national grid so that someone else can use it – in effect your home / building has become a mini power station (hence the term ‘micro-generation’).
- As long as you have a smart meter in your home or half hourly metering and an export meter in your commercial building, you can get paid for any surplus energy that you generate with an export tariff.
- If your system is not connected to the grid, electricity can be stored, usually in large batteries. To avoid over-sizing your system, you will also need a generator to cover periods when the sun is not shining and the batteries have been depleted.
______
______
Anatomy of solar panel:
Solar Panels:
Solar panels are made up of individual cells that have layers of special semiconductor materials that are arranged in positive and negative layers (similar to the setup of a battery). Light energy from the sun shines on solar panels and hits the layers of semiconductors with photons (what makes up sunlight) in order to create a flow of electrical energy. The energy from the photons frees electrons within the semiconductor material which creates direct current (DC) electricity. Wiring connected to the positive and negative sides of the cell harness that electrical current using wires that are connected to the panel which carry the electricity to an inverter. Here the electricity can be converted into alternating current. Solar panels can link together to provide either all or a portion of the power needed for a home or business to run.
Rooftop PV:
A photovoltaic (PV) system is usually composed of several solar panels. For a typical home or small business, the solar panels are usually mounted on the roof. After sunlight creates electricity in the form of direct current (DC), it is sent to an inverter that changes the (DC) electricity into alternating current (AC) because our home appliances and lighting are designed for (AC) electricity. This (AC) electricity can then be used in your home or business, sent to the electric grid, or sold to the utility. In hybrid systems, electricity can be used in your home and the excess can be sold to the utility. The choice of using the electricity, selling it, or both options in the hybrid modal depend on the policies available with your utility.
Utility-Scale, Ground Mount PV:
Large utility-scale, ground mount PV systems are installed to provide solar electricity for the electrical grid, similar to a traditional power plant. Once the (DC) electricity is generated, inverters convert the (DC) electricity into usable alternating current (AC) electricity, and then the electricity is sent into a transformer before it heads to a substation. At the substation, electricity is converted into a voltage that is able to meet the requirements of utility grid transmission lines and is either fed onto the electrical grid to serve the needs of local communities, or travels to other regional locations and/or states.
_
Structure of solar panel is depicted in figure below:
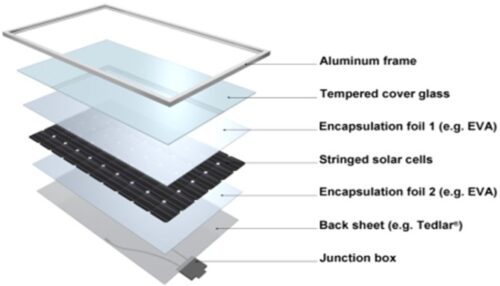
A photovoltaic panel is composed by a series of photovoltaic cells protected by a glass on the front and a plastic material on the rear. The whole of it is vacuum encapsulated in a polymer as transparent as possible. Photovoltaic (PV) panels are manufactured as solid panels that are completely sealed so there is almost no risk of hazardous exposure to toxic materials. PV panels are commonly installed in desert and arctic environments and are built to be completely weather tight under all environmental conditions. The top is typically tempered glass and the back plate is permanently sealed on the back side to sandwich in the solar cells that are between the glass and back plate. The PV panels themselves are made as a solid, sealed unit and water cannot wash any chemicals off of them (there are no liquids in solar panels). In addition, the chemicals in PV panels do not vaporize off and the panels have a very high melting point that exceeds most typical fires. Most PV panels use silicon in the solar cells. If space is limited on your roof or project site, a higher-efficiency, monocrystalline panel may be preferred, and could result in a better return on investment. Alternatively, a lower-cost, slightly less efficient, polycrystalline panel may do the job just as well if you have ample roof space on your home.
Many panel manufacturers also build panels containing both mono and polycrystalline wafers to form solar cells, capable of harvesting energy from a wider spectrum of light. It is important that your solar panels receive good insolation (sun exposure) throughout the day and are free from as much shading from trees or neighboring obstructions as possible.
_____
_____
Photovoltaic cells, modules, panels, and arrays:
The PV cell is the basic building block of a PV system. A typical silicon PV cell is a thin wafer, usually square or rectangular wafers with dimensions 10cm × 10cm × 0.3mm, consisting of a very thin layer of phosphorous-doped (N-type) silicon on top of a thicker layer of boron-doped (p-type) silicon. Every solar panel consists of multiple solar cells. Based on the number of cells, there are two common types of solar panels available. Typically, residential solar panels contain 60 cells and commercial panels have 72. A single solar cell produces an open-circuit voltage or electrical potential of approximately 0.5 to 0.6 volts. The voltage of a cell under load is approximately 0.46 volts, generating a current of about 3 amperes. One cell only produces 1 to 2 Watts, which is only enough electricity for small uses, such as powering calculators or wristwatches. As a single solar cell has low power, voltage and current, we make series and parallel combinations of solar cells to get a solar module as seen in the figure below.
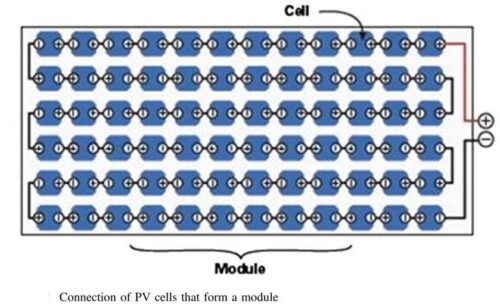
PV modules are connected to make PV panels that vary in size and in the amount of electricity they can produce. PV panel electricity-generating capacity increases with the number of cells in the panel or in the surface area of the panel. Solar panels can be wired in series or in parallel to increase voltage or current respectively. The rated terminal voltage of a 12 Volt solar panel is usually around 17.0 Volts, but through the use of a regulator, this voltage is reduced to around 13 to 15 Volts as required for battery charging. PV panels can be connected in groups to form a PV array as seen in the figure below. A PV array can be composed of as little as two to hundreds of PV panels. The number of PV panels connected in a PV array determines the amount of electricity the array can generate.
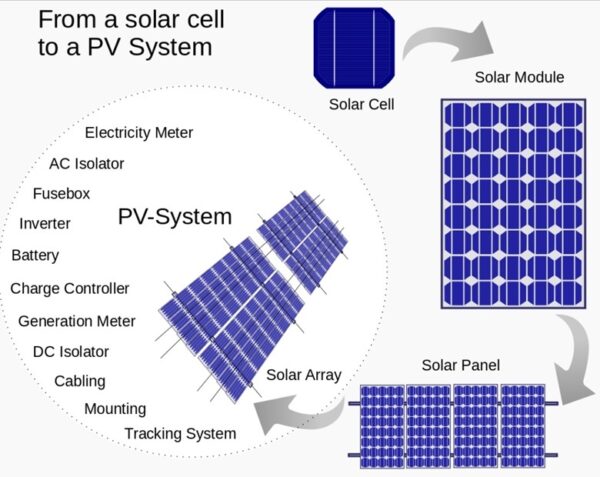
PV arrays are, basically, an aggregation of several PV modules interconnected in different configurations, e.g., series–parallel (SP), total cross-tied (TCT), bridge link (BL), honeycomb (HC), and others. The number of modules in series (i.e., string) in an array depends on the open-circuit voltage of the modules and the design voltage of the arrays. The number of such strings of series-connected modules is connected in parallel depending upon the plant capacity (or land availability). Each module, on the other hand, is an aggregation of several series-connected PV cells. Hence, a small increase in the efficiency of PV cells enhances the power output of the PV array to a large extent.
____
Solar Panel Dimensions of the Three Common Types of Panels:
60-Cell Solar Panels
The standard solar panel size, the 60-cell is structured as a 6×10 grid and measures 3.25 feet by 5.5 feet.
72-Cell Solar Panels
The average 72-cell solar panel size measures 3.25 feet by 6.42 feet and is laid out as a 6 x 12 grid, making them almost a foot taller than the 60-cell standard size panels. Given their large physical size, 72-cell solar panels may be awkward to carry, which is why two people are often required for installation.
96-Cell Solar Panels
The 96-cell panel possesses an 8 x 12 grid structure that measures 41.5 inches by 62.6 inches.
If you’re planning on installing a rooftop solar system, understanding the weight of your solar panels is another key factor to consider. Knowing a solar panel’s weight is the best way to be certain that your roof can support a full installation.
While panel weights vary from brand to brand, most panels weigh about 40 pounds.
_____
Solar panels are classified according to their rated power output in Watts. This rating is the amount of power the solar panel would be expected to produce in 1 peak sun hour. Most solar panels produce an output between 250 watts to 400 watts, although some panels have been known to exceed 400 watts. Based on that, you can use the solar system calculation formula to assess how big your solar system needs to be.
A photovoltaic module’s efficiency is quantified as the ratio between the electrical power going out of the terminals and the power of the sun’s rays striking the module’s surface. The standard value used to indicate solar radiation is 1,000 watt/m2. If every square meter is struck by 1,000 watts of sunlight, the percentage of energy actually converted into usable electricity is what constitutes the efficiency. The average life of a photovoltaic module is around 30 years.
_____
Smart module:
Smart modules are different from traditional solar panels because the power electronics embedded in the module offers enhanced functionality such as panel-level maximum power point tracking, monitoring, and enhanced safety. Power electronics attached to the frame of a solar module, or connected to the photovoltaic circuit through a connector, are not properly considered smart modules. Several companies have begun incorporating into each PV module various embedded power electronics such as:
- Maximum power point tracking (MPPT) power optimizers, a DC-to-DC converter technology developed to maximize the power harvest from solar photovoltaic systems by compensating for shading effects, wherein a shadow falling on a section of a module causes the electrical output of one or more strings of cells in the module to fall to near zero, but not having the output of the entire module fall to zero.
- Solar performance monitors for data and fault detection
_____
Solar shingles:
If you’ve never heard of solar shingles, you’re not alone. According to an October 2023 study of more than 1,100 homeowners across the U.S. conducted by Modernize, 38 percent of people are not familiar with them, even though they’re over a decade old. Also known as solar roofs, solar tiles, or solar roof tiles, solar shingles are tile-shaped panels permanently installed on your home’s roof. The panels are much smaller than conventional solar panels, but they operate in a similar way, with building-integrated photovoltaic systems, an inverter and a circuit that allows the solar energy to be absorbed and flow through the wires into your home. Each shingle produces anywhere from 13 to 80 watts of energy, depending on the brand. The average size of a solar shingle or tile is about 12 inches wide by 86 inches long. It takes about 350 solar tiles for a standard-size roof. Tiles weigh about 13 pounds per square foot, so most roofs can handle them without additional reinforcement. The first solar shingles were developed by DOW Chemical Company, rolling out in 2011. But the concept began to get serious traction in 2016, when Tesla purchased manufacturer Solar City and began offering what it deemed the Tesla Solar Roof. Today, there are several brands of the solar roof tiles available from manufacturers CertainTeed, GAF Energy, Luma, SunTegra and of course Tesla. (Dow dropped out of the game.)
_______
_______
Basic System Components:
A photovoltaic system typically includes an array of photovoltaic modules, an inverter, a battery pack for energy storage, a charge controller, interconnection wiring, circuit breakers, fuses, disconnect switches, voltage meters, and optionally a solar tracking mechanism. Specifications of solar panels to use depends on the inverter that you’re going to use not the load. Equipment is carefully selected to optimize output, energy storage, and reduce power loss during power transmission, and convert from direct current to alternating current.
The following diagram shows the major components in a typical basic solar power system.
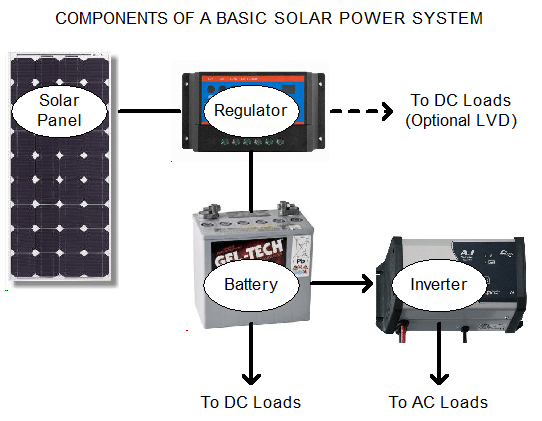
The solar panel converts sunlight into DC electricity to charge the battery. This DC electricity is fed to the battery via a solar regulator which ensures the battery is charged properly and not damaged. DC appliances can be powered directly from the battery, but AC appliances require an inverter to convert the DC electricity into 120/240 Volt AC power. Some DC appliances can be connected to the regulator to take advantage of the Low Voltage Disconnect and protect your battery. In the event of a power outage, safety switches in the inverter automatically disconnect the PV system from the line. This safety disconnect protects utility repair personnel from being shocked by electricity flowing from the PV array into what they would expect to be a “dead” utility line.
______
______
Deep Cycle Solar Batteries:
Deep-cycle batteries store energy from the sun for use when the sun is not shining. They are called “deep cycle” because they can survive long periods of being repeatedly and deeply discharged to almost their entire capacity. Deep cycle batteries that are used in solar power systems are designed to be discharged over a long period of time (e.g. 100 hours) and recharged hundreds or thousands of times, unlike conventional car batteries which are designed to provide a large amount of current for a short amount of time. To ensure long battery life, deep cycle batteries should not be discharged beyond 70% of their capacity. i.e. 30 % capacity remaining. Discharging beyond this level will significantly reduce the life of the batteries.
_
Types of solar batteries:
- Lead-acid
- Lithium-ion
- Nickel-cadmium
- Flow
Each battery type comes with its pros and cons, and the cost is also a consideration. However, lithium-ion batteries are quickly becoming the most popular battery option, as they require almost no regular maintenance. Lithium-ion batteries can also hold more solar energy within a smaller space than a lead-acid battery.
_
Deep cycle batteries are rated in Ampere Hours (Ah). This rating also includes a discharge rate, usually at 20 or 100 hours. This rating specifies the amount of current in Amps that the battery can supply over the specified number of hours. As an example, a battery rated at 120Ah at the 100 hour rate can supply a total of 120A over a period of 100 hours. This would equate to 1.2A per hour. Due to internal heating at higher discharge rates, the same battery could supply 110Ah at the 20 hour rate, or 5.5A per hour for 20 hours. In practice, this battery could run a 60W 12VDC TV for over 20 hours before being completely drained.
Power, or watt power (Wp), is calculated as Volts x Amps. Therefore a 100 Amp hour battery operating at 12 Volts can store 1200 watt hours, or 1.2 kWh, of DC power.
_
A solar battery can be either connected to the solar inverter (DC) or to the switchboard (AC). Batteries store energy in DC so, when a battery is connected to a hybrid solar inverter, DC electricity from the solar panels is able to charge the batteries directly. The hybrid solar inverter then converts the energy to AC later when the battery discharges. For a battery that is connected to the switchboard, it is “AC Coupled” meaning it receives AC power. These batteries (like the Tesla Powerwall 2) have an internal inverter that converts the AC power back to DC to store it. Companies have chosen this design despite the inefficiency of inverting the power multiple times as it makes them more compatible with virtually any solar inverter and can even be used without any solar panels.
Solar batteries can also generate income if you are able to participate in a Virtual Power Plant (VPP) scheme which enables a fleet of batteries to help stabilise the grid and capitalise on price spikes on the wholesale market.
_____
_____
Utility meter records:
Figure below shows different types of solar metering: feed-in tariff, net metering and PPA metering:
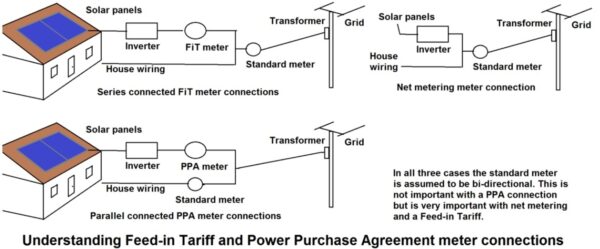
_
Your electric meter (sometimes called the “utility meter”) is the device your utility company uses to measure your electricity consumption. It’s how they know what to bill you each month. A traditional electric meter has analog dials that spin as current flows through it, which is why the utility company has someone check your meter in person once a month. Even then, that meter reading is just a summary of your electricity consumption for the month.
Feed-in tariff:
Once solar is installed the responsible retailer is required to replace the current meter with a bi-direction meter.
The meter can then record all the power that is drawn to the house, but also record the amount of solar energy that is exported back to the grid. Often there is a small cost for the household to pay to change over this meter. The recorded electricity that is exported back to the grid can earn a “feed-in tariff”. Even if you’re unable to consume all the energy your solar panels produce, it doesn’t go to waste. Homeowners can sell their unused energy back to the grid through a system called “feed-in tariff.”
Feed-in tariffs can be considered to be much the same as net metering—the major difference being that feed-in tariffs, unlike net metering rates, are not pinned directly to the value that consumers pay for energy. In other words, instead of getting a kilowatt-hour’s worth of credit for every kilowatt-hour your panels produce, you get a monetary credit that corresponds to the value of that energy. This value can be either higher or lower than the retail cost, and this rate can determine the viability of solar energy in the state.
A PPA is a solar power purchase agreement where a third-party owns the solar panels and the homeowner purchases the electricity generated on a kWh basis. This is different from net metering, as customers will pay for the energy they use, but do not sell the solar electricity they don’t use back to the grid.
_
Net Metering:
In net metering the price of the electricity produced is the same as the price supplied to the consumer, and the consumer is billed on the difference between production and consumption. Net metering can usually be done with bi-directional electricity meters, which accurately measure power in both directions and automatically report the difference, and because it allows homeowners and businesses to generate electricity at a different time from consumption, effectively using the grid as a giant storage battery.
The real brilliance of net metering is in its simplicity and its ability to offer a direct incentive to invest in solar power. By tracking the kilowatt-hours produced and consumed, it allows solar system owners to only pay for the net amount of electricity used. It’s a win-win situation – it encourages the production of green energy, reduces strain on the electrical grid, and provides significant savings for those who have invested in solar power systems. With net metering, every kilowatt of clean, green, solar energy counts.
Net metering is like using the grid for storage:
If your solar panel system doesn’t have storage, you can still use your surplus solar energy at night. How? Through net metering! With net metering, you don’t have physical energy storage at your home. Instead, the excess power your solar panels produce during the day is exported to the utility grid. You receive credits for this power, which accumulate in your account. Later, at night — or any other time you use power from the grid — you can use your credits to offset the cost of the energy. In other words, net metering lets you store the economic value of the excess power you produce, which you can use to reduce or even completely cancel out your electric bills. Net metering allows homeowners who are not home when their systems are producing electricity to still receive the full value of that electricity without having to install a battery storage system. Essentially, the power grid acts as the customer’s battery backup, which saves the customer the added expense of purchasing and maintaining a battery system. Net metering makes solar power a very good deal. Net metering is a policy that allows homeowners to receive the full value of the electricity that their solar energy system produces.
_
Self-consumption:
In cases of self-consumption of solar energy, the payback time is calculated based on how much electricity is not purchased from the grid. However, in many cases, the patterns of generation and consumption do not coincide, and some or all of the energy is fed back into the grid. The electricity is sold, and at other times when energy is taken from the grid, electricity is bought. The relative costs and prices obtained affect the economics. In many markets, the price paid for sold PV electricity is significantly lower than the price of bought electricity, which incentivizes self-consumption. Moreover, separate self-consumption incentives have been used in e.g., Germany and Italy. Grid interaction regulation has also included limitations of grid feed-in in some regions in Germany with high amounts of installed PV capacity. By increasing self-consumption, the grid feed-in can be limited without curtailment, which wastes electricity. A good match between generation and consumption is key for high self-consumption. The match can be improved with batteries or controllable electricity consumption.
______
______
Tracking:
A solar tracker is a device that orients a payload toward the Sun. Payloads are usually solar panels, parabolic troughs, Fresnel reflectors, lenses, or the mirrors of a heliostat. The purpose of a tracking mechanism is to follow the Sun as it moves across the sky. Solar trackers increase the energy produced per module at the cost of mechanical complexity and increased need for maintenance. They sense the direction of the Sun and tilt or rotate the modules as needed for maximum exposure to the light. The tracking angles depend on the site latitude and climatic conditions. There are two main solar tracking systems types that depend on the movement degree of freedom are single axis solar tracking system and dual axis solar tracking system.
_
Sunlight has two components: the “direct beam” that carries about 80% of the solar energy and the “diffuse sunlight” that carries the remainder – the diffuse portion is the blue sky on a clear day, and is a larger proportion of the total on cloudy days. As the majority of the energy is in the direct beam, maximizing collection requires the Sun to be visible to the panels for as long as possible. However, on cloudier days the ratio of direct vs. diffuse light can be as low as 60:40 or even lower.
The energy contributed by the direct beam drops off with the cosine of the angle between the incoming light and the panel. In addition, the reflectance (averaged across all polarizations) is approximately constant for angles of incidence up to around 50°, beyond which reflectance increases rapidly.
_
Even though a fixed flat panel can be set to collect a high proportion of available noon-time energy, significant power is also available in the early mornings and late afternoons when the misalignment with a fixed panel becomes too excessive to collect a reasonable proportion of the available energy. For example, even when the Sun is only 10° above the horizon, the available energy can be around half the noon-time energy levels (or even greater depending on latitude, season, and atmospheric conditions). Thus the primary benefit of a tracking system is to collect solar energy for the longest period of the day, and with the most accurate alignment as the Sun’s position shifts with the seasons. The installation of solar trackers can improve the performance of photovoltaic panels by up to 40%. Single-axis systems increase efficiency between 25% and 30%, while dual-axis trackers add between 5% and 10% more, which translates into greater solar energy generation. Double-sided panels that track the Sun could increase energy production by 35% and reduce the average cost of electricity by 16% compared to conventional systems, according to research by SERIS.
In addition, the greater the level of concentration employed, the more important accurate tracking becomes, because the proportion of energy derived from direct radiation is higher, and the region where that concentrated energy is focused becomes smaller.
_
For flat-panel photovoltaic systems, trackers are used to minimize the angle of incidence between the incoming sunlight and a photovoltaic panel, sometimes known as the cosine error. Reducing this angle increases the amount of energy produced from a fixed amount of installed power-generating capacity. In standard photovoltaic applications, it was predicted in 2008–2009 that trackers could be used in at least 85% of commercial installations greater than one megawatt from 2009 to 2012. As the pricing, reliability, and performance of single-axis trackers have improved, the systems have been installed in an increasing percentage of utility-scale projects. According to data from WoodMackenzie/GTM Research, global solar tracker shipments hit a record 14.5 gigawatts in 2017. This represents growth of 32 percent year-over-year, with similar or greater growth projected as large-scale solar deployment accelerates.
_
In concentrator photovoltaics (CPV) and concentrated solar power (CSP) applications, trackers are used to enable the optical components in the CPV and CSP systems. The optics in concentrated solar applications accept the direct component of sunlight light and therefore must be oriented appropriately to collect energy. Tracking systems are found in all concentrator applications because such systems collect the sun’s energy with maximum efficiency when the optical axis is aligned with incident solar radiation.
_
Trackers add cost and maintenance to the system – if they add 25% to the cost, and improve the output by 25%, then the same performance can be obtained by making the system 25% larger, eliminating the additional maintenance. Tracking was very cost effective in the past when photovoltaic modules were expensive compared to today. Because they were expensive, it was important to use tracking to minimize the number of panels used in a system with a given power output. But as panels get cheaper, the cost effectiveness of tracking vs using a greater number of panels decreases. However, in off-grid installations where batteries store power for overnight use, a tracking system reduces the hours that stored energy is used, thus requiring less battery capacity. As the batteries themselves are expensive (either traditional lead acid stationary cells or newer lithium ion batteries), their cost needs to be included in the cost analysis.
_
Tracking is also not suitable for typical residential rooftop photovoltaic installations. Since tracking requires that panels tilt or otherwise move, provisions must be made to allow this. This requires that panels be offset a significant distance from the roof, which requires expensive racking and increases wind load. Also, such a setup would not make for an aesthetically pleasing install on residential rooftops. Because of this (and the high cost of such a system), tracking is not used on residential rooftop installations, and is unlikely to ever be used in such installations. This is especially true as the cost of photovoltaic modules continues to decrease, which makes increasing the number of modules for more power the more cost-effective option. Tracking can (and sometimes is) used for residential ground mount installations, where greater freedom of movement is possible.
_
Tracking can also cause shading problems. As the panels move during the course of the day, it is possible that, if the panels are located too close to one another, they may shade one another due to profile angle effects. As an example, if one has several panels in a row from east to west, there will be no shading during solar noon, but in the afternoon, panels could be shaded by their west neighboring panel if they are sufficiently close. This means that panels must be spaced sufficiently far to prevent shading in systems with tracking, which can reduce the available power from a given area during the peak Sun hours. This is not a big problem if there is sufficient land area to widely space the panels. But it will reduce output during certain hours of the day (i.e. around solar noon) compared to a fixed array. Optimizing this problem with math is called backtracking.
Further, single-axis tracking systems are prone to becoming unstable at relatively modest wind speeds (galloping). This is due to the torsional instability of single-axis solar tracking systems. Anti-galloping measures such as automatic stowing and external dampers must be implemented.
______
______
Maintenance:
Solar panel conversion efficiency, typically in the 20% range, is reduced by the accumulation of dust, grime, pollen, and other particulates on the solar panels, collectively referred to as soiling. A dirty solar panel can reduce its power capabilities by up to 30% in high dust/pollen or desert areas. The average soiling loss in the world in 2018 is estimated to be at least 3% – 4%. The effects of “soiling” (as it’s known in the solar industry) vary widely by location, but energy yield losses of 10 percent are not uncommon. Massachusetts Institute of Technology (MIT) research shows that dust gathering on solar panels can drastically reduce their output in a single month, and the researchers say that even a 3 to 4 percent reduction in solar power worldwide could lead to losses of up to $5.5 billion. Paying to have solar panels cleaned is a good investment in many regions. Cleaning methods for solar panels can be divided into 5 groups: manual tools, mechanized tools (such as tractor mounted brushes), installed hydraulic systems (such as sprinklers), installed robotic systems, and deployable robots. Manual cleaning tools are by far the most prevalent method of cleaning, most likely because of the low purchase cost. Cleaning dirty panels with commercial detergents can be time-consuming, costly, hazardous to the environment, or even corrode the solar panel frame. Ideally solar panels should be cleaned every few weeks to maintain peak efficiency, which is especially hard to do for large solar-panel arrays. Cleaning can cost up to five dollars per panel. That might not sound like a lot of money, but if you have 52,000 panels it adds up quickly.
_
A few of the most common misconceptions about solar panels include:
- Required maintenance: In reality, solar energy systems require very little maintenance throughout the lifetime of the equipment, especially when compared to other fuel sources.
- HOA blocking: In many states, it is illegal for a Homeowners Association to deny a solar energy installation due to local aesthetic concerns.
- Roof damage: When installed by a certified professional, solar panel installations do not create leaks or roof damage.
_
Software & Sensors keep Solar Panels at Peak Performance:
Solar power has growing mass appeal as a sustainable energy solution; according to the International Energy Agency it accounted for 4.5 percent of all electricity worldwide in 2022 – an increase of 26 percent from the year before. The tricky issue of maintaining and monitoring the photovoltaic (PV) cells that make up the solar panels – especially on rooftops or in remote solar farms – is crucial to their efficiency and efficacy. And Israeli startup Soltell Systems is on a mission to provide clarity for all solar panel operators in order to understand how well their PV cells are really working. The Herzliya-based startup’s energy management software helps rooftop solar providers in residential, commercial and industrial areas monitor, manage and improve their panels’ performance – removing what it says is widespread guesswork about when they need to be cleaned and serviced, and potentially saving them time and money. The platform uses the electrical sensors in the area of the panels to gauge exactly when the panels need to be cleaned, monitoring the local weather conditions and the solar power generated to compile a clear understanding of the PV performance. It can measure soiling [build up] on solar panels remotely, without installing any add-on hardware. So it can say for example this plant on that rooftop has a 7-percent reduction because of soiling, [mainly caused by] dust. The company says SysMap is extremely accurate, reducing solar panels’ maintenance downtime by up to 65 percent and costs by up to 40 percent.
______
Degradation and Life Span of Solar Panels:
Manufacturers design solar panels to last for decades. According to the Solar Energy Industries Association (SEIA), solar panels last between 20 and 30 years. Some well-made panels may even last up to 40 years. Though solar panels won’t simply stop working after 25 years, their power production and efficiency will decline, meaning they’ll be less effective at converting the sun’s energy into power for your home. This decline in effectiveness is known as the solar panel degradation rate. A 2015 study conducted by the National Renewable Energy Laboratory (NREL) found that solar panels have an average degradation rate of 0.5% per year. This means that if you’ve had your panels for four years, your energy production will be 2% less than when you installed them. After 20 years, your energy production will be 10% less than when you got your panels. A 2021 study by kWh Analytics determined median annual degradation of PV systems at 1.09% for residential and 0.8% for non-residential ones, almost twice that previously assumed. A 2021 module reliability study found an increasing trend in solar module failure rates with 30% of manufacturers experiencing safety failures related to junction boxes and 26% bill-of-materials failures.
_
Factors that impact Panel Life Span:
As your panels degrade, your solar panel system’s efficiency will gradually decline. Several factors aside from degradation rate can also impact your system’s efficiency.
Local Climate and Environment:
Exposure to extreme weather conditions will reduce your solar panels’ life span. This includes harsh weather, such as hail, high winds and extreme temperatures. Long-term exposure to very high temperatures will reduce a panel’s efficiency, decreasing its ability to properly power your home.
Solar Panel Installation:
Rooftop solar panels must be installed with reliable racking systems. Proper installation prevents the panels from slipping or cracking, which could impact their performance. Experienced solar installers will properly secure your panels and prevent them from falling from your roof.
Solar Panel Quality:
Investing in high-quality solar panels prevents severe degradation and reduced output. Although your panels will still degrade, the drop won’t be as drastic as cheap solar panels. High-quality solar panels provide higher power output, better energy savings and a better return on investment (ROI). These panels use better solar cells to capture more sunlight for energy conversion. High-quality solar panels also have better warranty coverage. Standard warranties are 12 to 15 years, but they can be as long as 25 years for top-quality panels.
_______
Service Life of PV Cells:
The service life of PV cells is a critical factor in the sustainability and economic viability of solar energy systems. There are various factors which influence the service life of PV cells, such as material degradation, environmental conditions, and manufacturing processes. Research has been conducted to assess degradation mechanisms and to devise strategies for prolonging the life of PV cells. In a study, Sheikh et al. investigated the degradation of common solar cell materials, such as silicon, cadmium telluride, and copper indium gallium selenide, under high temperatures. The researchers found that temperature cycling between 20 °C and 70 °C accelerated degradation, reducing power conversion efficiency to 4.52% after 10 thermal cycles. Kazem et al. examined the impact of humidity on the performance of PV modules. They observed that prolonged exposure to high humidity led to increased power degradation rates. Specifically, the study reported that increasing humidity from 67.28% to 95.59% dropped efficiency from 13.76% to 9.80%. In another study, Jordan et al. focused on accelerated aging tests to predict the lifetime of PV modules. By subjecting modules to stressors such as temperature cycling and damp heat, the study estimated an average degradation rate of 0.5% per year for commercial PV modules over a 25-year period.
_
Potential-induced degradation (PID):
In grid-connected PV systems, solar panels are typically connected in series to build up the voltage output while the module frames are grounded for safety reasons. Depending on the type of inverter used in a PV system, a high electric potential difference between the solar cells and the module frame may be induced in modules at either end of a module string. The electric potential difference causes leakage currents to flow from the module frame to the solar cells (or vice versa, depending on the module position in a module string), which results in PID. This problem will be more severe in the future, as the PV industry is trending towards increasing the maximum system voltage to 1500 V for overall cost reduction purpose.
Potential Induced Degradation (PID) is due to a high potential difference between the semiconductor material (cell) and other parts of the module (glass, mount or aluminium frame). This potential difference creates a current leakage, resulting in the migration of negative and positive ions. Negative ions flow out via the aluminium frame, whilst positive ions migrate to the cell surface. These “pollute” the cell by reducing its photovoltaic effect, leading to power losses. PID effects can be responsible for power losses of up to 20% and the effects are not immediately noticeable – it can take several months to a few years. The PID is closely linked to environmental factors (humidity, temperature) and the configuration of the PV system (grounding, module and cell type). Under normal conditions, PID may decrease the power output of individual modules by 70% and the output of the whole PV system by 15%.
_
Ongoing research focuses on developing new materials that are more resilient to environmental stressors. Perovskite solar cells, for instance, offer the potential for higher efficiency and improved stability, addressing some of the limitations of traditional silicon-based cells. Enhanced encapsulation techniques can shield PV cells from moisture, oxygen, and UV radiation. Implementing encapsulation with improved barrier properties can significantly extend the service life of PV modules. In addition, improving manufacturing processes and quality control measures can result in more reliable and durable PV cells. Ensuring consistency and minimizing defects during production contribute to longer service lives. Furthermore, designing PV systems with climate-specific considerations can reduce the impact of harsh environmental conditions. By tailoring system components and designs to local climates, the overall longevity of PV cells can be enhanced.
______
______
Safety and output of solar panel in various conditions:
-1. Water:
All solar panels are waterproof. Several components make solar panels waterproof. A thin glass sheet protects the front, and a durable, polymer-based material covers the back. These two layers, combined with a metal frame and specialized sealant glue, make solar panels waterproof and prevent water from accessing the cells and wiring.
If solar panels are installed on the roof with no space in between, the roof will act like a water pit leading to water flooding in the solar panels and its components. The high-rise panel stand, is the primary factor to keep solar panels waterproofed as the stand with a minimum height of 7 to 8 feet allows the solar panel to not to touch the ground and it can get dry as the wind passes below the solar panels. Generally, the stand is set aligned with the wall of the roof that can rise up to 10 feet. This stand will allow the solar panels to act as a rooftop over the rooftop and it will also leave the space which can be used for further purposes.
The EPDM Tape (Ethylene Propylene Diene Monomer) is a double-sided glue tape which is placed in between the solar panels and its stand. this tape acts as a connector which seals the solar panels and the frame (solar panel stand) making it completely water proof. Generally, there is a 2-inch gap in between the solar panels to allow them to bend or contract in extreme weather conditions.
As a last step, a drainpipe is installed with the solar panels to prevent the roof from clogging and to provide the solar panels a water free rooftop.
_
-2. Rain:
Energy generation from solar panel systems doesn’t grind to a halt when it rains. While the power output of solar panels is highest when exposed to direct sunlight, solar panels still generate power when it’s raining. On a rainy day, a solar panel system’s performance is reduced by 40-90%, depending on how heavy the cloud cover is. But once the storm has passed, you’ll benefit from a good side effect: rain helps to clean solar panels. A good rainstorm can have a major impact on energy output, especially if you live in a dusty area.
_
-3. Snow:
Some people think that solar panels won’t work when it snows or when the weather is really cold. Actually, sunlight can pass through a dusting of snow, so your solar panel system will continue to produce solar electricity even when it is snowing lightly. And solar panels perform better in cold temperatures because it prevents them from overheating (which reduces their effectiveness).
Heavy snowfall, on the other hand, will obstruct sunlight and significantly diminish energy output for a while. Fortunately, solar panels are excellent at shedding snow, so this rarely happens. One benefit of getting snow on your solar panels is that, as the snow melts, it washes away any dust build-up.
_
-4. Hail:
Both snow and hail are small pieces of ice that falls from the sky. Hail is a chunk of ice that can fall during thunderstorms. Hail also poses a risk to solar panels. Hailstone size varies from storm to storm, but they all have the potential to crack or shatter solar panels. If this happens, you’ll likely need professional repair services from your installer.
Recently a hailstorm caused hail to strike solar panels at over 90 mph, causing significant damage to parts of the 350-megawatt Fighting Jays Solar project. The sight of thousands of panels with broken glass prompted some to doubt the dependability of solar energy. As solar farms become more widespread, developers and manufacturers are taking steps to protect them from extreme weather. Companies like Nextracker are using advanced weather forecasting and panel-adjustment systems to reduce damage from hail.
_
-5. High wind:
High wind speeds are a major concern for many homeowners who want to install solar panels on their roofs because they can cause damage to both people and property. Wind speeds greater than 90 mph can be powerful enough to lift up heavy objects like solar panels and send them flying if not properly secured. This is especially true for systems mounted on flat roofs or other areas with minimal wind resistance. To prevent this kind of damage from occurring, it’s important to use an appropriate mounting system that’s designed for your local area’s wind speed and conditions.
When it comes to solar panel installation, most manufacturers recommend mounting them on roofs with steep slopes, as this helps ensure that they are securely attached to the roof decking itself. This is because steeper slopes create more friction between the mounting hardware and the roof surface; making it harder for strong winds to dislodge the mounting brackets from their place. Additionally, many manufacturers also recommend using hurricane clips or similar items along with stronger grade screws in order to provide added strength against high winds.
_
-6. Lightning:
Solar panels are designed to withstand high winds and hail, and most can also withstand strong thunderstorms. However, there is always a risk of damage from lightning strikes. Solar arrays are a big investment, and you don’t want to lose them due to lightning. Fortunately, there are a few things that you can do to protect your panels from this dangerous weather phenomenon.
First and foremost, always make sure that your solar array is grounded. This means that the metal frame of your panels should be connected directly to the earth through wire or metal posts. If you neglect this step, then your solar array will be at risk from lightning.
Second, install an anti-lightning system on your roof or property. This system will help to detect and avoid strikes by disabling power to the grid during a storm. When installing an anti-lightning system, be sure to consult with an expert in order to ensure proper protection for your property.
_
-7. Walking over solar panels:
While it’s physically possible for a person to walk on a solar panel without being electrocuted, it’s not recommended due to potential damage to the panels. Solar panels consist of layers of glass, silicon cells, and other materials that make up the photovoltaic system. Walking directly on solar panels can lead to the formation of microcracks in the silicon cells. Even if these microcracks are not visible to the untrained eye, they can significantly impede the performance of the panels. Professionals who work with solar panels are trained to navigate around them safely without causing damage. While professionals may need to walk across arrays at times for maintenance or installation purposes, they typically walk on frames and clamps rather than directly on the panels themselves.
______
______
Solar Panel Power:
The wattage of a solar panel measures how much energy it produces under standard testing conditions. While solar system size is measured in kilowatts, the amount of electricity a solar array generates is measured in kilowatt-hours.
All manufacturers use the same Standard Test Conditions (STC) to determine the nameplate wattage of a PV module:
- The panel is exposed to an irradiance or light energy of 1,000 W per square meter.
- Solar cell temperature is 25°C (77°F) at the time of testing.
- The light spectrum used during the test represents sunlight crossing the atmosphere at an angle of 48.19°. This is known as the “air mass 1.5 spectra” or AM1.5.
The output measured under laboratory conditions determines the rated wattage of a solar panel. This testing also dictates the solar panel efficiency rating. For example, if a PV module generates 220 W per square meter, it is 22% efficient.
As of June 2023, SunPower and Canadian Solar produce the most efficient solar panels in the industry — both companies have reached 22.8% efficiency. However, many other brands make solar panels with an efficiency of over 20%.
Solar panels are manufactured in standard sizes, and wattage increases with size. Smaller, 60-cell panels are common in residential installations, while 72-cell panels are normally used in commercial and industrial installations. You can find other sizes, but 60-cell and 72-cell panels are the most common.
_
Power Output by Solar Panel Type:
The main factor that determines panel power output is the type of solar cell: monocrystalline (most efficient), polycrystalline (intermediate) or thin-film (least efficient). The following table compares the typical power output you can expect when comparing types of solar panels.
|
Solar Panel Type |
Typical Power Rating* |
|
Monocrystalline |
320 W–380 W |
|
Polycrystalline |
250 W–300 W |
|
Thin-film |
Less than 200 W |
*Power estimates reflect typical wattages for residential solar panels with a size of 65 inches by 40 inches i.e. 18 square feet (or similar), which is common in home installations. Power output ratings will increase or decrease with solar panel size.
The nameplate wattage of solar panels is determined under ideal conditions that do not reflect real-world applications. For example, a 360 W panel may operate closer to 300 W when installed on a rooftop with average sunlight conditions.
As you can see, high-efficiency monocrystalline panels can generate more watts of power compared to thin-film and polycrystalline panels. Homeowners with limited space can use monocrystalline panels to achieve the highest possible electricity output.
Note:
1m2 = 10.7 ft2
18 ft2 = 1.68 m2 = receive 1680 watt irradiance.
320 watt output out of 1680 watt irradiance means 19 % efficiency
Most monocrystalline silicon panel have efficiency around 20 %
___
Below are some of the factors that affect the energy production of a solar panel:
-1. Amount of Sunlight Exposure
Solar panels generate more electricity when they get more hours of direct sunlight. Assuming you compare PV systems of the same size, you can expect higher productivity in sunny states like California. You can use the World Bank Global Solar Atlas for an idea of the sun hours available in your location. Install your solar panels in an unshaded area. Clean your solar panels regularly to prevent dust and dirt from accumulating and blocking sunlight.
-2. Ambient Temperature
Increased sunshine makes solar panel systems more productive, but high ambient (air) temperatures can have a detrimental effect. High heat can temporarily reduce the ability of PV cells to convert sunlight into electricity. For every degree above 25°C, a solar panel’s output can decrease by around 0.25% to 0.5%, affecting overall energy production.
-3. Solar Battery and Inverter Efficiency
A solar panel system includes other components, such as inverters and batteries. The inverter is necessary since it converts the DC power (direct current) generated by solar panels into the AC power (alternating current) used by home appliances. Battery storage is optional in grid-tied solar systems, but necessary for off-grid systems. These devices waste some of the power your system generates since they are not 100% efficient.
_____
_____
Calculate how many solar panels it takes to power a house:
Four variables are required to calculate how many solar panels it takes to power a house.
- Daily electricity consumption: 30 kWh (30,000 Watt-hours) AC
- Average peak sun hours: 5 hours per day
- Average panel wattage: 300W DC
- DC to AC conversion factor: There are losses in converting the energy from the sun into DC power, and turning the DC power into AC power. This ratio of AC to DC is called the ‘derate factor’, and is typically about 0.8. This means you convert about 80% of the DC power into AC power using inverter.
Panel wattage 300W DC is converted into 300 X 0.8 = 240W AC
To solve for the number of solar panels, we can write the equation like this:
(Daily electricity consumption watt-hour AC/ peak sun hours) / (panel wattage AC) = number of solar panels
Now let’s plug in above example figures:
(30,000 Watt-hours / 5 peak sun hours) / (240W AC) = 25 panels
It takes 25 solar panels (300W DC each) to power the household using 30 units of AC electricity daily to meet the goal of 100% electricity offset in location with 5 peak sun hours.
____
Calculate electricity generated per day:
W/m2 is the power coming from the Sun and landing on a 1 square metre area selected for the measurement. It varies depending on the location of the square metre you are measuring and on the local weather conditions.
KWh is usually the amount of electrical energy produced per day from a solar panel. This varies depending on many factors including the area of Sunlight collected.
Perfect sunlight gives about 1,000 watts, or 1 kW to a 1 m2 perpendicular plane. The panel will convert almost 20% of the sunlight into electricity. So, 1 m2 panel will generate 200 W power. 5m2 size panel will make 1 kW power. To generate 1kWh every hour, 5 m2 panel size is required. Five peak sunny hour per day will make 5 kWh per day. Applying DC to AC conversion factor 0.8, it would come to 4 kWh per day. So, 5 square meter solar panel will make 4 unit of AC electricity per day if efficiency is 20% and peak sun hours 5/day. There are four variables: panel size, efficiency, peak sun hours and DC to AC factor in calculating electricity generated per day.
Formula for calculating daily AC electricity generated:
AC electricity kWh per day = panel size in square meter X efficiency X peak sun hours X 0.8
For example, panel size 10 square meter with efficiency 25% with 4 peak sun hours will generate 8 unit (kWh) of AC electricity daily.
Another way of putting the same formula:
AC electricity kWh per day = panel size in kW X peak sun hours X 0.8
For example, panel size of 5 kW with 5 peak sun hours will generate 20 units (kWh) of AC electricity per day.
In other words, panel size in kW = panel size in square meter X efficiency
10 kW panel with 20 % efficiency would be 10/0.2 = 50 square meter in size.
250 watt (0.25 kW) panel with efficiency 30% would be 0.25/0.3 = 0.82 square meter in size.
Note that 1 square meter is 10.7 square feet.
______
______
Cost of solar panel:
Solar Panel Cost by Country:
Country Cost per kW
India $ 793
China $ 879
Canada $ 2,427
Russia $ 2,302
Japan $ 2,101
South Africa $ 1,617
Australia $ 1,554
United States $ 1,549
France $ 1,074
Germany $ 1,113
Though cost of Solar Modules and Panels have gone down to a great extent since 2010, it is still high in some countries. It varies from Country to Country.
_
Residential solar panels system cost $3.30 per watt, according to data from the energy consulting firm Wood Mackenzie. That’s seven cents lower than the firm’s estimate for the year before, but still adds up to $16,500 for a 5-kilowatt system. Solar panel system cost includes solar panel cost plus other components and labour.
Solar costs are also influenced by your solar system’s components. Let’s break down the components of a solar panel system and what you can expect to pay.
- Solar panels: The solar panels alone can cost between 80 cents to $1.80 per watt, depending on the type, size and application. That’s not including the cost of installation and of all the other equipment needed to get them producing energy and powering your home. Today’s premium monocrystalline solar panels typically cost between $1 and $1.50 per Watt. Less efficient polycrystalline panels are typically cheaper at $0.75 per watt.
- Batteries: Solar batteries are costly and can vary in price based on the capacity and quality of the battery. They store the energy accumulated from the solar panels. The price varies based on the installer, application and location. Batteries typically cost $12,000 to $22,000, according to the Department of Energy, although smaller capacity systems are available for less. In some cases, solar batteries may be more expensive than solar panels. Not all solar systems need batteries. If you’re still connected to the grid, you won’t need to store energy (but you still can).
- Inverter: Inverters convert the direct current, or DC, electricity produced by the panels and stored in the battery to alternating current, or AC, electricity, which runs all appliances. Inverters can cost between 20% and 50% of the price of the solar panels.
- Charge controllers: These devices, which protect the battery from overcharging, can cost between 5% and 10% of the price of the solar panels. Complex charge controllers with advanced features can be more expensive.
- Labor costs: These costs can vary from state to state. Some states require specific ratios of licensed electricians to non-electricians on a solar installation crew. Licensed tradespeople typically cost more due to the insurance, benefits and workman’s compensation costs.
- Additional expenses: Factors contributing to the overall solar installation cost include system size, design, site survey, engineering, permits, power electronics, mounting hardware, telemetry systems and maintenance. These costs can differ significantly depending on the location. Many other factors influence the cost of installing solar panels, including less-than-obvious ones like the complexity of your roof.
_____
1kW residential Solar System Price with Subsidy in India (2024):
A 1kW solar system can easily power a 2-3 BHK house wherein you can use one refrigerator, three fans, one TV, one laptop, and 4-5 lights. On average, you can run about 800 W loads on a regular basis.
The complete solar setup typically includes high-efficiency solar components such as solar panels, solar batteries (off-grid solar plant), solar inverter, mounting structure, and added accessories. After absorbing the sunlight, the solar panels generate DC electricity. It is then converted into AC electricity through a solar inverter to power the appliances in your home. To effectively run your entire home load, you will need both solar power and a solar battery or connection to a grid.
The standard price for a 1kW solar system can fall anywhere between Rs. 60,000-1,20,000 depending on the type of the system, as well as government-imposed subsidy within that state.
1kW On-grid solar system Rs. 72,000 Onwards
1kW Off-grid solar system Rs. 80,000
1kW Hybrid solar system Rs. 1,20,000
While most homeowners in India prefer on-grid systems for their flexibility and high return on investment, there is a fair share of market demand for off-grid systems as well. It all boils down to the customer’s specific needs and budget.
Breakeven period in India:
Breakeven is a point at which the system’s cost is fully made up for by the savings or income you have earned from it. According to Jayant Mhetar, co-founder and chief executive officer of Ztric India, the breakeven period for a 5 kW solar system installed with a government subsidy are between two and a half to three years. However, the breakeven period for a 5 kW rooftop solar system is approximately four to five years without any government incentives.
_______
Solar Incentives and Rebates:
Various government programs help you lower the cost of going solar. The more homeowners who switch to solar energy, the less strain there is on the collective power grid. This means federal and state government agencies want to incentivize homeowners to switch to a more sustainable energy source.
Below are the most valuable solar rebates and tax credits to look into:
Federal solar tax credit: The federal tax credit lets you apply 30% of your total solar installation cost to your federal taxes. There’s no cap on its value, meaning for a 10-kW system priced at the national average of $31,460, you’d subtract $9,438 from your taxes. This reduces your system cost to $22,022.
Net metering: You could earn additional savings from net metering, an incentive where you send excess energy back to the power grid for monthly electric bill credits. Net metering programs are offered on the state level or through certain utility companies in your state.
Property tax exemptions: Since solar panels boost home value (as much as 4.1%, according to Zillow), they also increase your property taxes. These exemptions eliminate property taxes for a certain time frame or permanently, depending on your state’s legislation.
Sales tax exemptions: Some states exempt state or local sales tax from solar panel sales, helping reduce up-front costs.
Solar renewable energy credits (SRECs): Some states offer SRECS to help meet their renewable portfolio standards (RPS). These regulations require a certain percentage of generated electricity to come from renewable sources. Homeowners receive one credit for every 1,000 kWh of solar electricity their system generates. You can apply this credit to reduce your electricity bill or sell them for profit. SRECs are worth $300 or more in some areas. The average residential system may earn you several of these credits per year.
State tax credits: Like the federal tax credit, homeowners receive a percentage of their total costs back to apply to their state taxes.
Government Subsidy on Home Solar Panel System: Government of different countries around the world offer subsidy to encourage Solar Panel Installation and use of Renewable Energy. This subsidy is different in different countries. India Government gives about 30% Subsidy on Installation of Home Solar Panel System.
______
______
Financial Benefits of Solar Panels:
While the initial cost of solar panel installation may seem substantial, it’s important to consider the long-term financial benefits:
Electricity Savings: Solar panels can significantly reduce or even eliminate your electricity bills, leading to long-term savings. Assuming that a 1 kW system would generate 4 units (kWh) per day on an average, a 5 kW system would generate about 20 kWh/day or 600 units per month.
Return on Investment (ROI): Solar panels typically offer a strong ROI, with most systems paying for themselves within 5 to 7 years, depending on local factors and incentives. The average solar panel payback period is between six and 10 years.
Low Maintenance Costs: Solar panels require minimal maintenance, reducing ongoing expenses.
Government Incentives: Subsidies, tax benefits, and net metering can further enhance your financial returns.
Environmental Impact: By using clean, renewable energy, you can reduce your carbon footprint and contribute to a more sustainable future.
______
Are solar panels worth it?
On average, homeowners who install a complete solar system can expect to save $1,530 per year on electricity bills. To estimate these savings, researchers used average annual electricity rates from the U.S. Energy Information Administration (EIA), the specific photovoltaic power output (PVOUT) from the Global Solar Atlas and the average cost of installing a 6kW after using the federal solar tax credit of around $12,000.
For most homeowners, solar panels are a worthwhile investment. Despite the high initial cost, solar panels guarantee savings on electricity bills and reduce your reliance on your utility company. With electricity rates higher than ever – and getting even higher every year – you can stand to save thousands of dollars, all while using clean energy!
But solar isn’t right for everyone. If you already have low energy costs, your roof doesn’t face the right direction, or if it’s just not in your budget, a residential solar system might not be worth it for you.
______
Energy cost savings:
As we discussed above, solar panels are no longer a luxury item – they’re a reliable long-term investment and a hedge against rising energy costs. As of October 2022, the average price of grid electricity was 16.7 cents per kilowatt hour – up 16% from the year before – while the average cost of solar electricity was around 7 cents per kilowatt hour for systems purchased through solar.com.
The primary advantage of solar energy is that it freezes your energy costs at a low rate for 25+ years, effectively shielding you from energy price increases. Figure below shows how buying a solar system compares to paying for grid electricity looks for the average American household:
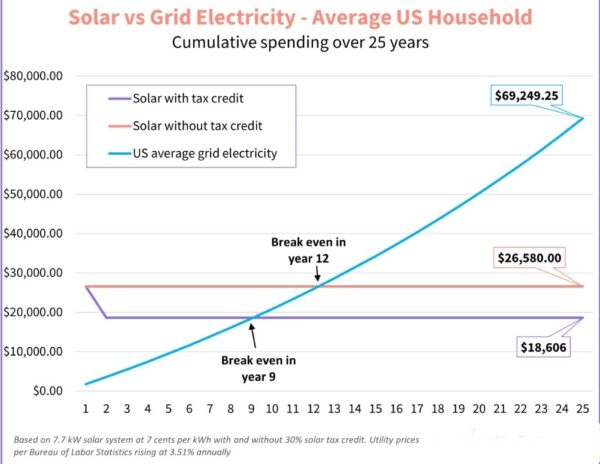
Yes, solar requires a sizeable upfront investment, unless you choose to finance with a solar loan. However, solar systems typically pay for themselves several times over and can yield over $100,000 in energy savings over their warrantied life.
______
Renewable energy is getting cheaper. Why aren’t electricity bills?
Solar panels and wind turbines make electricity at a low cost. The problem is, there aren’t enough of them. We still don’t have enough of that cheap renewable energy. In 2023, in the United States, about 60% of grid electricity generation was from fossil fuels—coal, natural gas, petroleum, and other gases. About 19% was from nuclear energy, and about 21% was from renewable energy sources. That means the majority of the grid is susceptible to swings in oil prices, which can be influenced by wars across the globe, weather events and other chaos.
______
What is the biggest reason why people do not purchase solar panels?
By far, the biggest reason why people do not purchase solar power is the need to pay more now to save more later. The decision almost always comes down to simple cash flow economics. How much is this going to cost me? And how long before it pays for itself? Rooftop solar provides huge future financial benefits but not immediate.
In the U.S., Hawaii has the highest adoption rate for solar power, not just because of the abundance of sunshine, but more critically because the cost of importing fossil fuels by sea makes their utility-generated electricity costs the highest in the nation.
And California and New York have high adoption rates for solar power because their state and local taxation and regulatory frameworks make everything —including utility-generated electricity— more expensive. Even though solar is more expensive too, the higher local costs for customer acquisition, permitting, delivery and installation labor are a relatively small portion of the system costs.
Contrast this with a relatively poor adoption rate for solar power in Florida, which has abundant sunshine. Adoption of solar power is lower in Florida because electricity is much less expensive than in Hawaii, California and New York.
_____
Can you relocate solar panels?
Solar panels are difficult to relocate. Due to the size and delicate nature of solar arrays, it is next to impossible to relocate them. A solar panel can be transferred to another house when we consider this from a theoretical standpoint. In reality, however, the transfer of solar panels is never advised and nearly impossible for a house or business. Dismantling and refitting of solar panels is a very complicated process. This process can cause extensive damage to the roof and panels. Transferring solar panels will need huge installation, maintenance, and transportation cost. Since solar panels use a lot of space and are tailored for a specific rooftop, chances are low that it can be installed properly on a new rooftop. Subsidies won’t be considered for the re-installation of solar panels. So, chances are that the consumer will lose a lot of money in the process of transferring solar panels to a new house. Solar panels are installed considering wind patterns, energy requirements, and many other factors. These considered parameters may not match the new location of installation. For homeowners who move around a lot, solar panels don’t seem like a good investment.
______
______
Assessing global electricity generation potential from rooftop solar photovoltaics, a 2021 study:
Owing to improved deployment capability and reduced costs, rooftop solar Photovoltaics (PV) technology, such as roof mounted solar panels used in home, commercial and industrial buildings, is currently the fastest deployable electricity generation technology and is projected to supply 25–49% of global electricity needs by 2050. Despite these predictions, a global assessment of the technology’s electricity generation potential and the associated costs remains a challenge.
The authors mapped 130 million km2 of global land surface area to identify 0.2 million km2 of rooftop area using a novel Machine Learning algorithm. This rooftop area was then analyzed to quantify the global electricity generation potential of rooftop solar PV. The authors found that a global potential of 27 petawatt-hour per year can be attained at a cost of between US$ 40–280 per megawatt-hour with the greatest electricity generation potential in Asia, North America and Europe. They indicate that the lowest cost for attaining the potential energy is in India (US$66 per megawatt-hour) and China (US$68 per megawatt-hour), while the UK and U.S. are among the most costly countries. The authors suggest that the electricity generation potential of rooftop solar panels exceeded the global yearly aggregated energy consumption in 2018. However, its future potential will depend on the development and cost of storage solutions for the generated energy.
The authors conclude that their findings will have important implications for sustainable development and climate change mitigations efforts. Globally, nearly 800 million people were without electricity in 2018, the majority of who are living in rural areas.
______
______
Is it better to have solar panels or a generator?
Solar panels alone are not a direct replacement for an internal combustion powered generator since they are not producing power at the same rate at all times of the day and a generator can do that. On the other hand, a generator is expensive, noisy and polluting to use at the times when solar panels can be most effective. The “fuel” for the panels is delivered at no cost and they are quiet. They will need an inverter to provide household AC power. So, what is an equivalent system for a real comparison?
To equal the utility of a generator as a grid independent household AC power system you would need the solar array, oversized for the average daytime home power consumption, and an inverter with a battery with its charge controller that can even out the variations in solar energy being delivered to your home system. The battery size will have to be fairly large to carry through several days of use, something the generator can do if there is enough fuel. One advantage of such an off the grid type system is it works even if you cannot get the fuel needed for the generator during an extended loss of the grid energy that you want to replace temporarily. Remember, refueling may be difficult in a long outage too, since the pumps at a gasoline station will not work without electric power. You have to hope the roads are still in good order to get to where there still is power available or your local purveyor of fuel also has a generator.
You will pay a lot more for that solar panel type replacement system but you can use it a lot more of the time than a generator might be able to serve you. A generator just for emergencies needs to be run periodically to keep it in good order. For day to day use it must have a fuel delivery system that can be relied upon, with its costs. It has parts that wear out faster than a good battery and solar system.
______
______
Fire hazard:
Solar panels themselves are not inherently fire hazards. In fact, they are designed with numerous safety measures in place, making them remarkably safe for everyday use. One quantitative analysis suggests there may be about 0.03 fires per MW of solar power. International data suggests that far fewer than 1 percent of all solar systems catch fire. Solar panel fires can be caused by improper installation or maintenance, and by damage from extreme weather events, such as hail or lightning. Higher voltages can be prone to arcing and is a known common cause of fires, but through the installation of micro inverters connected to the panel to convert the output to a safer level they considerably reduce the risks. As does using reputable and registered PV installers and, like maintaining your car, checks need to be done on all PV installations regularly. PV panels are often forgotten about and left to deteriorate and with those systems come risks, as with any neglected equipment. A 2015–2018 study in the UK investigated 80 PV-related incidents of fire, with over 20 “serious fires” directly caused by PV installation, including 37 domestic buildings and 6 solar farms. In 1⁄3 of the incidents a root cause was not established and in a majority of others was caused by poor installation, faulty product or design issues. The most frequent single element causing fires was the DC isolators.
______
______
Section-12
Solar power plant:
A solar power plant is based on the conversion of sunlight into electricity, either directly using photovoltaics (PV), or indirectly using concentrated solar power (CSP). Concentrated solar power systems use lenses, mirrors, and tracking systems to focus a large area of sunlight into a small beam. Photovoltaics converts light into electric current using the photoelectric effect. High-capacity systems of over 100kW are called Solar Power Stations, Energy Generating Stations, or Ground Mounted Solar Power Plants. A 1MW solar power plant can run a commercial establishment independently. The size of 1 MW solar utility farm takes up 4 to 6 acres of space and gives about 4,000 kWh of low-cost electricity every day. As of December 2023, China, United Arab Emirates, and India have taken over as the leading developers of large-scale (GW) solar power projects. Figures below show a solar photovoltaic power plant and a solar thermal power plant.
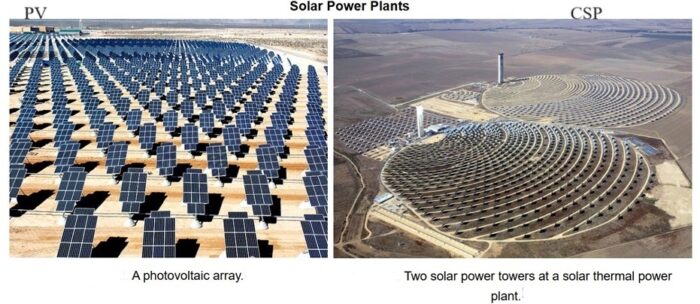
_
Solar power plants utilize radiation energy from the sun, which is abundant, available, intermittent, yet cheap. This energy is further transformed into electrical energy using photovoltaic panels. This is one type of solar power plants. Simply, a large number of panels are installed in an optimal configuration and harvest light energy from the sun and convert it into electrical energy which feeds into the grid. Another type of solar power plant is the concentrated solar power plant, which composed of mirrors or lenses that are stationed in an organized way to concentrate collected heat to one specific position. This heat is further utilized to power a steam turbine that generates electricity. However, the most common solar power plant is the traditional photovoltaic (PV) option. Solar capacity for each country varies depending on the solar irradiance as well as the available land. This type of power plant is considered a renewable option as the energy source is the sun, which is a clean, renewable, abundant, and cheap source. Solar PV farms are ground mounted and these systems can be fixed arrays, or installed with a single or a dual axis tracker. The modules are usually oriented toward the equator, with a tilt angle that is slightly lower than the site’s latitude. Different tilt angles can be explored to find the optimal power production. Axis trackers are used to optimize performance as they allow for panels to track the sun as it moves position throughout the day. Once solar energy is harvested, solar panels convert it into direct current (DC) electricity. To convert this to alternating current (AC) electricity, another component becomes essential in the solar power plant, which is the inverter.
_
Normally, solar power plants are constructed on wide-open spaces, constructing a solar farm, which produces a significant amount of electricity. This type of power plant fulfills the peaking demand, as it is a limited and intermittent source. Unless the storage option becomes sustainable and durable, this type of power plants will remain limited to peaking demand and not the base load demand. The performance of solar power plants is a function of climatic circumstances along with the quality of the equipment used in the system. Furthermore, locations with higher solar insolation yield higher electric production. Besides, solar systems’ efficiencies also vary depending on the type of panels used. This conversion efficiency is critical as it impacts the overall efficiency of the system. Moreover, other system losses include losses between the DC output and the AC input.
_
Concentrated solar power (CSP) is another method to generate power using solar energy. After concentrating great amount of light into one source, heat is used to generate a steam turbine, which is connected to a generator to generate electricity. CSP is less common than PV plants, primarily because PV plants can still operate with cloud cover, while CSP is crucially impacted by any cloud cover. Moreover, the price per Watt from solar PV has significantly decreased, while system efficiency has increased, making power generation through this source somewhat lucrative.
_
Solar power is the cheapest electricity in history, according to the IEA, and is significantly cheaper than generating electricity from fossil fuels in most countries. More than 30 countries now generate more than 10% of their electricity from solar, including Chile (20%) and Australia (17%). Ember’s Global Electricity Review revealed that to meet climate targets, solar generation needs to sustain the rate of growth seen between 2015 and 2022, increasing by 25% every year throughout the rest of the decade. It was the fastest rising source of electricity generation for the 19th year running in 2023. Solar power only generates electricity during the day, so works best when paired with energy storage. The declining cost of lithium-ion batteries has seen increasingly large projects appear in areas with abundant spare land like Australia (13% of generation from solar in 2022). However solar is also growing fast in more crowded countries like the Netherlands, where rooftop installation is key (15% of generation from solar in 2022). It also works best when electricity demand is shifted towards sunny hours, for example for electricity-thirsty air conditioners.
_
The Benefits and Challenges in building Larger Solar Power Plants:
As the world continues to face challenges related to climate change, renewable energy sources such as solar power are becoming increasingly important. Solar power plants are an essential part of this shift towards renewable energy, harnessing the power of the sun to generate electricity. As the demand for clean energy sources grows, many countries invest in developing larger solar panel plants.
Benefits are:
Environmentally Friendly:
One of the most significant advantages of solar power plants is their minimal environmental impact. Unlike traditional fossil fuels, solar energy does not produce harmful emissions, helping reduce pollution and greenhouse gas emissions. This eco-friendly nature is crucial in the fight against climate change, making solar power a key player in sustainable energy solutions & development.
Renewable Energy Source:
Solar power is a renewable energy source, continually replenished by the sun. In contrast to finite fossil fuels, the inexhaustible nature of solar energy company ensures a long-term, sustainable energy solution. This benefit is particularly important as global energy demands continue to rise, necessitating sustainable and reliable energy sources.
Reduces Reliance on Fossil Fuels:
Utilizing solar power decreases our dependence on fossil fuels, conserving these valuable resources for future needs. The benefits of solar power plants in this shift not only help in preserving natural resources but also reduce the geopolitical and economic vulnerabilities associated with fossil fuel dependence. This transition underscores the importance of harnessing clean and sustainable energy sources to ensure a more resilient and environmentally friendly future
Low Maintenance:
Solar power plants or solar open access require minimal maintenance, making them an economically viable option. Once installed, they need only occasional cleaning and routine checks, leading to significant savings in operational costs over the years.
Long Lifespan:
Via quality solar panel manufacturing process, the primary component of solar power plants, typically have a lifespan of 25-30 years. This long lifespan means that the benefits of solar power, such as reduced electricity bills and environmental impact, can be enjoyed for many years.
Lower Cost per Unit of Energy Produced:
One of the primary benefits of building larger solar power plants is the lower cost per unit of energy produced. This is because larger plants can take advantage of economies of scale, which means that the cost per unit of energy produced decreases as the size of the plant increases. This makes solar energy more competitive with traditional forms of energy, such as coal and gas, which can be expensive to produce.
Improved Grid Stability:
Building larger solar power plants can improve grid stability and reliability by following mechanisms:
-Diversifying energy sources reduce the risk of failures and interruptions.
-Energy storage has fixed the big intermittency challenges of solar.
-Microinverters are making major efficiency gains.
_
Challenges of building Larger Solar Power Plants:
Building larger solar power plants poses many challenges that must be addressed to ensure their success.
Here are some challenges:
Land Use and Environmental Concerns:
One of the biggest challenges of building larger solar power plants is finding suitable land for construction. Large solar power plants require significant land, which can be challenging to find in densely populated areas. Solar power plants can significantly impact local ecosystems, including wildlife habitats and water resources.
Complex Permitting Processes and Regulatory Challenges:
Building a large solar power plant requires a complex set of permits and approvals from various regulatory agencies. Permitting processes can be time-consuming and costly, and delays can significantly impact project timelines and budgets. To overcome these challenges, developers must thoroughly understand the regulatory landscape and work closely with local governments and regulatory agencies to ensure compliance.
High Upfront Capital Costs:
Another challenge of building large scale solar power plants is the high upfront capital costs. Building a large solar power plant requires significant equipment, infrastructure, and labor investment. In order to tackle these difficulties, it is necessary to come up with innovative approaches for financing, such as exploring opportunities for government grants and incentives, as well as collaborating with other businesses to split expenses.
Integration with Existing Grid Infrastructure:
Large solar power plants need to be integrated with the existing grid infrastructure to guarantee efficient and reliable delivery of power to customers. However, incorporating a large solar power plant into the grid can be a complex process as the plant must be able to handle fluctuations in both demand and supply. To address these problems, utilities and grid operators should ensure that their projects are seamlessly integrated into the existing grid infrastructure.
Technical Challenges, such as Inverter Efficiency and Energy Storage:
Larger scale solar power plants pose many technical challenges, such as inverter efficiency and energy storage. Inverter efficiency is critical to ensuring the solar power plant can deliver power to customers efficiently and reliably. Energy storage is also essential for ensuring the solar power plant can provide power when the sun is not shining. By collaborating closely with engineers and technical experts, challenges can be solved to devise and implement proficient and successful systems for enhancing inverter efficiency and energy storage.
______
______
Solar farm:
A photovoltaic power station, also known as a solar park, solar farm, or solar power plant, is a large-scale grid-connected photovoltaic power system (PV system) designed for the supply of merchant power. They are different from most building-mounted and other decentralized solar power because they supply power at the utility level, rather than to a local user or users. This approach differs from concentrated solar power, the other major large-scale solar generation technology, which uses heat to drive a variety of conventional generator systems. Both approaches have their own advantages and disadvantages, but to date, for a variety of reasons, photovoltaic technology has seen much wider use. As of 2023, about 99% of utility-scale solar power capacity was PV.
_
In some countries, the nameplate capacity of photovoltaic power stations is rated in megawatt-peak (MWp), which refers to the solar array’s theoretical maximum DC power output. In other countries, the manufacturer states the surface and the efficiency. However, Canada, Japan, Spain, and the United States often specify using the converted lower nominal power output in MWAC, a measure more directly comparable to other forms of power generation. Most solar parks are developed at a scale of at least 1 MWp. As of 2018, the world’s largest operating photovoltaic power stations surpassed 1 gigawatt. At the end of 2019, about 9,000 solar farms were larger than 4 MWAC (utility scale), with a combined capacity of over 220 GWAC. The Xinjiang solar farm in China has just become the world’s largest solar farm, with an installed solar capacity of 5GW. Officially connected to the grid on Monday the 3rd of June, 2024, this enormous solar power plant dwarfs all others on this list. Most of the existing large-scale photovoltaic power stations are owned and operated by independent power producers, but the involvement of community and utility-owned projects is increasing. Previously, almost all were supported at least in part by regulatory incentives such as feed-in tariffs or tax credits, but as levelized costs fell significantly in the 2010s and grid parity has been reached in most markets, external incentives are usually not needed.
______
Types of solar farm:
There are two main types of solar projects that solar developers are actively pursuing right now all over.
-1. Utility solar farms:
In the case of solar farms consisting of thousands or hundreds of thousands of PV modules, the developers will sell the electricity created by the solar panels to a public utility in urban and suburban areas. In rural settings, the power will go to an electric cooperative. In these cases, the electricity generated by sun energy hitting the PV panels travels on the electric grid for widespread use by consumers or corporate entities located far from your farm. Alternatively, the developers will sell the electricity to large corporations, institutions, or university systems that have massive demands for power in centralized settings. They also want to purchase renewable energy instead of electricity generated from fossil fuels.
-2. Community solar farms:
Solar developers could also sell the electricity to locally organized groups of individuals who become subscribers to a community solar program. These people may not have the means or space to purchase their own rooftop solar system, but still wish to participate in the renewable energy revolution. According to analysis by the National Renewable Energy Laboratory, nearly 50% of households and businesses are unable to host rooftop solar systems. This may be because they don’t own their homes, have roof conditions that do not support a rooftop photovoltaic (PV) system due to shading, roof size, or other factors, or due to the upfront costs of installing home PV. The U.S. Department of Energy defines community solar as any solar project or purchasing program, within a geographic area, in which the benefits flow to multiple customers such as individuals, businesses, nonprofits, and other groups. In most cases, customers benefit from energy generated by solar panels at an off-site array. Community solar members purchase shares of the energy created on solar farm. Others interested in solar energy may enter into power purchase agreements (PPAs) with public utilities at a fixed cost for a certain length of time.
Typically, utility solar power stations are huge in comparison to community solar farms.
_
Utility-scale solar vs. community solar farms:
|
UTILITY-SCALE SOLAR FARMS |
COMMUNITY SOLAR FARMS |
|
Sell electricity directly to utilities |
Sell electricity to customers |
|
A large operation for increased energy production |
Smaller in size compared to utility-scale farms |
|
Power produced here is either owned directly by a utility or sold wholesale to utility buyers via a PPA |
Allow customers to purchase a share of the farm and the energy produced by that farm |
_____
_____
Project siting and land use:
The land area required for a desired power output varies depending on the location, the efficiency of the solar panels, the slope of the site, and the type of mounting used. Fixed tilt solar arrays using typical panels of about 15% efficiency on horizontal sites, need by conservative estimates about 1 hectare (2.5 acres)/MW in the tropics and this figure rises to over 2 hectares (4.9 acres) in northern Europe. Because of the longer shadow the array casts when tilted at a steeper angle, this area is typically about 10% higher for an adjustable tilt array or a single axis tracker, and 20% higher for a 2-axis tracker, though these figures will vary depending on the latitude and topography.
_
The best locations for solar parks in terms of land use are held to be brown field sites, or where there is no other valuable land use. A Solar landfill is a repurposed used landfill that is converted to a solar array solar farm. Even in cultivated areas, a significant proportion of the site of a solar farm can also be devoted to other productive uses, such as crop growing or biodiversity. The change in albedo affects local temperature. One study claims a temperature rise due to the heat island effect, and another study claims that surroundings in arid ecosystems become cooler. Agrivoltaics is using the same area of land for both solar photovoltaic power and agriculture. A recent study found that the value of solar generated electricity coupled to shade-tolerant crop production created an over 30% increase in economic value from farms deploying agrivoltaic systems instead of conventional agriculture.
______
Technology of solar farm:
Most solar parks are ground mounted PV systems, also known as free-field solar power plants. They can either be fixed tilt or use a single axis or dual axis solar tracker. While tracking improves the overall performance, it also increases the system’s installation and maintenance cost. A solar inverter converts the array’s power output from DC to AC, and connection to the utility grid is made through a high voltage, three phase step up transformer of typically 10 kV and above.
_
Solar array arrangements:
The solar arrays are the subsystems which convert incoming light into electrical energy. They comprise a multitude of solar panels, mounted on support structures and interconnected to deliver a power output to electronic power conditioning subsystems. The majority are free-field systems using ground-mounted structures, usually of one of the following types:
Fixed arrays:
Many projects use mounting structures where the solar panels are mounted at a fixed inclination calculated to provide the optimum annual output profile. The panels are normally oriented towards the Equator, at a tilt angle slightly less than the latitude of the site. In some cases, depending on local climatic, topographical or electricity pricing regimes, different tilt angles can be used, or the arrays might be offset from the normal east–west axis to favour morning or evening output. A variant on this design is the use of arrays, whose tilt angle can be adjusted twice or four times annually to optimise seasonal output. They also require more land area to reduce internal shading at the steeper winter tilt angle. Because the increased output is typically only a few percent, it seldom justifies the increased cost and complexity of this design.
Dual axis trackers:
To maximise the intensity of incoming direct radiation, solar panels should be orientated normal to the sun’s rays. To achieve this, arrays can be designed using two-axis trackers, capable of tracking the sun in its daily movement across the sky, and as its elevation changes throughout the year. These arrays need to be spaced out to reduce inter-shading as the sun moves and the array orientations change, so need more land area. They also require more complex mechanisms to maintain the array surface at the required angle. The increased output can be of the order of 30% in locations with high levels of direct radiation, but the increase is lower in temperate climates or those with more significant diffuse radiation, due to overcast conditions. So dual axis trackers are most commonly used in subtropical regions, and were first deployed at utility scale at the Lugo plant.
Single axis trackers:
A third approach achieves some of the output benefits of tracking, with a lesser penalty in terms of land area, capital and operating cost. This involves tracking the sun in one dimension – in its daily journey across the sky – but not adjusting for the seasons. The angle of the axis is normally horizontal, though some, such as the solar park at Nellis Air Force Base, which has a 20° tilt, incline the axis towards the equator in a north–south orientation – effectively a hybrid between tracking and fixed tilt. Single axis tracking systems are aligned along axes roughly north–south. Some use linkages between rows so that the same actuator can adjust the angle of several rows at once.
_
Power conversion:
Solar panels produce direct current (DC) electricity, so solar parks need conversion equipment to convert this to alternating current (AC), which is the form transmitted by the electricity grid. This conversion is done by inverters. To maximise their efficiency, solar power plants also vary the electrical load, either within the inverters or as separate units. These devices keep each solar array string close to its peak power point. There are two primary alternatives for configuring this conversion equipment; centralized and string inverters, although in some cases individual, or micro-inverters are used. Single inverters allow optimizing the output of each panel, and multiple inverters increases the reliability by limiting the loss of output when an inverter fails.
Centralized inverters:
These units have relatively high capacity, typically of the order between 1 MW up to 7 MW for newer units (2020), so they condition the output of a substantial block of solar arrays, up to perhaps 2 hectares (4.9 acres) in area. Solar parks using centralized inverters are often configured in discrete rectangular blocks, with the related inverter in one corner, or the centre of the block.
String inverters:
String inverters are substantially lower in capacity than central inverters, of the order of 10 kW up to 250 KW for newer models (2020), and condition the output of a single array string. This is normally a whole, or part of, a row of solar arrays within the overall plant. String inverters can enhance the efficiency of solar parks, where different parts of the array are experiencing different levels of insolation, for example where arranged at different orientations, or closely packed to minimise site area.
Transformers:
The system inverters typically provide power output at voltages of the order of 480 VAC up to 800 VAC. Electricity grids operate at much higher voltages of the order of tens or hundreds of thousands of volts, so transformers are incorporated to deliver the required output to the grid. Due to the long lead time, the Long Island Solar Farm chose to keep a spare transformer onsite, as transformer failure would have kept the solar farm offline for a long period. Transformers typically have a life of 25 to 75 years, and normally do not require replacement during the life of a photovoltaic power station.
Grid connection:
The availability, locality and capacity of the connection to the grid is a major consideration in planning a new solar park, and can be a significant contributor to the cost. Most stations are sited within a few kilometres of a suitable grid connection point. This network needs to be capable of absorbing the output of the solar park when operating at its maximum capacity. The project developer will normally have to absorb the cost of providing power lines to this point and making the connection; in addition often to any costs associated with upgrading the grid, so it can accommodate the output from the plant. Therefore, solar power stations are sometimes built at sites of former coal-fired power stations to reuse existing infrastructure.
_
Robots install solar panels:
The companies racing to build large solar farms across the United States are facing a growing problem: not enough workers. Now, they’re turning to robots for help. Recently AES, one of the country’s biggest renewable energy companies, introduced a first-of-its-kind robot that can lug around and install the thousands of heavy panels that typically make up a large solar array. AES said its robot, nicknamed Maximo, would ultimately be able to install solar panels twice as fast as humans can and at half the cost.
_
Performance ratio:
The performance ratio (PR) of a solar power plant is a metric that measures its efficiency by comparing its actual energy output to its theoretical maximum output under ideal conditions. The performance ratio is one of the most important variables for evaluating the efficiency of a PV plant. It is largely independent of the orientation of a PV plant and the incident solar irradiation on the PV plant. For this reason, the performance ratio can be used to compare PV plants supplying the grid at different locations all over the world. The performance ratio is a measure of the quality of a PV plant that is independent of location and it therefore often described as a quality factor. PR shows the proportion of the energy that is actually available for export to the grid after deduction of energy loss (e.g. due to thermal losses and conduction losses) and of energy consumption for operation. The closer the PR value determined for a PV plant approaches 100 %, the more efficiently the respective PV plant is operating. In real life, a value of 100 % cannot be achieved, as unavoidable losses always arise with the operation of the PV plant (e.g. thermal loss due to heating of the PV modules). High-performance PV plants can however reach a performance ratio of up to 80 %.
______
______
CPV:
Concentrator photovoltaics (CPV) is a photovoltaic technology that generates electricity from sunlight. Unlike conventional photovoltaic systems, it uses lenses or curved mirrors to focus sunlight onto small, highly efficient, multi-junction (MJ) solar cells. Due to Shockley–Queisser limit of mono-junction silicon PV cell, MJ solar cells are used. In addition, CPV systems often use solar trackers and sometimes a cooling system to further increase their efficiency. In addition to creating more electron-hole pairs simply by increasing the number of photons available for absorption in CPV, having a higher concentration of charge carriers can increase the efficiency of the solar cell by increasing the conductivity. Along with a proportional increase in the generated current, there also occurs a logarithmic enhancement in operating voltage, in response to the higher illumination. While considering efficiency we always consider a ratio of the output to input energy. Both output and input energies increase due to concentration, so increase in output does not necessarily mean increase in efficiency, albeit efficiency does increase marginally. Moreover, the efficiency of real solar cells cannot increase indefinitely because of power losses to heat. The amount of those losses is determined by the cell series resistance. The higher the series resistance, the bigger the power losses. Many solar cells designed for concentrated light in fact have special features to reduce the series resistance, but the limits of design may still be dependent on the cell material. For silicon, for example, it is hard to create cells that would be efficient at concentration ratios higher than 200. The power loss will grow very rapidly as the concentration ratio increases. So, there is no sense to increase concentration infinitely because those efforts may not pay off in terms of useful power increase.
Note:
Series resistance means two or more resistors are said to be connected in series when the same amount of current flows through all the resistors. Series resistance in a solar cell has three causes: firstly, the movement of current through the emitter and base of the solar cell; secondly, the contact resistance between the metal contact and the silicon; and finally the resistance of the top and rear metal contacts.
_
Systems using high-concentration photovoltaics (HCPV) possess the highest efficiency of all existing PV technologies, achieving near 40% for production modules and 30% for systems. They enable a smaller photovoltaic array that has the potential to reduce land use, waste heat and material, and balance of system costs. The rate of annual CPV installations peaked in 2012 and has fallen to near zero since 2018 with the faster price drop in crystalline silicon photovoltaics. In 2016, cumulative CPV installations reached 350 megawatts (MW), less than 0.2% of the global installed capacity of 230,000 MW that year.
_
Modern CPV systems operate most efficiently in highly concentrated sunlight (i.e. concentration levels equivalent to hundreds of suns), as long as the solar cell is kept cool through the use of heat sinks. Diffuse light, which occurs in cloudy and overcast conditions, cannot be highly concentrated using conventional optical components only (i.e. macroscopic lenses and mirrors). Filtered light, which occurs in hazy or polluted conditions, has spectral variations which produce mismatches between the electrical currents generated within the series-connected junctions of spectrally “tuned” multi-junction (MJ) photovoltaic cells. These CPV features lead to rapid decreases in power output when atmospheric conditions are less than ideal. To produce equal or greater energy per rated watt than conventional PV systems, CPV systems must be located in areas that receive plentiful direct sunlight. This is typically specified as average DNI (Direct Normal Irradiance) greater than 5.5-6 kWh/m2/day or 2000 kWh/m2/yr.
_
HCPV directly competes with concentrated solar power (CSP) as both technologies are suited best for areas with high direct normal irradiance, which are also known as the Sun Belt region in the United States and the Golden Banana in Southern Europe. CPV and CSP are often confused with one another, despite being intrinsically different technologies from the start: CPV uses the photovoltaic effect to directly generate electricity from sunlight, while CSP – often called concentrated solar thermal – uses the heat from the sun’s radiation in order to make steam to drive a turbine, that then produces electricity using a generator. As of 2012, CSP was more common than CPV.
_
Concentrated photovoltaics and thermal (CPVT):
In Concentrating Photovoltaic (CPV) systems differs from PV system is the solar radiation is concentrated on the PV cells to generate additional electricity than a normal flat panel. The disadvantages of CPV system is as the intensity of the radiation increases, so does the temperature and hence decreases the electrical efficiency of the cell. The other limitations of the CPV system includes limited application scope and requirement of efficient cooling of the PV cells. To overcome the above limitations the CPV systems were modified to utilize the thermal energy and are termed as Concentrated Photovoltaic Thermal (CPVT) systems. Like CPV system, CPVT also uses low cost optical elements and compatible with multijunction cells. The area of the PV cell is reduced due to the concentration of the optical element. The heat generated on the PV cell due to the concentration of radiation is utilized for a thermal process.
______
______
CSP plant:
Concentrating Solar Power (CSP) technologies use mirrors to concentrate (focus) the sun’s light energy and convert it into heat to create steam to drive a turbine that generates electrical power. CSP technology utilizes focused sunlight. The CSP operation principle is similar to that of a magnifying glass (De Laquil et al., 1993), with which many youngsters have experimented. Light is concentrated on a heat absorber that contains a heat transfer fluid (HTF) that is heated to temperatures between 600°C and 1200°C, depending on the technology. As a consequence of these high temperatures, thermodynamic energy conversion efficiencies are high: Carnot efficiencies are theoretically about 66% and 80% for these two temperatures, respectively. The HTF typically runs in a closed circuit through the solar receiver tubes and transfers the heat to the power block. Molten salts and thermal organic or synthetic oils meet the necessary conditions as HTF (low melting point and very high boiling point). Alternatively, the use of water/steam as heat transfer medium has also been investigated and is recently under development (de Sá et al., 2018). The power block converts the heat into electricity, generally through a thermodynamic Rankine cycle, using organic or water-based liquid as working fluid, while in parabolic dish technology, Brayton and/or Stirling cycles are used. As a heat sink in the cycle, wet cooling or dry cooling towers are used. Although water is usually not abundant in places with high solar irradiance, wet cooling towers are sometimes chosen due to their lower costs and higher efficiencies than air cooling towers (Carter and Campbell, 2009).
_
The Direct Normal Irradiance (DNI) is the amount of solar radiation received per unit area by a surface that is always held perpendicular (or normal) to the rays that come in a straight line from the direction of the Sun at its current position in the sky.
The primary energy resource of the CSP technology is direct normal irradiance (DNI), which is typically available in subtropic regions and/or high altitudes as seen in the figure below:
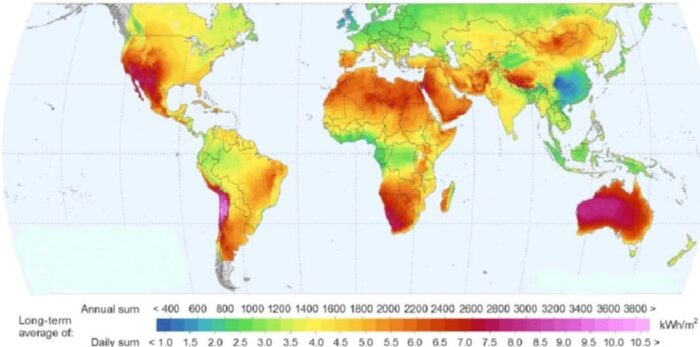
The concentration of direct sunlight takes place via reflective surfaces that are able to track the Sun in either two or three dimensions. The redirected photons subsequently heat up a fluid that is used to drive a heat engine for the generation of electricity. Therefore CSP is also referred to as solar thermal electricity. It can easily be coupled to thermal energy storage (TES), so that energy collected during periods of high solar irradiance can be used to improve dispatchability (by compensating cloudy or overnight periods).
_
Types of Concentrated Solar Power Technologies:
Concentrated solar power plants utilize various technologies to harness solar energy and convert it into electricity. Some common types include:
-1. Parabolic Trough Systems: These systems use curved, trough-shaped mirrors to concentrate sunlight onto a receiver tube filled with a heat transfer fluid. The fluid is heated to high temperatures and used to generate steam, which drives a turbine to produce electricity.
-2. Solar Power Towers: Power towers consist of a field of heliostat mirrors that track the sun and reflect sunlight onto a central receiver mounted atop a tower. The concentrated solar energy heats a heat transfer fluid, which is then used to generate steam and power a turbine.
-3. Parabolic Dish Systems: Parabolic dish systems employ large, dish-shaped mirrors to focus sunlight onto a receiver located at the focal point of the dish. The receiver absorbs the concentrated solar energy and uses it to generate electricity directly or through a heat engine.
-4. Linear Fresnel Reflectors: Linear Fresnel reflectors use flat mirrors to concentrate sunlight onto a linear receiver positioned above them. The receiver absorbs the solar energy and transfers it to a heat transfer fluid, which is then used to generate steam and produce electricity.
_
Figure below shows CSP technology options. (A) linear Fresnel reflector, (B) parabolic trough, (C) central receiver, (D) parabolic dish.
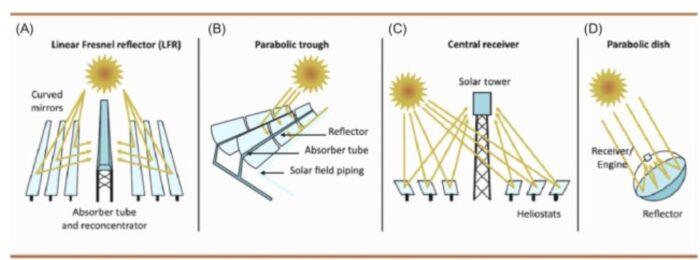
Commercial CSP technology can be generally subdivided in the following four main types, as seen in figure above: linear Fresnel reflector, parabolic trough collector, central receiver, and parabolic dish (Fernández et al., 2019). In the first two types, light is concentrated on a linear receiver, and these two types are therefore denoted as line-focus systems, with a maximum 2D concentration ratio of 210× (Twidell and Weir, 2015). The receiver typically is a steel tube inside an evacuated glass container for isolation. Typical generated temperatures are ~400°C with thermal oil as working fluid (Pitz-Paal et al., 2004), while conversion efficiencies range from 8% to 18%. In the other types, light is concentrated to a point receiver and has a maximum 3D concentration ratio of 46,000× (Twidell and Weir, 2015), with typical temperatures in the receiver of ~800°C (parabolic dish) and 600°C–1200°C (central receiver), with molten salts or thermal oils as working media (Pitz-Paal et al., 2004). Efficiencies range from 20% to 40%, which come at the expense of needing more accurate Sun tracking. Linear focus collectors achieve medium concentration factors (50 suns and over), and point focus collectors achieve high concentration factors (over 500 suns). Although simple, these solar concentrators are quite far from the theoretical maximum concentration. Recent reviews of CSP are provided by Gil et al. (2010), Teske et al. (2016), Gauche et al. (2017), Tasbirul Islam et al. (2018), and Fernández et al. (2019). According to the International Energy Agency (IEA), CSP generation increased by an estimated 34% in 2019. Although this exponential growth is impressive, there’s still some way to go until CSP reaches its Sustainable Development Goals (SDGs), which requires an average growth of 24% through 2030.
_
Typical installation sizes are between 30 and 200 MW. The first installations were commissioned in the 1980s in southwestern United States, for example, the solar electricity generating systems (SEGS) plants in California (SEGS I to SEGS IX), amounting to a total capacity of 344 MW (Fernández et al., 2019). The first development of the technology was primarily driven by the 1970s oil crisis. However, when the effects of such crisis were left behind, the development of the technology stagnated (Lovegrove and Csiro, 2012). Renewed interest after 2007 led to increased installed capacity and further developments, mainly in Spain and in the United States. The development in Spain was prompted by an ambitious plan for renewable energies, combined with a high DNI availability. Spain is one of the few countries in Europe with annual DNI values higher than 2000 kWh/m2, which is considered a threshold to achieve reasonable economic performance (Viebahn et al., 2008). However, the European financial crisis forced Spain to cut down in 2013 on the subsidies that had favored the CSP rapid expansion. The absence of political incentives, combined with the still low state of development and high costs, led to a stagnation of the sector (San Miguel and Corona, 2018). In addition, the unexpected fast decrease in cost of electricity from photovoltaic (PV) solar energy decreased the economic competitiveness of the technology (Gauche et al., 2017).
_
Spain is the country with the most CSP installations in the world – a total of nearly 50 power plant that add up to 2,300 MW – and it is the global leader of this technology. As of 2021, global installed capacity of concentrated solar power stood at 6.8 GW. As of 2023, the total was 8.1 GW, with the inclusion of three new CSP projects in construction in China and in Dubai in the UAE. The U.S.-based National Renewable Energy Laboratory (NREL), which maintains a global database of CSP plants, counts 6.6 GW of operational capacity and another 1.5 GW under construction.
Present costs of new CSP plants range from 3500 to 6000$/kW for systems without TES; 6000–9000$/kW for systems with 6-hour thermal storage (Fernández et al., 2019). This leads to power purchase agreements, which typically are used to secure investment, at 0.12–0.40$/kWh, which is considerably higher than for PV. It is noteworthy that some 15 years ago, cost of electricity was estimated at 0.20–0.30$/kWh depending on location (Pitz-Paal et al., 2004; Sargent and Lundy LLC Consulting Group, 2003).
_
CSP Efficiency:
The efficiency of a concentrating solar power system will depend on the technology used to convert the solar power to electrical energy, the operating temperature of the receiver and the heat rejection, thermal losses in the system, and the presence or absence of other system losses; in addition to the conversion efficiency, the optical system which concentrates the sunlight will also add additional losses.
Real-world systems claim a maximum conversion efficiency of 23-35% for “power tower” type systems, operating at temperatures from 250 to 565 °C, with the higher efficiency number assuming a combined cycle turbine. Dish Stirling systems, operating at temperatures of 550-750 °C, claim an efficiency of about 30%. Due to variation in sun incidence during the day, the average conversion efficiency achieved is not equal to these maximum efficiencies, and the net annual solar-to- electricity efficiencies are 7-20% for pilot power tower systems, and 12-25% for demonstration-scale Stirling dish systems.
To compare this to the electricity conversion efficiencies of other renewable energy technologies, wind turbines can achieve up to 59 percent efficiency, and hydropower systems can have efficiencies of up to 90 percent. When it comes to solar photovoltaics, the conversion efficiencies of solar cells are in a similar range as CSP; most solar panels available on the market today have efficiencies between 14 and 23 percent.
Supercritical carbon dioxide can be used instead of steam as heat-transfer fluid for increased electricity production efficiency. However, because of the high temperatures in arid areas where solar power is usually located, it is impossible to cool down carbon dioxide below its critical temperature in the compressor inlet. Therefore, supercritical carbon dioxide blends with higher critical temperature are currently in development.
_
Power Cycles:
The power cycle is a series of processes that a working substance goes through. This cycle involves heat and work transfer, leading to the conversion of thermal energy into mechanical energy. Power cycles are used in all thermal energy plants—including coal, natural gas, and nuclear energy plants—to convert heat into electricity. Concentrating solar-thermal power (CSP) plants are no different, but use sunlight to generate the heat to power a turbine. Conventional power cycles primarily use steam as the working fluid to drive turbines, but advanced power cycles under consideration for CSP use supercritical carbon dioxide, which can reach higher efficiencies at lower cost than steam-based cycles.
Simply put, higher temperature input to the power cycle leads to a higher efficiency to convert thermal energy to electricity. Existing CSP systems are only able to deliver steam at approximately 550 °C. With next generation CSP plants that will be able to collect and store heat above 700 °C, the development of supercritical carbon dioxide-based cycles have the potential to achieve low capital costs of less than $900 per kilowatt for cycles that have thermal-to-electric efficiency of greater than 50%. This will significantly lower the cost of the electricity generated by CSP plants. The Department of Energy Solar Energy Technologies Office (SETO) set a cost goal of $0.05 per kilowatt-hour for baseload CSP plants with at least 12 hours of thermal energy storage.
______
______
CSP as dispatchable solar:
Future power systems will have higher needs for so-called dispatchable generation, i.e. plants that can adjust their power output on demand at the request of power grid operators, like opening the water tap. This flexibility will be necessary when a bigger share of the power will be coming from variable, non-dispatchable, renewable energy sources relying on the unreliable weather in order to generate power. As a thermal energy generating power station, CSP has more in common with thermal power stations such as coal, gas, or geothermal. A CSP plant can incorporate thermal energy storage, which stores energy either in the form of sensible heat or as latent heat (for example, using molten salt), which enables these plants to continue supplying electricity whenever it is needed, day or night. This makes CSP a dispatchable form of solar. Dispatchable renewable energy is particularly valuable in places where there is already a high penetration of photovoltaics (PV), such as California, because demand for electric power peaks near sunset just as PV capacity ramps down (a phenomenon referred to as duck curve). The effectiveness of CSP plants lies in their capabilities to store large amounts of thermal energy that are collected during the day using thermal energy storage, allowing the plant to store this energy and dispatch it during the night. As a result, CSP plants can deliver power on demand, giving them an economic advantage over other renewable energy technologies. The principal advantage of CSP is the ability to efficiently add thermal storage, allowing the dispatching of electricity over up to a 24-hour period. Since peak electricity demand typically occurs at about 5 pm, many CSP power plants use 3 to 5 hours of thermal storage.
_
Molten salts can store the sun’s heat during the day and provide power at night:
Because most salts only melt at high temperatures (table salt, for example, melts at around 1472 degrees Fahrenheit, or 800 degrees Celsius) and do not turn to vapor until they get considerably hotter—they can be used to store a lot of the sun’s energy as heat. Simply use the sunlight to heat up the salts and put those molten salts in proximity to water via a heat exchanger. Hot steam can then be made to turn turbines without losing too much of the original absorbed solar energy.
The salts—a mixture of sodium and potassium nitrate, otherwise used as fertilizers—allow enough of the sun’s heat to be stored that the power plant can pump out electricity for nearly eight hours after the sun starts to set. Melting salts at temperatures above 435 degrees Fahrenheit (224 degrees Celsius) can deliver back as much as 93 percent of the energy, plus the salts are ubiquitous because of their application as fertilizers.
The round trip efficiency is the ratio of the electricity output from the storage device to the electricity input to the device during one charge/discharge cycle. It accounts for the losses which occur as a result of storing and withdrawing energy from the energy storage device. Basically, it’s a measure of how much electricity is produced if the thermal energy that’s generated is first stored and then used compared to just directly taking the energy. That number is around 93 percent with molten salt. For things like compressed air and mechanical type storage, there’s more significant losses, an average of at least 20 percent over all the various technologies.
_
Thermal energy storage at CSP power plants costs roughly $50 per kilowatt-hour to install, according to NREL. But it doesn’t add much to the cost of the resulting electricity because it allows the turbines to be generating for longer periods and those costs can be spread out over more hours of electricity production. Electricity from a solar-thermal power plant costs roughly 13 cents a kilowatt-hour, both with and without molten salt storage systems. That price is still nearly twice as much as electricity from a coal-fired power plant—the current cheapest generation option if environmental costs are not taken into account. But we can use solar energy to meet the maximum electricity demand later in the day as peak demand [for electricity] is later in the evening, once solar production is trailing off. That’s the reason we are so interested in storage technology.
_
As efficient as solar-thermal power plants using parabolic troughs with molten salt storage systems like Andasol 1 or Solana are, they don’t capture as much of the sun’s heat as is possible. Above 750 degrees F (400 degrees C), the synthetic oils used to capture the sun’s heat in the troughs begin to break down, but the molten salts can take in much more heat than that. To allow the salts to get hotter, some companies, such as SolarReserve in Santa Monica, Calif., are developing so-called power towers—vast fields of mirrors that concentrate sunlight onto a central tower. Because of the centralized design such a structure can operate at much higher temperatures—up to 1,000 degrees F (535 degrees C)—and use molten salts directly as the fluid transferring heat in the power plant.
_____
_____
Concentrating Solar Power to Decarbonize the Hard-To-Decarbonize:
Concentrating solar power plants are complex systems. Instead of using specialized materials to draw electricity from a solar panel, they deploy specialized mirrors to bounce solar energy from a wide field of points onto a much narrower field, where it heats a store of molten salt or a specialized oil. The heated liquid can be piped to a generating station, where it boils water to produce steam to run a turbine and generate electricity, as in a conventional power plant. Or, the liquid can be used simply as heat to run industrial processes.
Solar power generated enough heat to power a steel furnace:
A new proof-of-concept device trapped solar radiation and used it to heat an object to a blistering 1,800 degrees Fahrenheit (1,000 degrees Celsius), raising hopes that steel furnaces could be powered by solar energy. Scientists have used solar power to heat an object to 1,800 degrees Fahrenheit (1,000 degrees Celsius) — hot enough to power a steel furnace. The proof-of-concept study, published in the journal Device, demonstrates how solar energy could replace fossil fuels in high-temperature manufacturing processes, such as smelting steel. To manufacture materials like glass, cement and ceramics, raw materials are heated to above 1,800 F (1,000 C). Currently, using solar energy to reach these scorching temperatures is costly and inefficient, so carbon-based energy like oil or coal are typically used to power the furnaces in which these materials are made. These industries are responsible for around 25% of global energy consumption. To tackle climate change, we need to decarbonize energy in general. People tend to think about electricity as energy, but in fact, about half of the energy is used in the form of heat.
Scientists have previously explored solar receivers, or heating systems that convert solar radiation into heat via sun-tracking mirrors, but that technology struggles to break the 1,800 F barrier. In the new study, researchers drew upon a property called the thermal-trap effect. Essentially, semi-transparent materials strongly absorb sunlight, re-emitting it as heat. So the researchers shined incoming solar radiation onto a synthetic quartz rod that trapped the heat. They then attached it to an opaque silicon dish, which absorbed the heat from the crystal. When the incoming light shined with the intensity 135 suns, the absorber plate climbed to 1,922 F (1,050 C), while the quartz rod stayed at 1,112 F (600 C).
_____
_____
Environmental effects of CSP:
CSP has a number of environmental effects, particularly on water use, land use and the use of hazardous materials. Water is generally used for cooling and to clean mirrors. Some projects are looking into various approaches to reduce the water and cleaning agents used, including the use of barriers, non-stick coatings on mirrors, water misting systems, and others.
_
Water use and management:
Water availability is a challenge for constructing any thermoelectric power plant, not just CSP, in arid and semi-arid locations with high water demand. Concentrating solar power plants with wet-cooling systems have the highest water-consumption intensities of any conventional type of electric power plant; only fossil-fuel plants with carbon-capture and storage may have higher water intensities. A 2013 study comparing various sources of electricity found that the median water consumption during operations of concentrating solar power plants with wet cooling was 3.1 cubic metres per megawatt-hour (810 US gal/MWh) for power tower plants and 3.4 m3/ MWh (890 US gal/MWh) for trough plants. This was higher than the operational water consumption (with cooling towers) for nuclear at 2.7 m3/MWh (720 US gal/MWh), coal at 2.0 m3/MWh (530 US gal/MWh), or natural gas at 0.79 m3/MWh (210 US gal/MWh). A 2011 study by the National Renewable Energy Laboratory came to similar conclusions: for power plants with cooling towers, water consumption during operations was 3.27 m3/MWh (865 US gal/MWh) for CSP trough, 2.98 m3/MWh (786 US gal/MWh) for CSP tower, 2.60 m3/MWh (687 US gal/MWh) for coal, 2.54 m3/MWh (672 US gal/MWh) for nuclear, and 0.75 m3/MWh (198 US gal/MWh) for natural gas. The Solar Energy Industries Association noted that the Nevada Solar One trough CSP plant consumes 3.2 m3/MWh (850 US gal/MWh). The issue of water consumption is heightened because CSP plants are often located in arid environments where water is scarce.
_
CSP facilities require a large amount of water to create energy. This water is used for mirror cleaning, steam creation, and cooling when wet cooling is employed. As a result, the most significant aspect of the requirements that must be improved is wet cooling. Wet cooling takes significantly more water than dry cooling; the Noor 1 plant in Morocco uses around 74% of total water consumption for the wet cooling process as provided by experimental data from the power plant. A. Liqreina et al. compared the Andasol 1 power plant in Spain that uses wet cooling system to the identical but dry-cooled power plant in Jordan, the following results were obtained: the total efficiency of the dry cooled plant in Ma’an is lowered by 3.1%, and the water usage is reduced by 92%. Energy yield improved by 21.8%, while LCOE decreased by 18.8%. The findings of this study show that dry-cooled CSP power plants in locations with considerably high DNI values are an appealing economic and technical alternative to explore in future project development. In 2007, the US Congress directed the Department of Energy to report on ways to reduce water consumption by CSP. The subsequent report noted that dry cooling technology was available that, although more expensive to build and operate, could reduce water consumption by CSP by 91 to 95 percent. A hybrid wet/dry cooling system could reduce water consumption by 32 to 58 percent.
_
Effects on wildlife:
Insects can be attracted to the bright light caused by concentrated solar technology, and as a result birds that hunt them can be killed by being burned if they fly near the point where light is being focused. This can also affect raptors who hunt the birds. Federal wildlife officials were quoted by opponents as calling the Ivanpah power towers “mega traps” for wildlife. Some media sources have reported that concentrated solar power plants have injured or killed large numbers of birds due to intense heat from the concentrated sunrays. Some of the claims may have been overstated or exaggerated. According to rigorous reporting, in over six months, 133 songbirds were counted at Ivanpah.
______
______
CSP vs PV power plant:
Concentrated solar power (CSP) and photovoltaics (PV) are two types of systems, which have different ways of functioning with solar energy. CSP plants concentrate radiation of the sun to heat a liquid substance, which then produces electricity. Photovoltaics use sunlight to directly generate an electric current. Storage of CSP systems can store energy while feasible commercial energy storage system does not yet exist for PV power plant. CSP plants usually occupy 10 acres per megawatt and require a considerable amount of iron and cement. They are water-intensive. PV occupy 8 acres per megawatt and need critical materials such as indium and rare earth elements.
_
In the 1980s, CSP seemed set to beat solar PV. While the latter relied on expensive solar modules more often used in small consumer electronics than in power plants, the former used tried and true technology borrowed from coal plants in order to produce vapor and drive a turbine. Twenty-five years later, the face of solar energy has changed dramatically. In 2010 PV had a global installed capacity of approximately 35 GW, compared with CSP’s 1.5 GW.
Over the last few years two factors have contributed the most for the dominance of PV over CSP:
Market size:
PV can be installed almost everywhere CSP can, but not the other way around. Current commercial CSP technology needs higher levels of irradiance (typically those of the sunbelt countries), access to water (just like a coal plant) and large-scale deployments (typically more than 20 MW, compared with the few kW of a residential PV system). This means that there are more tech companies, investors and policy makers interested in PV than in CSP.
Technological simplicity:
A PV system is like a quartz watch, whereas a CSP system is like a mechanical watch. The former revolves around the solar cell, while the latter is a combination of equally critical components. This has allowed the PV industry to focus on solving one issue — driving down the cost per Watt — while the CSP industry is spread across multiple challenges e.g. improving the optical efficiency of collectors, researching new heat transfer fluids or procuring higher efficiency turbines.
_
CSP has one major advantage over PV: dispatchability.
Current CSP plants can store thermal energy for up to 16 hours, which means that their production profile can match the demand profile (just like a conventional power plant). PV is not dispatchable, as a feasible commercial energy storage system does not yet exist. Dispatchability will be increasingly important when and where renewable energies achieve high penetration rates, so two things can happen: CSP becomes a commercially viable solution before a commercial PV storage system is developed, carving its own market segment; or the PV industry quickly solves the storage issue and becomes the solar technology of choice.
_
Both Photovoltaic (PV) and Concentrated Solar Power (CSP) technologies offer unique advantages and face distinct challenges in harnessing solar energy for electricity generation. While PV systems dominate the market with their widespread use in residential and commercial applications, CSP technologies excel in large-scale utility projects with their higher efficiency levels. The choice between PV and CSP depends on various factors, including project scale, geographic location, and economic considerations. PV systems, with their decreasing costs and continuous efficiency improvements, are well-suited for decentralized applications. In contrast, CSP technologies, despite facing cost challenges, present a compelling option for utility-scale projects in regions with high direct sunlight. As the global transition towards sustainable energy continues, ongoing research and technological advancements will likely bridge the gaps between PV and CSP, making both technologies more efficient, cost-effective, and environmentally friendly. Ultimately, the successful integration of solar technologies into the mainstream energy landscape will depend on a balanced consideration of efficiency, cost, and environmental sustainability.
____
Synergies between PV Technologies, Solar Thermal Systems, and Energy Storage:
Researchers have explored the potential synergies between PV technologies, solar thermal systems, and energy storage to enhance overall system performance, increase energy utilization, and improve system economics. A study by Othman et al. investigated the synergistic combination of PV and solar thermal systems in a hybrid solar energy system. The study showed that the integrated system achieved a solar fraction of up to 86%, demonstrating the synergistic benefits of combining PV and solar thermal technologies for efficient energy conversion and utilization. Furthermore, the integration of energy storage with PV and solar thermal systems has been explored to enhance the self-consumption of solar energy and increase system reliability. For example, Yao et al. (2020) analyzed the synergies between PV, solar thermal, and energy storage systems in a residential microgrid. The study demonstrated that the integrated system achieved a self-sufficiency rate of up to 62.13%, indicating the potential for increased solar energy utilization and reduced reliance on the grid. A similar study was conducted by Astolfi et al. and found an overall energy self-sufficiency rate of 74.9%. In another study, Tercan et al. explored the synergies between PV, solar thermal, and battery energy storage systems. The study showed that the integrated system achieved a self-consumption rate of up to 94.2%, indicating a high level of utilization of solar energy and reduced dependence on the grid. Furthermore, a study by Fachrizal et al. investigated the synergies between PV, solar thermal, and heat storage systems in a multi-energy system. The study demonstrated that the integrated system achieved an energy self-sufficiency rate of 71%, indicating the potential for significant energy autonomy and reduced environmental impact. These studies highlight the synergistic benefits of integrating PV technologies, solar thermal systems, and energy storage. The findings demonstrate the potential for achieving high levels of energy self-sufficiency, increased utilization of solar energy, and reduced dependence on the grid through the integration of these technologies.
_____
_____
Hybrid solar power plant:
A hybrid system combines solar with energy storage and/or one or more other forms of generation. Hydro, wind and batteries are commonly combined with solar. The combined generation may enable the system to vary power output with demand, or at least smooth the solar power fluctuation. There is much hydro worldwide, and adding solar panels on or around existing hydro reservoirs is particularly useful, because hydro is usually more flexible than wind and cheaper at scale than batteries, and existing power lines can sometimes be used
_
Installed PV and wind power capacity has reached 1441 GW by the end of 2020, accounting for half of the global installed renewable energy capacity, and the International Energy Agency (IEA) suggests that solar and wind energy will provide more than half of additional power generation in 2040 in the Stated Policies Scenario. However, the penetration of variable PV and wind power into conventional power grids may have a significant impact on the reliability of power systems. Hydropower is expected to play a critical role in peak shaving, frequency regulation, and energy storage, making it an excellent complement to intermittent renewable energy sources. Thus, developing hydro-PV-wind hybrid systems is a promising way to reduce power grid fluctuation caused by the intermittency of wind and PV power, and to accommodate more clean energy. China is planning to construct a number of large-scale hydro-PV-wind hybrid systems based on cascade hydropower stations on the Jinsha River, Yalong River and Lancang River in the next few years with an expected installed capacity of 10–60 GW.
_
According to many renewable energy experts, a small “hybrid” electric system (figure below) that combines home wind electric and home solar electric (photovoltaic or PV) technologies offers several advantages over either single system. In much of the United States, wind speeds are low in the summer when the sun shines brightest and longest. The wind is strong in the winter when less sunlight is available. Because the peak operating times for wind and solar systems occur at different times of the day and year, hybrid systems are more likely to produce power when you need it.
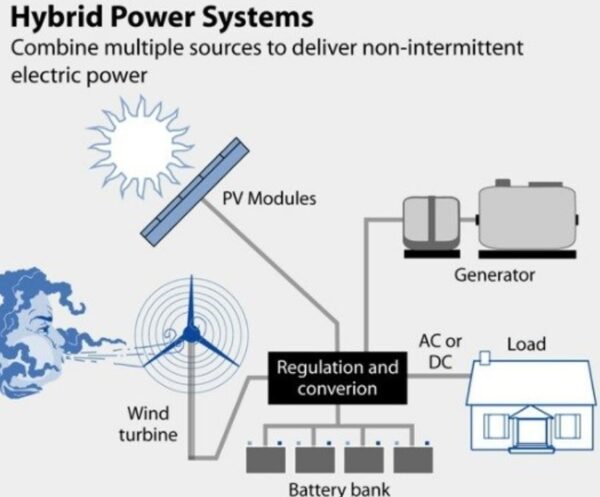
_
Due to the cost-competitive and environment-friendly nature of renewable electricity (RE), specifically from solar photovoltaic (PV) and wind power, RE has gained substantial attention as an alternative to fossil fuel-based power generation and supply to electricity grids around the world. According to the 2021 annual report on renewable capacity statistics by the International Renewable Energy Agency (IRENA), more than 80% of all new electricity capacity added in 2020 was for renewable power generation, with solar PV and wind power plants accounting for 91% of this added RE capacity.
However, the variable and uncertain nature of wind and solar resources makes it difficult to design and operate a highly reliable electricity system that is majorly dependent on these renewable resources. This variability leads to mismatches between supply and demand of electricity, which calls for electricity storage and hence require additional investments. According to literature, one potential solution to reduce storage needs is the hybridization of different RE sources, such as solar-wind hybridization, since mixes of RE sources may manifest a lower variability or be better aligned with demand than the individual RE sources constituting the mix. This has led to the concept of RE complementarity or synergy, which entails RE sources partially balancing each other. RE synergy can impact power systems by reducing electricity supply variability, providing a supply and demand power balance, and thus potentially helping in lowering system cost (by reducing the dependence on storage).
_
World’s largest wind-solar hybrid complex in India:
India’s Adani Green Energy Ltd recently announced the commissioning of a 600-MW wind-solar complex in Rajasthan, touted as the largest one of its kind globally. The hybrid park is located in the city of Jaisalmer and consists of a photovoltaic (PV) farm with bifacial modules and single-axis tracking systems and co-located wind turbines. Adani Green will run the huge complex through a 25-year power purchase agreement (PPA) with the Solar Energy Corporation of India (SECI), selling its output at INR 2.69 (USD 0.033/EUR 0.034) per kWh. Adani Green aims at having 45 GW of renewable power production capacity by 2030. Currently, its total renewable portfolio, including projects under development and construction, stands at 20.4 GW.
_
China completes world’s first hybrid offshore wind-solar power plant in 2022:
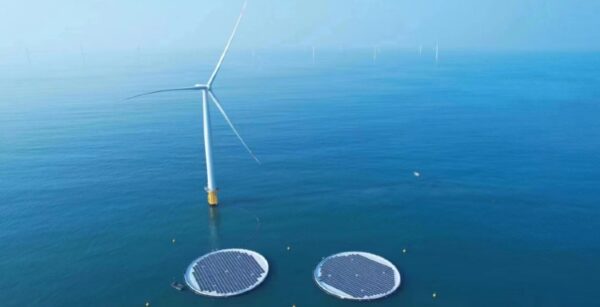
Figure above shows that two floaters are connected to the grid via the wind turbine.
China commissioned the first ever commercial floating solar power plant on the sea. At the same time, it integrated it with an offshore wind turbine, creating the first such hybrid power plant. The project unlocks the potential of hybrid offshore power plants with increased efficiency and lower levelized cost of energy (LCOE), the benchmark ratio of lifetime expenses and energy output. The two floaters, with a peak capacity of 0.5 MW, are connected to the transformer on wind turbine, which is in turn linked to a submarine cable. The performance of floating photovoltaic panels, also known as floatovoltaics, benefits from water cooling them from below [vide infra]. They are currently installed on lakes. The proponents of the technology point out that covering a lake reduces evaporation, which is useful for hydropower plant operators and water supply.
_
Hydro-solar Hybrid (floating and non-floating type):
Historically, ground-mounted solar parks have been easier to develop on broad areas of flat land. Hydropower, in contrast, requires steeper terrain so that water can flow, making it in theory quite complicated for both energy sources to be located in the same spot. Even so, floating solar power opens wide the possibility to deploy large-scale solar power close to existing hydropower projects. More energy, meaning more revenues, can be produced from the same location, sharing some of the existing assets like electrical infrastructure and existing transmission lines to evacuate the power.
In addition, hydropower operators are struggling with more and more stringent constraints: providing flexibility to power systems, but also coping with more demanding water management. Hydropower projects are often multi-purpose: managing drinking water, water supply to the industry, irrigation and recreational activities. Dealing with multiple stakeholders adds complexity, and conflicts can emerge in relation to the operation of the reservoir.
A hybrid power plant, operating simultaneously the solar and hydro parts, can answer to the challenges of both energy sources. Hydropower compensates for the unstable solar power production by its rapidly adjustable output, whereas solar power contributes to saving water on mid- to long-term scheduling, providing seasonal and daily flexibility. With an even more firm and dispatchable power output, the operator can then increase electricity sales and seek higher prices.
The best hybrid example (which is not floating) is currently located in China: the Longyangxia power plant, in operation since 2014. Hybrid in this setting means that the hydropower and solar power are connected in the same system.
The Electricity Generating Authority of Thailand (EGAT), a state-owned enterprise, has put the 45MW hydro-floating solar hybrid – deemed as the world’s largest – into commercial operation at Sirindhorn Dam. The clean energy hybrid, located in Ubon Ratchathani Province, began commercial operation on 31 October 2021, with an aim to enhance Thailand’s power system security, reduce greenhouse gas emissions of around 47,000 tons/year, and provide clean energy to help mitigate global warming. The main feature of hybrid power plant at Sirindhorn Dam is its ability to generate electricity from both solar power during the day, and hydropower from the existing dam when there is no sunlight, or during peak power demand at nighttime.
_
Potential assessment of large-scale hydro-photovoltaic-wind hybrid systems on a global scale, a 2021 study:
Large-scale hydro-photovoltaic-wind hybrid systems have the potential to improve flexibility with multiple renewable energy sources. However, few studies have investigated the optimal configuration of hybrid systems, especially on a global scale. This paper examines the regulation capacity of global reservoirs and the characteristics of wind and solar resources, thereby configuring hybrid energy systems at 3080 selected sites around the world. The operation schemes of each hybrid system are simulated, and the optimal sizes of wind and PV power plants are determined considering the risks and benefits of systems. The results show that the total potential installed capacity is 1699 GW with an electricity generation of 4348 TW-hours per year. Hydropower, PV and wind power account for 67%, 20% and 13% of the total electricity generation, respectively, and the largest potential is found in the Asia-Pacific region (40%). The fluctuation ratios of hybrid systems are 78–99% lower than those of independent systems, and integration of wind and PV power into hydropower results in an increase in the average utilization efficiency of transmission networks from 50% to 72%. It is expected that 3900 GW of additional PV and wind power will be produced by 2040, 26% of which could be provided by hybrid systems. The results indicate that large-scale hydro-PV-wind hybrid systems could make important contributions to the global transition to low-carbon energy systems.
_____
_____
Section-13
Floating solar power:
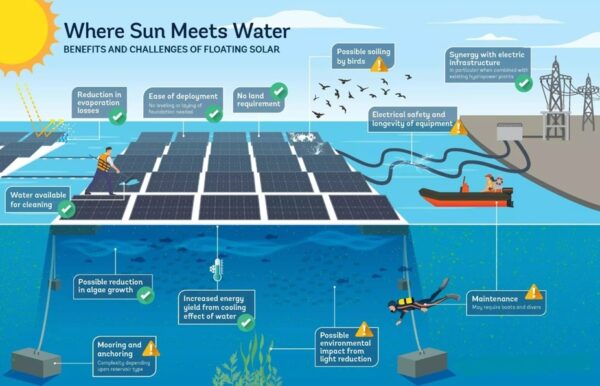
Floating solar photovoltaics (FPV) is emerging as a complement to conventional solar power on buildings and ground-mounted and as an interesting solution for hydropower developers. The concept is quite simple: using conventional solar panels installed on floating structures such as floats, pontoons or membranes, while the whole system is firmly anchored and connected to the electrical connection onshore. From the Brazilian Amazon to Japan, floating solar panels are experiencing a boom around the world. Floating solar capacity has grown hugely in the past decade, from 70 MWp in 2015 to 1,300MWp in 2020. The market for the technology is expected to grow by 43% a year over the next decade, reaching $24.5bn (£21.7bn) by 2031.
_
The rise of floating solar technology is among the latest trends in the revolutionary expansion of solar PV electricity in recent years. Globally, solar PV capacity has increased almost 12-fold in the past decade, from 72GW in 2011 to 843GW in 2021. The technology now accounts for 3.6% of global electricity generation, up from 0.03% in 2006. At the same time, solar arrays have seen an astonishing price drop which has made them the world’s cheapest source of power. Covering just 10% of all man-made reservoirs in the world with floating solar would result in an installed capacity of 20 Terawatts (TW) – 20 times more than the global solar photovoltaic (PV) capacity today, according to an analysis by Solar Energy Research Institute of Singapore (Seris). But currently less than 1% of the world’s solar installations are floating. This is partly due to technical and financial constraints – saltwater causes corrosion and positioning panels at an angle is tricky and expensive on a floating platform. Installations on freshwater bodies may also face opposition if they compete with other activities, such as swimming, boating or angling.
_
The advantages of floating solar power are many:
-i) it saves land surface, reducing land pressure on settlements or agricultural areas (locations with high levels of conflicting interests) and decreasing land acquisition costs; Japan is investing heavily in floating solar farms because of limited land availability or very expensive land;
-ii) it is quite easy to deploy which limits site preparation and civil works;
-iii) floating sun-powered farms solve a problem plaguing conventional solar energy: inefficiency when solar panels become too hot. Solar PV panels typically operate at peak efficiency between 15C and 35C (59F and 95F), but they can get as hot as 65C (149F), hindering efficiency. In fact, floating solar panels generate extra energy because of the cooling effect of the water they hover over; Floating solar plant is expected to generate up to 15 percent more energy than a land-based array;
-iv) covering water surfaces limit evaporation, saving more water for hydropower or irrigation uses; and
-v) to a certain degree, covering water surfaces can also limit algae growth, thus improving water quality for fresh water supply.
_
Of course, developing floating solar power must also come with its share of caution, especially regarding environmental and social impacts, for instance for the aquatic fauna and flora, and fisheries. Extreme conditions could be a challenge and good anchoring and mooring is needed. The design must take into consideration wind, waves, water level variations, ice, floating objects, corrosion, UV, etc. Maintenance may also be more difficult than on land: equipment longevity on ever-moving floating structures needs to be monitored, electrical protection on water can be tricky, and access for personnel may not be so easy.
_
Hydro dams are the world’s largest renewable energy source. But in some areas of the world, such as Africa, increasing droughts caused by climate change could threaten their future potential, the International Energy Agency has warned. One study found that solar panels floating on just 1% of Africa’s hydropower reservoirs could double the continent’s hydropower capacity and increase electricity generation from dams by 58%. There is “strong potential” for FPV installation to be used in combination with existing hydropower infrastructure to boost electricity generation.
_
Floating solar photovoltaic panels could supply all the electricity needs of some countries, new research has shown. The study, by researchers from Bangor and Lancaster Universities and the UK Center for Ecology & Hydrology, aimed to calculate the global potential for deploying low-carbon floating solar arrays. The researchers calculated the daily electrical output for floating photovoltaics (FPVs) on nearly 68,000 lakes and reservoirs around the world, using available climate data for each location. The researchers’ calculations included lakes and reservoirs where floating solar technology is most likely to be installed. They were no more than 10km from a population center, not in a protected area, didn’t dry up and didn’t freeze for more than six months each year. The researchers calculated output based on FPVs covering just 10% of their surface area, up to a maximum of 30 km2. While output fluctuated depending on altitude, latitude and season, the potential annual electricity generation from FPVs on these lakes was 1,302 terawatt hours (TWh), around four times the total annual electricity demand of the UK. When the figures were considered country-by-country, five nations could meet their entire electricity needs from FPVs, including Papua New Guinea, Ethiopia and Rwanda. Others, such as Bolivia and Tonga, would come very close, respectively meeting 87% and 92% of electricity demand.
______
______
Section-14
Space solar:
Spacecraft and satellites in space need a tremendous amount of energy to be operational. Before solar was a viable solution for providing this power, batteries were used. The only problem is that batteries have a set capacity, and without any means to recharge these batteries, they become useless when they run out of energy. Solar panels paired with batteries are a much better option because they provide a constant stream of renewable energy. Right now, solar is used to provide electricity to the computer systems and other systems that are used to monitor and control various parts of the spacecraft. The ultimate goal, however, is to use solar energy to propel spacecraft and minimize or completely remove the need for other sources of fuel. This would have serious implications for space travel in a very positive way.
_
There are two types of solar cells that are common in spacecraft:
Silicon cells covered in thin glass, and Multi-junction cells made up of gallium arsenide and other similar materials.
The silicon cells that are covered with glass are pretty similar to conventional solar panels, but they are further improved to handle radiation and extreme temperatures. This type of panel can be found on the International Space Station, which currently holds the majority of solar panels found in space. The solar cells that are made up of gallium arsenide are much more efficient, and as a result, are sometimes a better option when physical space is a concern. These panels can reach up to around 34% efficiency vs. the 15-20% that most commercial solar panels can reach.
Spacecraft operating in the inner Solar System usually rely on the use of power electronics-managed photovoltaic solar panels to derive electricity from sunlight. Outside the orbit of Jupiter, solar radiation is too weak to produce sufficient power within current solar technology and spacecraft mass limitations, so radioisotope thermoelectric generators (RTGs) are instead used as a power source.
Satellites in space are also equipped with solar panels that can follow the direction of the sun to maximize their absorption of sunlight. Sun rays in space are even more abundant than on Earth, due to the absence of an atmosphere. About 27 % of solar energy gets either reflected or absorbed on its way to Earth’s surface through clouds, gases, and dust. The solar panels found in many satellites in space also include a folding structure that allows the panels to expand while the spacecraft is in orbit. This format is also used in the International Space Station.
Lastly, the solar panels in space do not need to convert DC electricity into AC. On Earth, your electricity all of your electronics run on AC power. This is why it is necessary to have a solar inverter to convert the base DC electricity from your panels into AC. AC power is also useful for transmitting electricity over long distances. Because the electricity that a satellite in space or other spacecraft does not need to travel these distances, it can stay in the DC format. This also helps reduce the amount of hardware needed for these systems.
_
Space Solar Tech is built more durable and efficient:
Overall, there are many similarities between space-based solar panels and conventional solar panels. They both include cells that are made of conductive material (usually silicon) and are fit into arrays. The biggest difference has to do with the overall quality and durability of the modules. In space, there is extreme heat, cold, and radiation. This is accounted for in space-based solar panels and naturally influences the state of the hardware. Also, NASA is constantly experimenting with different semiconductor materials for producing better solar cells for space. Gallium arsenide is one example of this, and there should be many new innovations on the way!
______
______
Space-Based Solar Power (SBSP) for Earth:
Solar energy generation has grown far cheaper and more efficient in recent years, but no matter how much technology advances, fundamental limitations will always remain: solar panels can only generate power during the daytime, clouds often get in the way and much of the sunlight is absorbed by the atmosphere during its journey to the ground. What if instead we could collect solar power up in space and beam it down to the surface? Sunlight is more intense at the top of the atmosphere compared to surface of the Earth. And up at a sufficiently high orbit sunlight would be available on a continuous basis, so we have to capture all the sunlight available, and beam it to receiving stations across the planet, wherever it is needed.
_
The basic concept has been around for a long time, but has been given fresh urgency by the need for new sources of clean and secure energy to aid our transition to a Net Zero carbon world by 2050. Decades of research has led to a diversity of concepts using different forms of power generation, conversion and transmission principles. The so-called reference design transforms solar power into electricity via photovoltaic cells in geostationary orbit around Earth. The power is then transmitted wirelessly in the form of microwaves at 2.45 GHz to dedicated receiver stations on Earth, called ‘rectennas’, which convert the energy back into electricity and feed it into the local grid. Because the power is transferred wirelessly it will be possible to transfer it to receiver station where it is required, even to the Moon or other planets, where a readily available energy supply will boost our ability to explore these locations.
_
Space-Based Solar Power, SBSP, is based on existing technological principles and known physics, with no new breakthroughs required. Today’s telecom satellites transmitting TV signals and communication links from orbit are basically power-beaming satellites – except at a far smaller scale of size and power. The biggest challenge is that – in order to generate optimal, economically-viable levels of solar power – the required structures need to be very large, both on Earth and in space. A single solar power satellite at geostationary orbit might extend more than a kilometre across, with the receiver station on the ground needing a footprint more than ten times larger. A single solar power satellite of the planned scale would generate around 2 gigawatts of power, equivalent to a conventional nuclear power station, able to power more than one million homes. It would take more than six million solar panels on Earth’s surface to generate the same amount.
_
Space-based solar power essentially consists of three elements:
-1. collecting solar energy in space with reflectors or inflatable mirrors onto solar cells or heaters for thermal systems
-2. wireless power transmission to Earth via microwave or laser
-3. receiving power on Earth via a rectenna, a microwave antenna
The space-based portion will not need to support itself against gravity (other than relatively weak tidal stresses). It needs no protection from terrestrial wind or weather, but will have to cope with space hazards such as micrometeors and solar flares. Two basic methods of conversion have been studied: photovoltaic (PV) and solar dynamic (SD). Most analyses of SBSP have focused on photovoltaic conversion using solar cells that directly convert sunlight into electricity. Solar dynamic uses mirrors to concentrate light on a boiler. The use of solar dynamic could reduce mass per watt. Wireless power transmission was proposed early on as a means to transfer energy from collection to the Earth’s surface, using either microwave or laser radiation at a variety of frequencies as seen in the figure below:
Figure above shows comparison of laser and microwave power transmission.
_
Microwave power transmission:
William C. Brown demonstrated in 1964, during Walter Cronkite’s CBS News program, a microwave-powered model helicopter that received all the power it needed for flight from a microwave beam. Between 1969 and 1975, Bill Brown was technical director of a JPL Raytheon program that beamed 30 kW of power over a distance of 1 mile (1.6 km) at 9.6% efficiency. Microwave power transmission of tens of kilowatts has been well proven by existing tests at Goldstone in California and Grand Bassin on Reunion Island (1997).
More recently, microwave power transmission on has been demonstrated, in conjunction with solar energy capture, between a mountaintop in Maui and the island of Hawaii (92 miles away), by a team under John C. Mankins. Technological challenges in terms of array layout, single radiation element design, and overall efficiency, as well as the associated theoretical limits are presently a subject of research, as it was demonstrated by the Special Session on “Analysis of Electromagnetic Wireless Systems for Solar Power Transmission” held during the 2010 IEEE Symposium on Antennas and Propagation. In 2013, a useful overview was published, covering technologies and issues associated with microwave power transmission from space to ground. It includes an introduction to solar power satellites (SPS), current research and future prospects. Moreover, a review of current methodologies and technologies for the design of antenna arrays for microwave power transmission appeared in the Proceedings of the IEEE. Space-based solar is unique because it can be transported over thousands of kilometres on Earth just by moving the beam.
_
Laser power beaming:
Laser power beaming was envisioned by some at NASA as a stepping stone to further industrialization of space. In the 1980s, researchers at NASA worked on the potential use of lasers for space-to-space power beaming, focusing primarily on the development of a solar-powered laser. In 1989, it was suggested that power could also be usefully beamed by laser from Earth to space. In 1991, the SELENE project (SpacE Laser ENErgy) had begun, which included the study of laser power beaming for supplying power to a lunar base. The SELENE program was a two-year research effort, but the cost of taking the concept to operational status was too high, and the official project ended in 1993 before reaching a space-based demonstration.
Laser Solar Satellites:
Laser Solar Satellites are smaller in size, meaning that they have to work as a group with other similar satellites. There are many pros to Laser Solar Satellites, specifically regarding their lower overall costs in comparison to other satellites. While the cost is lower than other satellites, there are various safety concerns, and other concerns regarding this satellite. Laser-emitting solar satellites only need to venture about 400 km into space, but because of their small generation capacity, hundreds or thousands of laser satellites would need to be launched in order to create a sustainable impact. A single satellite launch can range from fifty to four hundred million dollars. Lasers could be helpful for the energy from the sun harvested in space, to be returned back to Earth in order for terrestrial power demands to be met.
_
Orbital location:
The main advantage of locating a space power station in geostationary orbit is that the antenna geometry stays constant, and so keeping the antennas lined up is simpler. Another advantage is that nearly continuous power transmission is immediately available as soon as the first space power station is placed in orbit, LEO (low earth orbit) requires several satellites before they are producing nearly continuous power.
Power beaming from geostationary orbit by microwaves carries the difficulty that the required ‘optical aperture’ sizes are very large. For example, the 1978 NASA SPS study required a 1 km diameter transmitting antenna and a 10 km diameter receiving rectenna for a microwave beam at 2.45 GHz. These sizes can be somewhat decreased by using shorter wavelengths, although they have increased atmospheric absorption and even potential beam blockage by rain or water droplets. Because of the thinned array curse, it is not possible to make a narrower beam by combining the beams of several smaller satellites. The large size of the transmitting and receiving antennas means that the minimum practical power level for an SPS will necessarily be high; small SPS systems will be possible, but uneconomic. A collection of LEO (low earth orbit) space power stations has been proposed as a precursor to GEO (geostationary orbit) space-based solar power.
_
Earth-based receiver:
The Earth-based rectenna would likely consist of many short dipole antennas connected via diodes. Microwave broadcasts from the satellite would be received in the dipoles with about 85% efficiency. With a conventional microwave antenna, the reception efficiency is better, but its cost and complexity are also considerably greater. Rectennas would likely be several kilometers across.
______
______
Is beaming power from space to earth a hype?
Given all the terrestrial alternatives for boosting clean power production, is it really worth pouring billions of dollars into huge solar arrays in space? The world wants electricity that is affordable, available, reliable, scalable and clean. And we want all of that at the same time. No single technology can achieve that for us. This clean energy from space would come at an enormous cost, if it can be done at all, and the same capital could be better spent improving less risky ways to shore up renewable energy, such as batteries, hydrogen, and grid improvements.
_
For example, U.K.-based Space Solar estimates it will need 68 SpaceX Starship launches to loft all the assets necessary to build one 1.7-km-long solar array in orbit. Never mind that SpaceX hasn’t yet successfully launched a Starship into orbit and brought it back in one piece. Even if the company can eventually get the price down to $10 million per launch, we’re still talking hundreds of millions of dollars in launch costs alone. We also don’t have real-life experience to build such a station. And the ground stations and rectennas necessary for receiving the beamed power and putting it on the grid are still just distant dots on a road map in someone’s multimillion dollar research proposal. Engineers are often inspired by science fiction. But inspiration only gets you so far. Space-based solar power will remain sci-fi fodder for the foreseeable future. For the monumental task of electrifying everything while reducing greenhouse gas emissions, it’s better to focus on solutions based on technology already in hand, like conventional geothermal, hydro, nuclear, wind, and Earth-based solar, rather than wasting time, brainpower, and money on a fantasy.
_
The U.S. and European space agencies have recently released detailed technical analyses of several space-based solar-power proposals. These reports make for sobering reading. Electricity made this way, NASA reckoned in its 2024 report, would initially cost 12 to 80 times as much as power generated on the ground, and the first power station would require at least $275 billion in capital investment. Ten of the 13 crucial subsystems required to build such a satellite—including gigawatt-scale microwave beam transmission and robotic construction of kilometers-long, high-stiffness structures in space—rank as “high” or “very high” technical difficulty, according to a 2022 report to ESA by Frazer-Nash, a U.K. consultancy. Plus, there is no known way to safely dispose of such enormous structures, which would share an increasingly crowded GEO with crucial defense, navigation, and communications satellites, notes a 2023 ESA study by the French-Italian satellite maker Thales Alenia Space.
_
An alternative to microwave transmission would be to beam the energy down to Earth as reflected sunlight. Engineers at Arthur D. Little described the concept in a 2023 ESA study in which they proposed encircling the Earth with about 4,000 aimable mirrors in LEO. As each satellite zips overhead, it would shine an 8-km-wide spotlight onto participating solar farms, allowing the farms to operate a few extra hours each day (if skies are clear). In addition to the problems of clouds and light pollution, the report noted the thorny issue of orbital debris, estimating that each reflector would be penetrated about 75 billion times during its 10-year operating life.
_
The high costs and hard engineering problems that prevent us from building orbital solar-power systems today arise mainly from the enormity of these satellites and their distance from Earth, both of which are unavoidable consequences of the physics of this kind of energy transmission. Only in GEO can a satellite stay (almost) continuously connected to a single receiving station on the ground. The systems must beam down their energy at a frequency that passes relatively unimpeded through all kinds of weather and doesn’t interfere with critical radio systems on Earth. Most designs call for 2.45 or 5.8 gigahertz, within the range used for Wi-Fi. Diffraction will cause the beam to spread as it travels, by an amount that depends on the frequency.
Thales Alenia Space estimated that a transmitter in GEO must be at least 750 meters in diameter to train the bright center of a 5.8-GHz microwave beam onto a ground station of reasonable area over that tremendous distance—65 times the altitude of LEO satellites like Starlink. Even using a 750-meter transmitter, a receiver station in France or the northern United States would fill an elliptical field covering more than 34 square kilometers.
_
Success hinges on something that cannot be engineered: sustained political will to keep investing in a multidecade R&D program that ultimately could yield machines that can’t put electricity on the grid. Huge components come with huge masses, which lead to exorbitant launch costs. Thales Alenia Space estimated that the transmitter alone would weigh at least 250 tonnes and cost well over a billion dollars to build, launch, and ferry to GEO. That estimate, based on ideas from the Caltech group that have yet to be tested in space, seems wildly optimistic; previous detailed transmitter designs are about 30 times heavier. Because the transmitter has to be big and expensive, any orbiting solar project will maximize the power it sends through the beam, within acceptable safety limits. That’s why the systems evaluated by NASA, ESA, China, and Japan are all scaled to deliver 1–2 GW, the maximum output that utilities and grid operators now say they are willing to handle. It would take two or three of these giant satellites to replace one large retiring coal or nuclear power station.
_
Energy is lost at each step in the conversion from sunlight to DC electricity, then to microwaves, then back to DC electricity and finally to a grid-compatible AC current. It will be hard to improve much on the 11 percent end-to-end efficiency seen in recent field trials at 2.45 GHz. So the solar arrays and electrical gear must be big enough to collect, convert, and distribute around 9 GW of power in space just to deliver 1 GW to the grid. No electronic switches, relays, and transformers have been designed or demonstrated for spacecraft that can handle voltages and currents anywhere near the required magnitude.
Some space solar designs, such as SPS-ALPHA and CASSIOPeiA, would suspend huge reflectors on kilometers-long booms to concentrate sunlight onto high-efficiency solar cells on the back side of the transmitter or intermingled with antennas. Other concepts, such as China’s MR-SPS and the design proposed by Thales Alenia Space, would send the currents through heavy, motorized rotating joints that allow the large solar arrays to face the sun while the transmitter pivots to stay fixed on the receiving station on Earth.
All space solar-power concepts that send energy to Earth via a microwave beam would need a large receiving station on the ground. An elliptical rectenna field 6 to 10 kilometers wide would be covered with antennas and electronics that rectify the microwaves into DC power. Additional inverters would then convert the electricity to grid-compatible AC current.
The net result, regardless of approach, is an orbiting power station that spans several kilometers, totals many thousands of tonnes, sends gigawatts of continuous power through onboard electronics, and comprises up to a million modules that must be assembled in space—by robots. That is a gigantic leap from the largest satellite and solar array ever constructed in orbit: the 420-tonne, 109-meter International Space Station (ISS), whose 164 solar panels produce less than 100 kilowatts to power its 43 modules.
The ISS has been built and maintained by astronauts, drawing on 30 years of prior experience with the Salyut, Skylab, and Mir space stations. But there is no comparable incremental path to a robot-assembled power satellite in GEO. Successfully beaming down a few megawatts from LEO would be an impressive achievement, but it wouldn’t prove that a full-scale system is feasible, nor would the intermittent power be particularly interesting to commercial utilities.
_______
_______
Section-15
Solar vehicle, lamp, charger, generator and train:
_
Solar vehicle:
A solar vehicle or solar electric vehicle is an electric vehicle powered completely or significantly by direct solar energy. Usually, photovoltaic (PV) cells contained in solar panels convert the sun’s energy directly into electric energy. The term “solar vehicle” usually implies that solar energy is used to power all or part of a vehicle’s propulsion. Solar power may also be used to provide power for communications or controls or other auxiliary functions.
_
Solar car:
A solar car is a solar vehicle for use on public roads or race tracks. Solar vehicles are electric vehicles that use self-contained solar cells to provide full or partial power to the vehicle via sunlight. Solar vehicles typically contain a rechargeable battery to help regulate and store the energy from the solar cells and from regenerative braking. Some solar cars can be plugged into external power sources to supplement the power of sunlight used to charge their battery. The design of solar vehicles always emphasizes energy efficiency to make maximum use of the limited amount of energy they can receive from sunlight. Most solar cars have been built for the purpose of solar car races. The operating system and propulsion mechanism of solar cars is very similar to those of electric cars.
_
Car sizes vary a lot, but a full-size car in the U.S. is about 18 feet long and 6 feet wide, so it has about 100 to 110 square feet (9 to 10 square meters) of horizontal surface. That would collect roughly 9000 W sunlight and with 20% PV efficiency, it comes to 1800 watts or 2.4 horsepower, given current PV efficiencies; while average horsepower for a car is anywhere from 100hp to 200hp. It, therefore, seems difficult to envision a solar powered vehicle in near future. The lack of sufficient surface area on standard electric vehicles is the primary reason why most EVs do not have solar panels. Current solar panel technology, with average efficiency rates around 20%, is not yet capable of generating enough power to meaningfully contribute to an EV’s charging needs. Photovoltaic modules are used commercially as auxiliary power units on passenger cars to ventilate the car, reducing the temperature of the passenger compartment while it is parked in the sun. Vehicles such as the 2010 Prius, Aptera 2, Audi A8, and Mazda 929 have had solar sunroof options for ventilation purposes.
Vehicles that compete in the World Solar Challenge tend to be large and have designs that maximize their horizontal surface area. This helps them collect as much sunlight as possible. As a concept vehicle, that’s fine, but most models don’t have many windows, or space for anything except a driver.
In June 2019 the solar-electric Lightyear One was announced, since renamed the Lightyear 0. Designed by former engineers from Tesla and Ferrari, the car’s hood and roof are composed of solar panels. The vehicle also charges on regular electric power as well as fast-charging stations. In September 2021, the company Lightyear was reported to have raised enough money to bring the vehicle to limited production, at a cost of €149,000, delivering the first units in 2022.
_
Solar buses:
Solar buses are propelled by solar energy, all or part of which is collected from stationary solar panel installations. The Tindo bus is a 100% solar bus that operates as free public transport service in Adelaide City as an initiative of the City Council. Bus services which use electric buses that are partially powered by solar panels installed on the bus roof, intended to reduce energy consumption and to prolong the life cycle of the rechargeable battery of the electric bus, have been put in place in China. Solar buses are to be distinguished from conventional buses in which electric functions of the bus such as lighting, heating or air-conditioning, but not the propulsion itself, are fed by solar energy.
_
Solar Ships:
Solar boats are the 20th century’s main innovation in water transport and the beginning of a new era in the new millennium. Already they have grown from a novelty to an industry. Recent years have seen the rapid development of larger solar craft. These scale up favourably, as the main source of resistance through the water, wetted surface friction, increases slightly less rapidly than the increased area available for solar cells, and resistance due to wave-making becomes less and less important.
_
Solar powered boats have mainly been limited to rivers and canals, but in 2007 an experimental 14 m catamaran, the Sun21 sailed the Atlantic from Seville to Miami, and from there to New York. It was the first crossing of the Atlantic powered only by solar. Japan’s biggest shipping line Nippon Yusen KK and Nippon Oil Corporation said solar panels capable of generating 40 kilowatts of electricity would be placed on top of a 60,213 ton car carrier ship to be used by Toyota Motor Corporation. In 2010, the Tûranor PlanetSolar, a 30-metre long, 15.2-metre wide catamaran yacht powered by 470 square metres of solar panels, was unveiled. It is, so far, the largest solar-powered boat ever built. In 2012, PlanetSolar became the first ever solar electric vehicle to circumnavigate the globe. Various demonstration systems have been made. Curiously, none yet takes advantage of the huge power gain that water cooling would bring.
The low power density of current solar panels limits the use of solar propelled vessels; however boats that use sails (which do not generate electricity unlike combustion engines) rely on battery power for electrical appliances (such as refrigeration, lighting and communications). Here solar panels have become popular for recharging batteries as they do not create noise, require fuel and often can be seamlessly added to existing deck space. Solar-powered boats are being used in remote areas of the Ecuadorean Amazon to transport indigenous Achuar people.
_
When these existing and projected examples of solar ships are compared to conventional diesel-powered ones, top speeds are usually lower, but average speeds on most inland waters are very similar because of speed restrictions on small lakes, rivers and canals. Surprisingly the costs of the solar craft seem to be similar or even lower. The big difference is of course that conventional craft cause considerable pollution and wavemaking, produce CO2 and use up oil, as do even electric craft indirectly powered by fossil-fueled power stations, whereas solar craft use few resources once they are built and can actually produce more power than they consume, if operated in a mains connection setup when not under way. Because sunlight is rather more predictable than wind in many areas, varies less, and can be stored by electrochemical means (batteries and hydrogen), solar ships may well eventually become the main means of transportation in some areas. Whether really large ships could be solarised remains to be seen. Cargo ships are generally built as cheaply as possible and presently lack the unobstructed deck area required for solar panels. Large passenger ships also tend to operate at speeds wasteful of power. Certainly there would be no problem operating ships with liquified hydrogen produced by vast solar plants in arid regions. Already several smaller boats exist which use hydrogen fuel cells.
_
Solar aircraft:
Solar-powered aircraft are electric aircraft that can be an airplane, blimp, or airship and use either a battery or hydrogen to store the energy produced by the solar cells and use that energy at night when the sun isn’t shining. Solar-powered aircraft do not require fuel, so they don’t require oxygen, and they are able to operate at altitudes over 20 kilometres (12 mi) to 100 kilometres (62 mi) for months at a time.
There is considerable military interest in unmanned aerial vehicles (UAVs); solar power would enable these to stay aloft for months, becoming a much cheaper means of doing some tasks done today by satellites. Under fair experimental conditions with desirable weather conditions, the solar power system on the aircraft results in 22.5% savings in the use of battery-stored capacity. The decrease rate of battery voltage during the stable level flight of the solar-powered UAV built is also much slower than the same configuration without a solar-power system. In September 2007, the first successful flight for 48h under constant power of a UAV was reported. This is likely to be the first commercial use for photovoltaics in flight. Many demonstrations solar aircraft have been built, some of the best known by AeroVironment.
There have been planes that use solar power, the Solar Impulse is one: You can see some of the issues: it needs huge wings to have enough surface area to collect enough power; everything else is tiny to reduce weight. With tiny engines and a huge wing it is very slow, and can only carry one person. Solar impulse is first aircraft that completed a 26-hour test flight in Switzerland on 8–9 July 2010. The aircraft was flown to a height of nearly 8,500 m (27,900 ft) by André Borschberg. It flew overnight using battery power.
______
______
Solar lamp:
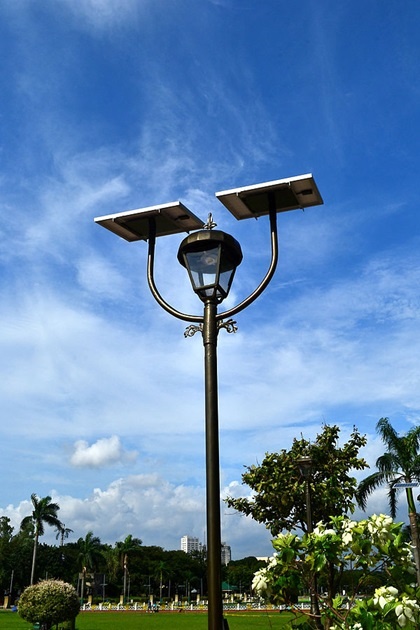
Figure above shows solar lamp in Rizal Park, Philippines
A solar lamp, also known as a solar light or solar lantern, is a lighting system composed of an LED lamp, solar panels, battery, charge controller and there may also be an inverter. The lamp operates on electricity from batteries, charged through the use of a solar photovoltaic panel. Solar-powered household lighting can replace other light sources like candles or kerosene lamps. Solar lamps have a lower operating cost than kerosene lamps because renewable energy from the sun is free, unlike fuel. In addition, solar lamps produce no indoor air pollution unlike kerosene lamps. However, solar lamps generally have a higher initial cost, and are weather dependent. Solar lamps for use in rural situations often have the capability of providing a supply of electricity for other devices, such as for charging cell phones. The costs of solar lamps have continued to fall in recent years as the components and lamps have been mass-produced in ever greater numbers. Solar lamps can also be used in areas where there is no electrical grid or remote areas that lack a reliable electricity supply. The use of solar lights improves education for students who live in households without electricity. When the nonprofit Unite to Light donated solar-lamps to schools in a remote region of Kwa Zulu Natal in South Africa, test scores and pass rates improved by over 30%. The light gives students added time to study after dark. A 2017 experimental study in un-electrified areas of northern Bangladesh found that the use of solar lanterns decreased total household expenditure, increased children’s home-study hours and increased school attendance. It did not however improve the children’s educational achievement to any large extent.
______
______
Solar charger:

Although sun rays are free and there’s zero environmental impact, the kit required to catch the sun’s rays is far from free, and it’s not always mega effective, at least not in a format that makes it a viable option for taking out on the trails on human-powered adventures. Truth is, the best solar chargers on the market at the moment are fine for recharging less demanding devices – but you have to be realistic about how fast your phone and various other outdoor gadgets can be restored to full capacity by a modest-sized solar panel. Especially if your escapade is taking place somewhere not known for reliable sunny weather. That is not to say that you shouldn’t invest in a portable solar charger unit at all, however. Just be aware of the technology’s limitations and don’t stake everything on keeping things powered up in this way.
_
The larger the power output (measured in watts) the better a solar charger will do its job. So, a portable solar power unit that has a power output rated at 100W will charge your devices much quicker than one rated at 60W, which in turn will perform better than one that is rated at 20W. The more panel space you have, the more power you will get, so big units designed for vehicular adventures might offer 60W or 100W, while most lightweight chargers designed for backpackers will be 20W or less. (You can also link up solar panels to increase the power output.) However, it’s important to realise that these figures represent the maximum power output possible from that unit, the actual output will be dependent on environmental conditions at the time (for example, how sunny it is). You also need a minimum output current (measured in amps) to charge some devices, and you really want to avoid fluctuations in current, as this can cause problems with the equipment you’re charging. To manage this, good charging units come with charge controllers to ensure consistency of current output, and also sometimes come with a battery, which can be charged up and then used to top up other devices. Sometimes this battery in integrated into the unit.
The best advice is to buy your charger with enough time to test it out at home before you take it out on the trails or on the road, so you know exactly what its capabilities are. Also, test it out in various conditions, not just on bluebird sun-splattered days, to avoid getting false confidence. Also, you need to catch power when the sun shines – if your devices are all juiced up, but there’s not a cloud in the sky, you don’t want that sun shine to go to waste, so it’s always a good idea to carry a portable power station as well as a solar panel unit if possible, so you can catch and store power for a rainy day.
_____
_____
Solar generators:
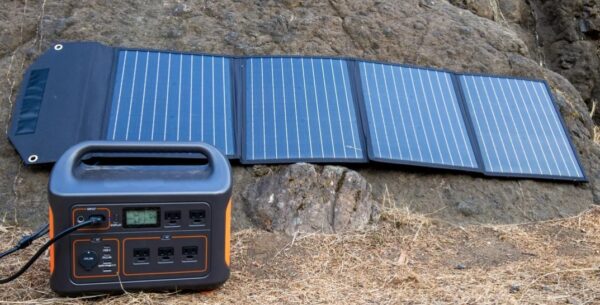
Figure above shows portable power station and portable solar panels sitting on the ground outside.
If you’ve never heard of a portable power station, it’s essentially a big battery that you can bring with you and use to power your electronics. These portable batteries are considered “solar generators” when they’re paired with portable solar panels, which can in turn top off the power station to keep your power supply running. This has tons of uses when you’re camping. You can plug in your phone to keep it charged, or if you find yourself working remotely from the woods, power up your laptop. Or you could hook up some LED lights to brighten up camp or an oscillating fan to keep the bugs away. There’s a pretty big battery range out there. Solar generators can offer as little as 300 watt-hours and up to 1,500 watt-hours or more. A 300Wh, for example, can handle about 25 cellphone charges, run a fan for a few hours or run LED lights for a few days.
A bigger panel will juice up the generator faster, but will be bulkier. In perfect conditions at peak sun, a 100-watt panel would take about three hours to fully charge a 300Wh generator.
Smaller models can weigh as little as 10 pounds, while larger ones can weigh 40 pounds or more. Think about whether you can (or want to) carry that weight around on your campouts.
______
______
Railways and solar panels:
Indian Railways has been continuously installing solar panels on rooftops of its various stations and service buildings for meeting its non-traction power requirements. More than 1000 stations have been covered with solar panels on rooftop and more are in pipeline.
_
Solar train:
Railways present a low rolling resistance option that would be beneficial for planned journeys and stops. The Kismaros – Királyrét narrow-gauge line near Budapest has built a solar powered railcar called ‘Vili’ in 2013. With a maximum speed of 25 km/h, ‘Vili’ is driven by two 7 kW motors capable of regenerative braking and powered by 9.9m2 of PV panels. Electricity is stored in on-board batteries. In addition to on-board solar panels, there is the possibility to use stationary (off-board) panels to generate electricity specifically for use in transport. On 16 December 2017 a fully solar-powered train was launched in New South Wales, Australia. The train is powered using onboard solar panels and onboard rechargeable batteries. It holds a capacity for 100 seated passengers for a 3 km journey. Some trains have solar panels which provide electricity for lighting etc, but they do not have enough power to run the train. That has to come from the overhead wires.
_
Solar panel on railway tracks generate electricity:
Solar panels could be installed in the spaces between railway tracks. A train created by Swiss track upkeep company Scheuchzer performs PV installation mechanically. The train spreads the photovoltaic panels out along the rail track “like an unrolling carpet” as it travels. Solar panel installation along railroad tracks is not a novel concept. The Swiss rail network has a total length of 5,317 kilometers, and theoretically, all of it could be covered with solar panels. This would cover an area roughly equal to 760 football fields, omitting tunnels and locations with limited sunlight. The country’s rail system could generate 1 Terawatt-hour (TWh) of solar energy annually, or around 2 percent of Switzerland’s total electricity needs. There are over a million kilometers of railway lines in the world. By installing PV panels into rail beds, it is estimated that 100 kW of electricity could be generated per kilometer of rail line.
_____
_____
Section-16
Solar Energy and Electric Grid:
_
The Electrical Grid:
For most of the past 100 years, electrical grids involved large-scale, centralized energy generation located far from consumers. Modern electrical grids are much more complex. In addition to large utility-scale plants, modern grids also involve variable energy sources like solar and wind, energy storage systems, power electronic devices like inverters, and small-scale energy generation systems like rooftop installations and microgrids. These smaller-scale and dispersed energy sources are generally known as distributed energy resources (DER).
_
The electrical grid is separated into transmission and distribution systems. The transmission grid is the network of high-voltage power lines that carry electricity from centralized generation sources like large power plants. These high voltages allow power to be transported long distances without excessive loss. The distribution grid refers to low-voltage lines that eventually reach homes and businesses. Substations and transformers convert power between high and low voltage. Traditionally, electricity only needed to flow one way through these systems: from the central generation source to the consumer. However, systems like rooftop solar now require the grid to handle two-way electricity flow, as these systems can inject the excess power that they generate back into the grid.
_
Power Electronics:
Increased solar and DER on the electrical grid means integrating more power electronic devices, which convert energy from one form to another. This could include converting between high and low voltage, regulating the amount of power flow, or converting between direct current (DC) and alternating current (AC) electricity, depending on where the electricity is going and how it will be used. By 2030, as much as 80% of electricity could flow through power electronic devices. One type of power electronic device that is particularly important for solar energy integration is the inverter. Inverters convert DC electricity, which is what a solar panel generates, to AC electricity, which the electrical grid uses.
_
Grid Resilience and Reliability:
The electrical grid must be able to reliably provide power, so it’s important for utilities and other power system operators to have real-time information about how much electricity solar systems are producing. Increasing amounts of solar and DER on the grid lead to both opportunities and challenges for grid reliability. Complex modern grids with a mix of traditional generation and DER can make responding to abnormal situations like storms or blackouts more difficult. However, power electronics have the potential to collect real-time information on the grid and help to control grid operations. In fact, special “grid-forming” inverters could use solar energy to restart the grid in the event of a blackout.
_
Duck curve:
Utilities and power operators have to deal with the “Duck Curve” phenomenon, where a rapid increase in solar generation during midday leads to a steep drop in demand for traditional baseload power. As the sun sets and solar generation decreases, there is a sharp increase in demand for other power sources to fill the gap, which can strain the grid and increase the risk of outages. Duck Curve represents the potential for power system instability, as the grid attempts to cope with extreme changes in demand across different parts of the day. As more solar energy is exported to the grid, usually across the middle part of the day when the sun is shining, the curves deepen. With the increasing levels of rooftop photovoltaic systems, the energy flow becomes 2-way. When there is more local generation than consumption, electricity is exported to the grid. However, an electricity network traditionally is not designed to deal with the 2- way energy transfer. Therefore, some technical issues may occur. For example, in Queensland Australia, more than 30% of households used rooftop PV by the end of 2017. An over-voltage issue may result as the electricity flows from PV households back to the network. There are solutions to manage the over voltage issue, such as regulating PV inverter power factor, new voltage and energy control equipment at the electricity distributor level, re-conducting the electricity wires, demand side management, etc. There are often limitations and costs related to these solutions.
______
Grid integration:
The overwhelming majority of electricity produced worldwide is used immediately because traditional generators can adapt to demand and storage is usually more expensive. Both solar power and wind power are sources of variable renewable power, meaning that all available output must be used locally, carried on transmission lines to be used elsewhere, or stored (e.g., in a battery). Since solar energy is not available at night, storing it so as to have continuous electricity availability is potentially an important issue, particularly in off-grid applications and for future 100% renewable energy scenarios. Solar is intermittent due to the day/night cycles and variable weather conditions. However solar power can be forecast somewhat by time of day, location, and seasons. The challenge of integrating solar power in any given electric utility varies significantly. In places with hot summers and mild winters, solar tends to be well matched to daytime cooling demands.
_
The energy sector is undergoing significant change, driven in particular by the need for a cleaner energy supply to help mitigate climate change. For example, many countries have put in place ambitious targets to increase their share of renewable energy. Traditionally, the backbone of power systems has consisted of baseload providers: power plants able to provide a constant and predictable supply of electricity. However, power systems relying on a combination of baseload (i.e., coal or nuclear) and variable (i.e., wind or solar photovoltaics/PV) generation are considered difficult to operate. For the grid integration of variable renewables, flexible load-following rather than baseload capabilities are required. Mai et al. (2014) show for the U.S. case that integrating up to about 50% or even up to 80% of variable wind and solar PV generation is possible with a combination of measures such as more flexible generation capacity, grid-scale storage, more transmission, more flexible loads, and changed systems operations. In power systems with ever increasing shares of renewable generation, baseload power may no longer even be a relevant concept. Budischak et al. (2013) demonstrate feasible systems relying entirely on wind and solar power for up to 99% of the time (but these results rely on the availability of affordable large-scale storage). Nevertheless, and despite the fact that wind and PV generation costs are falling, traditional baseload generation can be expected to remain relevant for some decades while the transition of power systems worldwide is underway. In particular in emerging economies, where substantial demand increases are taking place and large parts of a generation fleet relying on substantial baseload capacities still have decades of operational life ahead of them, investment decisions taken between now and 2030 will still take baseload generation into account.
_
The availability of low-emissions baseload generators is therefore still an immediate concern. Two main options are usually considered: CCS (carbon capture and storage) and nuclear power. As yet, however, CCS remains unproven at a commercial scale, and the future availability and costs of CCS-enabled power plants thus remain uncertain. In contrast, nuclear power is a mature technology with decades of experience, and in 2020, delivered about 10% of total global electricity supply. It is advocated by many as a low-emission power generation technology with sufficient fuel availability for large-scale deployment, and thus potentially crucial to achieve deep reductions in greenhouse gas emissions. However, nuclear is also a technology with uniquely low public acceptance, especially in the wake of the Fukushima disaster. There is uncertainty about its future status: some countries (e.g. the UK) are moving forward with new nuclear plans despite some public opposition, while others (e.g. Germany) have announced their intention to phase out nuclear power entirely. In addition to the CCS and nuclear options, one additional technology has recently seen a surge of interest: CSP (concentrating solar power). There are currently 83 plants operating and 26 planned or under construction worldwide. Previous work has shown that in principle, a fleet of CSP plants is able to provide baseload electricity, and could do so at economically viable costs under some circumstance. This leads to the question whether CSP could therefore compete against nuclear as a supplier of clean baseload power.
______
Toward an Inverter-Based Grid:
Historically, electrical power has been predominantly generated by burning a fuel and creating steam, which then spins a turbine generator, which creates electricity. The motion of these generators produces AC power as the device rotates, which also sets the frequency, or the number of times the sine wave repeats. Power frequency is an important indicator for monitoring the health of the electrical grid. For instance, if there is too much load—too many devices consuming energy—then energy is removed from the grid faster than it can be supplied. As a result, the turbines will slow down and the AC frequency will decrease. Because the turbines are massive spinning objects, they resist changes in the frequency just as all objects resist changes in their motion, a property known as inertia.
As more solar systems are added to the grid, more inverters are being connected to the grid than ever before. Inverter-based generation can produce energy at any frequency and does not have the same inertial properties as steam-based generation, because there is no turbine involved. As a result, transitioning to an electrical grid with more inverters requires building smarter inverters that can respond to changes in frequency and other disruptions that occur during grid operations, and help stabilize the grid against those disruptions.
_____
Smart grid:
Current power grids are often outdated and not designed to accommodate the decentralized input of renewable energy sources. The grid must adapt to handle not just the one-way flow of energy from power plants to consumers but also the reverse flow from distributed energy producers like residential solar panels. To effectively manage this two-way flow, smart grid technology becomes essential. This involves advanced metering infrastructure, upgraded communication networks, and new management systems to balance supply and demand in real-time. Implementing these technologies requires significant investment and coordination among utility companies, regulators, and energy producers.
A smart grid is an electricity network that uses digital and other advanced technologies to monitor and manage the transport of electricity from all generation sources to meet the varying electricity demands of end users. Solar energy plays a crucial role in the development and operation of smart grids. As a renewable and widely available energy source, solar power is a significant component of the transition towards a more sustainable and efficient power system.
In the context of a smart grid, solar energy systems—mainly solar PV panels—are often distributed throughout the grid. Homes, businesses, and other facilities can each generate their own solar power. These are called distributed energy resources (DERs). DERs feed power into the smart grid, reducing the need for energy from traditional power plants.
Integrating solar energy into the smart grid comes with various benefits. For starters, it reduces the overall carbon footprint of the power grid as solar power replaces some portion of fossil fuel-based power. Additionally, since solar energy is generated locally and fed into the grid, it reduces energy losses that occur during transmission and distribution from distant power plants.
On sunny days, solar power systems can generate more electricity than a home or business needs. This excess power is fed back into the smart grid, supplying other consumers with green energy and often providing a credit to the solar producer through a process known as net metering.
Smart grids also enable more effective management of solar power. Traditional power grids are ill-equipped to handle the variability and unpredictability of solar power, but smart grids, with their advanced sensors and predictive capabilities, can better anticipate, manage, and distribute solar energy. The two-way communication that smart grids offer also allows for a more dynamic interaction between consumers and utilities, paving the way for innovative energy services and business models.
One significant challenge in integrating solar energy into smart grids is the intermittent nature of solar power. Solar energy depends on sunlight, and its production varies with weather conditions and time of day. This intermittency can create instability in the power grid, particularly if the share of solar power is significant. A solution to this challenge lies in energy storage technologies, such as advanced batteries. By storing surplus solar energy when production is high, these technologies can supply power when solar generation is low, smoothing out the intermittency and maintaining grid stability. Moreover, advanced forecasting techniques can help predict solar power production more accurately, aiding in better grid management.
______
______
Section-17
Energy Storage Solutions for Solar Energy:
Even the most ardent solar evangelists can agree on one limitation solar panels have: they only produce electricity when the sun is shining. But, peak energy use tends to come in the evenings, coinciding with decreased solar generation and causing a supply and demand issue. The thing is, solar panels often pump out more than enough energy during those lower demand hours when the sun is shining to meet peak demand later in the day. This means that efficient solar energy storage can open up a wealth of possibilities for homeowners and businesses alike.
_
Solar energy is not always produced at the time energy is needed most. Peak power usage often occurs on summer afternoons and evenings, when solar energy generation is falling. Temperatures can be hottest during these times, and people who work daytime hours get home and begin using electricity to cool their homes, cook, and run appliances. Storage helps solar contribute to the electricity supply even when the sun isn’t shining. It can also help smooth out variations in how solar energy flows on the grid. These variations are attributable to changes in the amount of sunlight that shines onto photovoltaic (PV) panels or concentrating solar-thermal power (CSP) systems. Solar energy production can be affected by season, time of day, clouds, dust, haze, or obstructions like shadows, rain, snow, and dirt. Sometimes energy storage is co-located with, or placed next to, a solar energy system, and sometimes the storage system stands alone, but in either configuration, it can help more effectively integrate solar into the energy landscape.
_
The integration of energy storage systems with solar energy plays a vital role in maximizing its utilization and overcoming the intermittent nature of solar power generation. Energy storage technologies enable the capture and storage of excess solar energy during periods of high generation and release it when sunlight is unavailable, thus ensuring a more consistent and reliable power supply. Studies have emphasized the importance of energy storage in enhancing the value and effectiveness of solar energy systems. Photovoltaic self-consumption occurs when individuals or companies consume the energy produced by photovoltaic generation installations located close to the place in which that energy is consumed. According to a report by the International Renewable Energy Agency (IRENA), energy storage can increase the self-consumption of solar energy by up to 50% and significantly reduce grid reliance and curtailment of solar power.
_
“Storage” refers to technologies that can capture electricity, store it as another form of energy (chemical, thermal, mechanical), and then release it for use when it is needed. Several methods can be used to store energy. Often, these technologies are grouped based on how long the energy will be retained. The two most popular ways to categorize energy storage systems are by the type of energy storage and the discharge duration. Based on the discharge time, energy storage techniques are classified as short-term (seconds or minutes), medium-term (minutes or hours), and long-term (hours to days). The type of transformed energy heavily influences the categorization of energy storage methods as indicated in figure below.
Classification of energy storage systems (ESS):
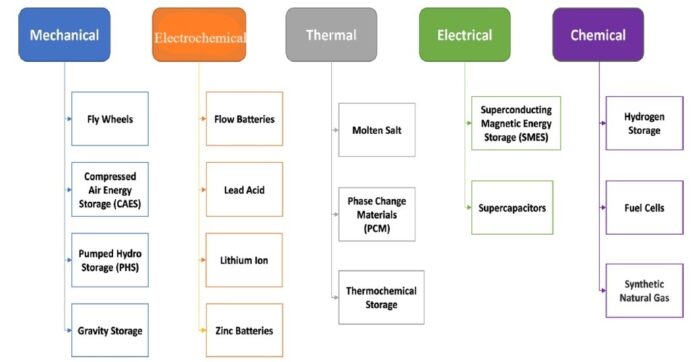
Mechanical, electrochemical, thermal, electrical and chemical energy storage are the five basic categories that ESS may be divided into. When needed, these technologies convert energy into a different form for storage before returning it to its original form.
_
The operating principle of Compressed-air energy storage CAES is quite straightforward. The storage is charged by converting electrical energy through electrically driven compressors into the potential energy of pressed air. The compressed air is released when needed to continue generating power by allowing air to expand through an air turbine. It now ranks second in bulk energy storage behind Pumped hydroelectric storage PHS. To provide continuous load reaction and peak generation, CAES is used as a source of flexible supply at utility sizes between 10 MW and 100 MW. For almost 40 years, CAES, with an estimated efficiency of 70% performed successfully.
_
The Pumped Hydroelectric Storage (PHS) uses an electric pump that runs on electricity during off-peak hours to transfer water from a lower tank to a higher tank, dam, or reservoir, storing this water at a high level in form of potential energy. The turnaround converts the potential energy into mechanical energy, which is then converted to electrical energy, when there is high demand. PHS has a 70–80% roundtrip efficiency. The expected lifespan of PHS is between 40 and 60 years. It is the most popular and reasonably priced choice for large-scale energy storage. This technology provides a large-scale and long-duration storage solution for solar energy. A study by Beevers et al. assessed the potential of pumped hydro storage to support high levels of solar energy penetration in the United States and Europe. The study showed that pumped hydro storage could provide up to 50 GW of flexible capacity, enabling a higher share of solar energy in the electricity mix. Chaudhary et al. investigated the potential of pumped hydro storage for integrating variable solar PV generation. The study showed that pumped hydro storage reduced the curtailment of solar PV energy by up to 50%, enabling higher levels of solar PV penetration into the grid. In another study, Gioutsos et al. evaluated the role of pumped hydro storage in achieving a high share of renewable energy in the electricity system. The study found that pumped hydro storage allowed for a solar energy penetration level of up to 70% and significantly improved system flexibility and stability.
_
A flywheel functions as a mechanical battery by storing kinetic energy in the manner of rotational mass. Rotor is often fitted in an evacuated cylinder, allowing it to use renewable or off-peak electricity to accelerate at very high speeds and store it as rotational energy. When storing energy, the device acts as a motor and a generator when discharging. Flywheels have a high energy efficiency of higher than 85%. Flywheels are ideal for switching between medium and high powers (kW-MW) within very short periods of time (seconds).
_
Gravity Storage is a technique that permits huge amounts of power to be stored for 6–14 h and then released. The fundamental concept relies on the hydraulic lifting of a large rock mass. Electrical pumps, used nowadays in hydro-power plants, are used to flow water beneath a moving rock piston, to lift up the rock mass. When the supply of renewable energy is insufficient, the water, which is under extreme pressure from the rock mass, is directed to a turbine, as in standard hydroelectric facilities, and employs a generator to create power. The range of energy storage options is 1 to 10 GWh, which is comparable to large Hydro-power dams.
_
Battery energy storage system (BESS) is a cutting-edge technology solution that allows energy to be stored in a variety of ways until it is needed. Rechargeable batteries are utilized in lithium ion battery storage systems in particular to store energy produced by solar panels or provided by the grid and then make it available when needed. The benefits of battery energy storage include increased renewable energy production, cost savings, and sustainability due to reduced consumption. The typical lifespan of energy battery storage devices is 5 – 15 years. Batteries are by far the most common way for residential installations to store solar energy. When solar energy is pumped into a battery, a chemical reaction among the battery components stores the energy. The reaction is reversed when the battery is discharged, allowing current to exit the battery. Lithium-ion batteries are most commonly used in solar applications, and new battery technology is expanding rapidly, which promises to yield cheaper, more scalable battery storage solutions. Utility-scale battery storage systems have a typical storage capacity ranging from around a few megawatt-hours (MWh) to hundreds of MWh. Different battery storage technologies, such as lithium-ion (Li-ion), sodium sulphur and lead acid batteries, can be used for grid applications. U.S. battery storage capacity is expected to nearly double in 2024 as developers report plans to add 14.3 GW of battery storage to the existing 15.5 GW this year. In 2023, 6.4 GW of new battery storage capacity was added to the U.S. grid, a 70% annual increase.
_
Battery-based storage systems, particularly lithium-ion batteries, have gained significant attention due to their high energy density, efficiency, and cost effectiveness. These systems store excess solar energy in the form of chemical energy and release it as electricity when needed. A study by Vieira et al. evaluated the performance of a lithium-ion battery energy storage system integrated with solar PV installations. The study found that the battery system improved self-consumption of solar energy from 30% to 60% and reduced the reliance on grid electricity. Roberts et al. analyzed the performance of a battery energy storage system (BESS) integrated with a solar PV system. The study found that the BESS increased the self-consumption of solar energy from 30% to over 70%, resulting in a significant reduction in grid electricity purchases. In another study, Qusay et al. evaluated the techno-economic performance of a lithium-ion battery energy storage system for solar self-consumption. The study showed that the battery system improved self-consumption rates by up to 42%, leading to substantial savings in electricity costs.
_
The same basic equations that govern capacitors are used in supercapacitors, which are energy storage devices. However, in order to accumulate large amounts of charge carriers and capacitances, supercapacitors commonly use porous carbon or electrodes with larger surface areas and thinner dielectrics. This type of system offers a number of advantages, including exceptionally high capacitance characteristics, on the scale of thousands of farads, extended cycle life, low internal resistance, rapid charging and discharging, remarkable reversibility, great low-temperature performance, no destructive material, cheaper cost per cycle, and high cycle efficiency (up to 95%). The electrodynamic concept underpins the Superconducting Magnetic Energy Storage (SMES) technology. When direct current flows through a superconducting coil that has been cryogenically cooled to an extremely low temperature, an energy-storing magnetic field is formed. In most cases, niobium-titanium is used to make the conductor, while fluid helium at 4.2 K or super liquid helium at 1.8 K is used as the coolant. The immediate availability of the required electricity is one of the key advantages of SMES. The framework’s high overall round-trip efficiency (between 85% and 90%) and the potent yield that may be produced in a short amount of time are further characteristics.
_
An electrolyzer, a hydrogen storage tank, and a fuel cell are typical components of a hydrogen storage system. An electrolyzer is a device that employs electricity to electrochemically transform water into hydrogen and oxygen. In order to create electricity, both gasses must enter a fuel cell. There, they go through an electrochemical process that is the opposite of water splitting: hydrogen and oxygen react to create water, while heat is generated to produce electricity. Hydrogen is produced by electrolyzing water using off-peak electricity for use in energy storage. hydrogen may also be stored in different viable options such as, liquefied gas, metal hydrides, compressed gas or carbon nanostructures.
_
There are three types of Thermal energy storage (TES) systems, only one of which is commercially available in the electricity sector. Sensible heat storage is significantly simpler and more affordable than the alternatives. Thermal-chemical storage systems and latent energy storage are expensive and still primarily experimental technologies. The most often used TES in the energy production sector is sensible heat storage. In a sensible heat TES system, energy is stored by heating or cooling a solid or liquid storage medium, such as molten salt, sand, water or rocks. Sensible heat storage is widely employed in CSP plants, where the use of TES enables a project to produce energy far after the sun sets. In most CSP plants utilizing TES, molten salts, which can withstand extremely high temperatures, are the chosen medium. Despite being used less often in the energy production sector, latent heat storage has shown promise in a number of recent technologies. A change in the storage medium’s condition, such as from solid to liquid, is necessary for latent heat storage. Phase change materials (PCMs) are a common name for latent heat storage media. Thermo-chemical storage (TCS), as the name implies, employs chemical processes to store energy. Compared to PCMs, TCS systems have an even higher energy density.
_
Each energy storage system has distinctive features and characteristics that, in certain cases, make them stand out from one another. It is feasible to choose the best appropriate energy storage technology for a specific situation using these traits and attributes. On the basis of the following technological features, Table below compares the main categories of energy storage systems.
Technical parameter comparison between the different energy storage systems:
|
Technology |
Power rating (MW) |
LCOE ($/kWh) |
Lifetime (Years) |
Cycle efficiency (%) |
|
PHS |
30 – 5000 |
5 – 100 |
40 – 60 |
70 – 87 |
|
CAES |
110 – 1000 |
2 – 120 |
20 – 40 |
42 – 54 |
|
TES |
0.1 – 300 |
3 – 60 |
20 – 30 |
30 – 60 |
|
Li-ion |
0 – 100 |
600 – 3800 |
14 – 16 |
75 – 97 |
|
Lead Acid |
0 – 40 |
50 – 400 |
5 – 15 |
63 – 90 |
|
Fly Wheels |
0.25 – 20 |
1000 – 14,000 |
15 – 20 |
90 – 95 |
|
Supercapacitors |
0 – 0.3 |
300 – 2000 |
10 – 30 |
84 – 97 |
|
SMES |
0.1 – 10 |
500 – 72,000 |
20 – 30 |
95 – 98 |
|
Fuel Cells |
< 58.5 |
2 – 15 |
~ 20 |
20 – 66 |
Although TES has one of the lowest cycle efficiencies when compared to other technologies, according to Table above, it has the a low LCOE among the other technologies with a very long lifetime.
_
Thermal energy storage (TES) systems for CSP:
Currently, two TES commercialized technologies are used in CSP projects around the world; molten salts storage tanks and steam accumulators. Steam accumulation tanks are typically cylindrical with elliptical ends made of boiler plates. One of the primary benefits is that the storage fluid is water, which eliminates price uncertainty in the storage medium. Because of their short reaction times and high discharge rates, steam accumulators are a proven choice for compensating transients and mid-term storage to match supply/demand curves when there is no radiation. Steam accumulation is one of the most successful methods of TES. However, the steam accumulator idea is restricted by a poor connection between volume and stored energy; also, its discharge process exhibits a drop in pressure, failing to achieve nominal conditions in the turbine. There are just two commercial tower plants in existence that use steam accumulator TES; PS10 (with four steam accumulator tanks) and PS20, both situated in Spain.
_
Molten salt storage is a commonly used thermal storage technology, particularly in concentrated solar power (CSP) plants. There are two types of molten salt storage tanks, direct and indirect; in the direct TES the salt serves as both the HTF and storage medium in the system. These salts are an effective storage medium because they are low-cost, have a high specific heat capacity, and can deliver heat at temperatures compatible with conventional power systems. This method of energy storage is used, for example, by the Solar Two power station, allowing it to store 1.44 TJ in its 68 m3 storage tank, enough to provide full output for close to 39 hours, with an efficiency of about 99%. A study by Boretti et al. evaluated the performance of a thermal energy storage system using molten salt in a CSP plant. The study demonstrated that thermal storage improved the plant’s capacity factor by 45%, allowing for continuous power generation even after sunset. Praveen et al. also analyzed the performance of thermal energy storage in CSP plants. The study showed that the inclusion of thermal storage increased the capacity factor of the CSP plant from 37% to 65%, leading to more continuous and reliable power generation. In another study, Liu et al. evaluated the techno-economic performance of a thermal storage system coupled with a solar thermal power plant. The study demonstrated that the integration of thermal storage increased the utilization of solar energy by 40%, resulting in improved system efficiency and economics.
_____
Emerging Storage Technologies:
Emerging storage technologies show promise in enabling long-duration and large-scale storage for solar energy. Flow batteries, such as vanadium redox flow batteries (VRFB), offer scalable and flexible storage solutions. Hydrogen storage through electrolysis and fuel cells also presents an avenue for long-duration energy storage. A study by Nguyen et al. investigated the techno-economic feasibility of VRFB systems for solar energy storage. The study demonstrated that VRFB systems could achieve a high round-trip efficiency of 80–90% and provide long-duration storage capabilities. Monforti et al. evaluated the performance of a hydrogen storage system for solar energy integration. The study demonstrated that the hydrogen storage system achieved a round-trip efficiency of 35–40% and provided long-duration storage of up to several weeks. Moreover, Elberry et al. analyzed the potential of hydrogen storage as a seasonal storage option for solar energy in Finland. Their study showed that hydrogen storage systems achieved high energy storage density and long-duration capabilities, enabling storage durations of several months.
______
______
Summary of Storage Costs and Efficiencies:
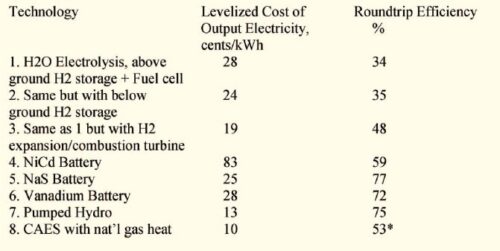
The cost and efficiency of several storage technologies, as developed by Steward et al., are presented in table above. The table is based on the assumption that stored energy is drawn down at a rate of 50 MW/h for six peak hours each weekday, and then charged during the rest of the time, i.e., used as short-term storage. As presented, CAES with natural gas (8) and pumped hydro (7) have significantly lower costs than the hydrogen systems (2 and 3). Cost estimates of CAES without heat injection have not yet been published.
When used on a daily basis pumped hydro appears to be a winner; historically nuclear plants have used it to even out their operation in preference to CAES. Pickard et al. conclude that, with the lower reservoir underground, this would become widely used in renewable energy systems. However, in the case of seasonal storage, this may not apply. The costs in Table above for pumped hydro are based on a reservoir that is filled and emptied daily whereas seasonal storage requires a reservoir that is cycled only once a year. Thus, it would be difficult to pay off the large cost associated with man-made reservoirs.
_____
_____
Solar Batteries:
A solar battery is a device that stores electric charge in chemical form, and you can use that energy at any time, even when your solar panels are not generating power. Although the battery backup systems that are coupled with solar panels are often referred to as solar batteries, they can store charge from any electricity source. This means you can recharge a battery with grid power when solar panels have low productivity, or you can use other renewable sources such as wind turbines. There are different types of battery chemistries, each with advantages and limitations. Some types of batteries are suitable for applications where you need a large amount of energy in a short time, while others work best when you need a steady output over a longer period. Some common chemistries used by solar batteries are lead-acid, lithium-ion, nickel-cadmium and redox flow.
_
When comparing solar batteries, you should consider both the rated power output (kilowatts or kW) and energy storage capacity (kilowatt hours or kWh). The rated power tells you the total electrical load you can connect to a battery, while the storage capacity tells you how much electricity a battery can hold. For example, if a solar battery has a rated power of 5 kW and a storage capacity of 10 kWh, you can assume:
- The battery can power up to 5,000 watts (or 5 kW) of the electrical load simultaneously.
- Since the battery stores 10 kWh, it can sustain a maximum load of 5 kW for two hours before depleting its charge (5 kW x 2 hours = 10 kWh).
- If the battery powers a smaller load of only 1,250 watts (or 1.25 kW), it can last for eight hours with a full charge (1.25 kW x 8 hours = 10 kWh).
It’s important to note that the rated power of solar panels and battery storage systems are not the same. For example, you could have a 10 kW home solar system with a battery that has a rated power of 5 kW and 12 kWh storage bank.
_
Home batteries can be classified based on how they interact with solar panels:
- Direct current or DC-coupled batteries use the same inverter as your solar panels, and both systems are connected to the DC side.
- Alternating current or AC-coupled batteries have a separate inverter, which connects directly to your home’s AC wiring.
You can only use DC-coupled batteries if you have a hybrid inverter, which is designed to manage solar panels and energy storage simultaneously. If your solar panels have a traditional inverter that cannot handle energy storage, you need an AC-coupled battery with a dedicated inverter.
If you intend to use your battery as a backup power source, check its specifications to make sure it can operate off-grid. Not all solar batteries are designed to be used during power outages, and many models can only operate when synchronized with the grid.
_
In terms of performance, lithium-ion batteries are considered the best option for home applications where you need daily charging and discharging.
- The latest lithium-ion batteries offer a lifespan of over 4,000 cycles, meaning they can last over 10 years with a daily charging cycle.
- The price of lithium-ion batteries varies depending on the brand and energy storage capacity, but most homeowners can expect to pay around $10,000 to $15,000 for a battery system (without solar panels).
Lithium-ion batteries are recommended for home solar systems since their long service life is suitable for a daily charge cycle. However, lead-acid batteries are viable as backup power systems that are used occasionally, or as part of an off-grid system.
Thanks to the Inflation Reduction Act, which was passed in August 2022, solar batteries qualify for a 30% federal tax credit. This is a credit you can claim on your federal income taxes for the year you purchase your solar system. So for example, you can claim $3,000 as a tax deduction if you purchase a $10,000 unit. While you can only claim the credit once, you can roll it over to the next year if the taxes you owe are less than your credit amount.
______
______
Advances in Energy Storage for Solar Energy:
Advances in Energy Storage for Solar Energy includes Improvements in Battery Technologies for Solar Applications, Integration of Storage with PV and Solar Thermal Systems, and Grid-Scale Energy Storage Solutions. A summary of research findings obtained from a variety of investigations that explore the performance of different solar energy storage systems is tabulated in Table below.
Summary of research findings from diverse solar energy storage systems:
|
Sources |
Type of Energy Storage |
Output Efficiency |
Main Findings |
|
Vieira et al. |
Lithium-ion Battery |
30% to 60% |
An integrated battery system improved self-consumption of solar energy and reduced reliance on grid electricity. |
|
Roberts et al. |
Battery Energy Storage |
30% to >70% |
BESS increased self-consumption of solar energy, resulting in a significant reduction in grid electricity purchases. |
|
Qusay et al. |
Lithium-ion Battery |
Up to 42% |
A lithium-ion battery system improved self-consumption rates, leading to substantial savings in electricity costs. |
|
Beevers et al. |
Pumped Hydro Storage |
Up to 50 GW |
Pumped hydro storage provided flexible capacity, enabling a higher solar energy share in the electricity mix. |
|
Chaudhary et al. |
Pumped Hydro Storage |
Up to 50% |
Pumped hydro storage reduced curtailment of solar PV energy, enabling higher solar PV penetration into the grid. |
|
Gioutsos et al. |
Pumped Hydro Storage |
Up to 70% |
Pumped hydro storage allowed for up to 70% solar energy penetration, improving system flexibility and stability. |
|
Nguyen et al. |
Vanadium Redox Flow Battery |
80–90% |
VRFB systems achieved high round-trip efficiency and long-duration storage capabilities. |
|
Monforti et al. |
Hydrogen Storage |
35–40% |
A hydrogen storage system achieved significant long-duration storage capabilities with moderate round-trip efficiency. |
|
Elberry et al. |
Hydrogen Storage |
High storage density and long-duration capabilities |
Hydrogen storage systems achieved long-duration storage of several months. |
|
Jia et al. |
Lithium-ion Battery with Silicon Anode |
Enhanced energy density and cycle life |
Silicon anode batteries demonstrated promise for long-lasting and high-capacity solar energy storage. |
|
Wessells et al. |
Advanced Lithium-ion Battery |
90% |
Advanced lithium-ion batteries exhibited high round-trip efficiency and cycle life, suitable for long-lasting storage. |
|
Dong et al. |
Lithium Iron Phosphate Battery |
97% |
LiFePO4 batteries demonstrated high round-trip efficiency and long cycle life, showcasing high durability. |
|
Jaszczur et al. |
Battery Energy Storage |
30% to 80% |
Integration of a battery system improved PV energy self-consumption, reducing reliance on grid electricity. |
|
Appen et al. |
Battery Energy Storage |
34% to 69% |
Battery integration increased PV system self-consumption and reduced grid reliance, enhancing solar energy utilization. |
|
Boukelia et al. |
Thermal Storage |
Up to 33% |
Thermal storage integration improved solar thermal power plant capacity factor, enabling continuous power generation. |
|
Lu et al. |
Grid-scale Storage |
Flexible Capacity |
Grid-scale storage (pumped hydro and batteries) provided flexibility for higher solar energy penetration into the grid. |
|
Chatzigeorgiou et al. |
Grid-scale Battery Energy Storage |
24% to 80% |
Grid-scale BESS increased self-consumption of solar energy and reduced grid reliance, impacting solar energy utilization. |
|
Johnson et al. |
Grid-scale Storage |
40% to 80% |
Grid-scale storage increased solar energy penetration, improving grid stability and reliability. |
_____
_____
Section-18
Efficiency of solar technologies:
For solar cells, the efficiency of energy conversion is defined as the percentage of incident solar power that gets converted into electrical output power. Specifically:
Efficiency (%) = Electrical output power (W) / Incident solar power (W)
Solar panel efficiency is measured at Standard Test Conditions (STC), using set temperature, irradiance and spectral distribution – this is called the IEC standard 61215. The STC are a temperature of 25°C, 1000 W/m2 irradiance and 1.5 AM spectral distribution. These are equivalent to a light hitting a panel at 37 degrees on a sunny day.
Under the same conditions, a panel with a higher efficiency will produce more electrical power than one with a lower efficiency.
Most polycrystalline panels on the market have an efficiency between 14 and 19%. Monocrystalline panels have a higher efficiency of up to 25%.
_
Comparison with other energy sources:
Let’s look at the efficiency of a range of energy resources – how well they convert their fuel input into useful energy output. Note that these are the practical efficiencies as seen in commercial solar panels, coal plants etc.
|
Energy source |
Maximum efficiency (approximate) |
|
Coal |
40% |
|
Geothermal |
35% |
|
Hydropower |
90% |
|
Natural gas |
50% |
|
Nuclear |
45% |
|
Solar |
25% |
|
Wind |
55% |
Other factors to note include the power lost in transmission – this can be around 7% for energy from a power plant, whereas solar is often generated and used on site (unless installed at utility scale). When comparing to non-renewables, you have to consider the cost too – sunlight is free, whereas you’d pay for all the fossil fuel you put in, even when most is wasted as heat. And of course, you also have to consider the timescale over which the energy source is renewed: daily, in the case of solar or wind vs millions of years, in the case of oil. Researchers are constantly finding new ways to improve Solar’s efficiency too.
____
____
Importance of high efficiency Solar Panel:
Although high-efficiency solar panels are more expensive, they offer several advantages. Plus, your electricity savings from going solar can help you recover the higher upfront cost over time. Here are a few benefits of high-efficiency solar panels:
-1. Use space more effectively
Since high-efficiency modules convert a higher percentage of sunlight into electricity, they allow you to use roof space more effectively. For example, compared to 10% efficient panels, 20% efficient panels can generate twice as much electricity per square foot. In other words, high-efficiency solar panels produce more energy using fewer panels. If the area available for your PV array is limited, you can achieve maximum power output with monocrystalline solar panels.
-2. Offer higher energy savings
Monocrystalline panels have a higher efficiency and wattage than polycrystalline panels of the same size. For example, when comparing 60-cell solar modules, you might find a 300-watt (W) poly panel versus a 370 W mono panel. Here’s an example of how solar panel wattage can impact your system size and energy savings:
- If you have space for 20 panels on your roof, you can reach a total system wattage of 6 kilowatts (kW) with polycrystalline panels and 7.4 kW with monocrystalline panels.
- With favorable sunlight, the 6 kW system can generate over 9,000 kWh of usable electricity each year, but a 7.4 kW system can generate over 11,000 kWh.
- Assuming you pay an electric tariff of 16 cents per kilowatt-hour (kWh), the 6 kW system can save around $1,440 in annual electricity bills, but the 7.2 kW system saves around $1,760.
The average cost of solar panels is $2.85 per watt, according to our March 2023 survey of 1,000 homeowners with installed solar. Since monocrystalline panels have a higher wattage, they also cost more than polycrystalline panels. However, the price difference is minimal when you compare both panel types in terms of cost per watt.
-3. Less Impact from High Temperatures
All solar panels suffer a small loss in wattage as they heat up. This effect is temporary — panels recover the lost productivity once they cool down. However, when you constantly expose solar panels to hot weather, the loss of production can add up over time. As a result, hot temperatures can result in a 10% to 25% decrease in solar panel efficiency.
Solar panels have a metric called the temperature coefficient, which describes the negative effect of heat. For example, a panel with a coefficient of -0.40% per Celsius degree will lose 8% productivity with a temperature rise of 20°C. On average, monocrystalline panels have lower temperature coefficients than polycrystalline panels, which means they are less affected by heat. This is a major advantage in warm regions where hot temperatures can impact solar panel performance over time.
-4. Qualify for Higher Solar Incentives
Many solar benefit programs calculate financial incentives by the per-watt capacity of your solar system. Since high-efficiency panels have a higher wattage, they can qualify for higher incentive amounts. However, this does not apply to incentive programs with fixed rebates.
The federal solar tax credit is a nationwide incentive that allows you to claim 30% of your solar system costs as a tax credit for the year you install panels. Since monocrystalline panels cost more, your total system cost will likely be higher than if you used polycrystalline panels. As a result, you will see a higher tax incentive per panel.
______
______
Limit to efficiency:
Shockley–Queisser limit:
Shockley-Queisser limit—which states that the maximum efficiency of a silicon solar cell based on a single p–n junction cannot exceed about 30%.
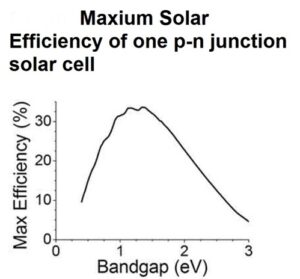
Figure above shows Shockley–Queisser limit for the efficiency of a solar cell, without concentration of solar radiation.
In physics, the radiative efficiency limit (also known as the detailed balance limit, Shockley–Queisser limit, Shockley Queisser Efficiency Limit or SQ Limit) is the maximum theoretical efficiency of a solar cell using a single p-n junction to collect power from the cell where the only loss mechanism is radiative recombination in the solar cell. It was first calculated by William Shockley and Hans-Joachim Queisser at Shockley Semiconductor in 1961, giving a maximum efficiency of 30% at 1.1 eV. The limit is one of the most fundamental to solar energy production with photovoltaic cells, and is one of the field’s most important contributions.
_
The key concept of the SQ limit is that solar cells can only convert photons with energies equal to or greater than the band gap energy of the semiconductor into electricity. Photons with energies below the band gap energy cannot be absorbed, while photons with energies significantly above the band gap energy generate excess energy in the form of heat and not electricity. This limit takes into account not only bandgap energy but also factors such the temperature of the cell and the spectrum of sunlight incident on the cell. Importantly, it applies to ideal solar cells, meaning that practical solar cells have efficiencies even lower than the SQ limit due to material imperfections and unavoidable extraction losses related to the balance between collecting carriers at a high electrical potential and collecting those carriers before they recombine.
_
The Shockley–Queisser limit is calculated by examining the amount of electrical energy that is extracted per incident photon. The calculation places maximum solar conversion efficiency around 33.7% assuming a single pn junction with a band gap of 1.4 eV (using an AM 1.5 solar spectrum). The most popular solar cell material, silicon, has a less favorable band gap of 1.12 eV, resulting in a maximum efficiency of about 32%. Modern commercial mono-crystalline solar cells produce about 24% conversion efficiency, the losses due largely to practical concerns like reflection off the front of the cell and light blockage from the thin wires on the cell surface. A cell’s efficiency can be increased by minimizing the amount of light reflected away from the cell’s surface. For example, untreated silicon reflects more than 30% of incident light. Anti-reflection coatings and textured surfaces help decrease reflection. A high-efficiency cell will appear dark blue or black.
____
Not all of the sunlight that reaches a PV cell is converted into electricity. In fact, most of it is lost. Multiple factors in solar cell design play roles in limiting a cell’s ability to convert the sunlight it receives. Designing with these factors in mind is how higher efficiencies can be achieved.
In a nutshell limit to efficiency exists due to several factors:
-1. Band gap losses
Light can be separated into different wavelengths with photons possessing a wide range of energies. Some of the photons don’t have enough energy to alter an electron-hole pair. Some of the photons have too much energy. Only a certain amount of energy, measured in electron volts (eV) and defined by the cell material (about 1.12 eV for crystalline silicon), is required to knock an electron loose. This is known as the band gap energy of the material. If a photon has more energy than the required amount, then the extra energy is lost (unless there is sufficient energy to create two electron-hole pairs). These two effects account for the loss of about 70% percent of the radiation energy incident on the silicon solar cell.
If a lower band gap is used, the cell will produce more current (fewer photons lost), but the cell voltage is lowered, which leads to a loss in power. A balance has to be struck: the optimal band gap, balancing these two effects, is around 1.4 eV for a cell made from a single material.
-2. Metallic contact grid
The electrons have to flow from one side of the cell to the other through an external circuit. The back of the cell can be covered with a metal, to allow for good conduction, but the top needs to be kept as clear as possible because photons can’t get through an opaque conductor. The circuit could be run at the sides of the cells, but the electrons would have to travel too far to reach the contacts. The internal resistance of silicon is quite high and losses would therefore be high.
To minimise the losses, cells are typically covered by a metallic contact grid, made using silver paste as in the standard cell structure. It has to be thick enough to minimise resistance and shorten the distance that electrons have to travel, while still minimising coverage of the cell surface. Inevitably, some photons are blocked by the grid.
-3. Recombination
One way for electric current to flow in a semiconductor is for a “charge carrier,” such as a negatively-charged electron, to flow across the material. Another such charge carrier is known as a “hole,” which represents the absence of an electron within the material and acts like a positive charge carrier. When an electron encounters a hole, they may recombine and therefore cancel out their contributions to the electrical current. Direct recombination, in which light-generated electrons and holes encounter each other, recombine, and emit a photon, reverses the process from which electricity is generated in a solar cell. It is one of the fundamental factors that limits efficiency. Indirect recombination is a process in which the electrons or holes encounter an impurity, a defect in the crystal structure, or interface that makes it easier for them to recombine and release their energy as heat. Auger recombination is the prevalent intrinsic recombination process in silicon. Auger recombination limits the lifetime and ultimate efficiency. So a direct semiconductor like GaAs that allows greater light absorption with a bandgap value 1.42 eV close to the value giving peak solar cell efficiency would be preferable for photovoltaic energy conversion although direct semiconductor has faster radiative recombination.
-4. Temperature
Solar cells generally work best at low temperatures. Higher temperatures cause the semiconductor properties to shift, resulting in a slight increase in current, but a much larger decrease in voltage. Extreme increases in temperature can also damage the cell and other module materials, leading to shorter operating lifetimes. Since much of the sunlight shining on cells becomes heat, proper thermal management improves both efficiency and lifetime. The concentration of sunlight might cause spots with significantly increased temperature on the surface of the solar cell causing the formation of hot (overheated) spots which can hamper the functionality and the life span of the system.
-5. Cell series resistance
Series resistance means two or more resistors are said to be connected in series when the same amount of current flows through all the resistors. Series resistance in a solar cell has three causes: firstly, the movement of current through the emitter and base of the solar cell; secondly, the contact resistance between the metal contact and the silicon; and finally the resistance of the top and rear metal contacts. The efficiency of solar cells cannot increase indefinitely because of power losses to heat. The amount of those losses is determined by the cell series resistance. The higher the series resistance, the bigger the power losses.
_
Note:
The Shockley–Queisser limit only applies to conventional solar cells with a single p-n junction; solar cells with multiple layers can (and do) outperform this limit, and so can solar thermal and certain other solar energy systems. In the extreme limit, for a multi-junction solar cell with an infinite number of layers, the corresponding limit is 68.7% for normal sunlight, or 86.8% using concentrated sunlight.
______
______
Efficiency in the Context of Concentrated Solar Power Plants:
Efficiency in the context of CSP plants refers to the ability of these facilities to convert sunlight into usable electricity effectively. It is typically expressed as a percentage and represents the ratio of actual electrical output to the solar energy input received by the system. In simpler terms, it measures how well a CSP plant utilizes sunlight to generate power.
Several factors influence the efficiency and output of concentrated solar power plants, including:
-1. Solar Irradiance: The amount of sunlight available at a particular location greatly impacts the output of CSP plants. Regions with higher solar irradiance tend to yield better results in terms of electricity generation.
-2. Technology: The design and technology used in a CSP plant play a crucial role in determining its efficiency. Advancements in CSP technology, such as the development of more efficient solar collectors and thermal energy storage systems, have significantly boosted overall efficiency levels.
-3. Temperature: The operating temperature of the CSP plant’s components, such as the solar collectors and heat transfer fluids, can influence efficiency. Higher temperatures generally result in better thermal efficiency but may also pose challenges in terms of too much energy will be lost due to blackbody emission reducing efficiency, and adversely affect material durability and maintenance.
-4. Location: The geographical location of a CSP plant affects its output due to variations in solar resource availability, ambient temperature, and atmospheric conditions. Factors such as proximity to the equator, altitude, and local weather patterns can impact overall performance.
-5. Maintenance and Operations: Regular maintenance and efficient operational practices are essential for maintaining optimal performance and maximizing efficiency & output over the plant’s lifespan.
_
Importance of Efficiency in Concentrated Solar Power Plants:
Efficiency is a critical aspect of concentrated solar power plants for several reasons:
-1. Cost-Effectiveness: Higher efficiency translates to lower production costs per unit of electricity generated, making CSP plants more economically viable compared to traditional fossil fuel-based power plants.
-2. Environmental Impact: Improved efficiency reduces the environmental footprint of CSP plants by minimizing the consumption of resources and the emission of greenhouse gases and other pollutants.
-3. Energy Security: Increasing the efficiency of CSP plants contributes to enhancing energy security by diversifying the energy mix and reducing dependence on finite fossil fuel resources.
-4. Technological Advancements: Research and development efforts focused on improving CSP plant efficiency drive innovation and technological advancements in the renewable energy sector, paving the way for a more sustainable future.
In a nutshell:
Efficiency is a key determinant of the performance and viability of concentrated solar power plants. By optimizing efficiency through advancements in technology, operations, and maintenance practices, CSP plants can play a significant role in meeting the world’s growing energy demands while reducing reliance on fossil fuels and mitigating climate change.
______
______
Increasing efficiency of solar technologies:
Some third-generation solar cells boost efficiency through the integration of multi-junction device geometry to approximately 42% efficiency under one-sun illumination. A multi-junction cell is one that incorporates multiple semiconducting active layers with different bandgaps. In a typical solar cell, a single absorber with a bandgap near the peak of the solar spectrum is used, and any photons with energy greater than or equal to the bandgap can excite valence-band electrons into the conduction band to create electron-hole pairs. However, any excess energy from high-energy photons will be quickly dissipated due to thermalization. Mutli-junction cells are able to recoup some of this energy lost to thermalization by stacking multiple absorber layers on top of each other with the top layer absorbing the highest-energy photons and letting the lower energy photons pass through to the lower layers with smaller bandgaps, and so on. This not only allows the cells to capture energy from photons in a larger range of energies, but also extracts more energy per photon from the higher-energy photons.
_
Concentrator photovoltaics use an optical system of lenses that sit on top of the cell to focus light from a larger area onto the device, similar to a funnel for sunlight. In addition to creating more electron-hole pairs simply by increasing the number of photons available for absorption, having a higher concentration of charge carriers can increase the efficiency of the solar cell by increasing the conductivity. Along with a proportional increase in the generated current, there also occurs a logarithmic enhancement in operating voltage, in response to the higher illumination. The addition of a concentrator to a solar cell can not only increase efficiency, but can also reduce the space, materials, and cost needed to produce the cell.
_
Concentrator photovoltaics and multijunction cells, both are employed in the highest-efficiency solar cell as of 2023, which is a four-junction concentrator cell with 47.6% efficiency.
_
Multi-Junction and Concentrator Best Solar Cell Efficiency (updated 03/27/2023):
|
Solar Cell Type |
Best Efficiency (%) |
|
|
4+ junction concentrator |
47.6(GaInP/AlGaAs/GaInAsP/GaInAs) |
|
|
3-junction concentrator |
44.4(GaInP/GaAs/GaInAs) |
|
|
3-junction non-concentrator |
39.46(GaInP/mQW-GaAs/GaInAs) |
|
|
4+ junction non-concentrator |
39.2(AlGaInP/AlGaAs/GaAs/GaInAs) |
|
|
2-junction concentrator |
35.5(GaInAsP/GaInAs) |
|
|
2-junction non-concentrator |
32.9(GaInP/GaAs) |
|
|
Perovskite/Si tandem |
32.5 |
|
|
GaAs concentrator |
30.8 |
|
|
Si single-crystal concentrator |
27.6 |
|
|
Si HIT |
26.81 |
|
|
Perovskite/CIGS tandem |
24.2 |
|
|
CIGS concentrator |
23.3 |
|
|
Organic tandem |
14.2(PDTB-EF-T/IT-4F) |
|
|
Data from the NREL 2023 Best Research-Cell Efficiency dataset. |
||
_____
_____
Cost of electricity as a function of the efficiency:
Low-cost, base-loadable, fossil based electricity has always served as a formidable cost competitor for electrical power generation. To provide a truly widespread primary energy source, solar energy must be captured, converted, and stored in a cost-effective fashion. Even a solar electricity device that operated at near the theoretical limit of 70% efficiency would not provide the needed technology if it were expensive and if there were no cost-effective mechanism to store and dispatch the converted solar energy upon demand. Hence, a complete solar-based energy system will not only require cost reduction in existing PV manufacturing methods, but will also require science and technology breakthroughs to enable, in a convenient, scalably manufacturable form, the ultralow cost capture, conversion, and storage of sunlight.
_
Figure below shows the fully amortized cost of electricity as a function of the efficiency and cost of an installed PV module.
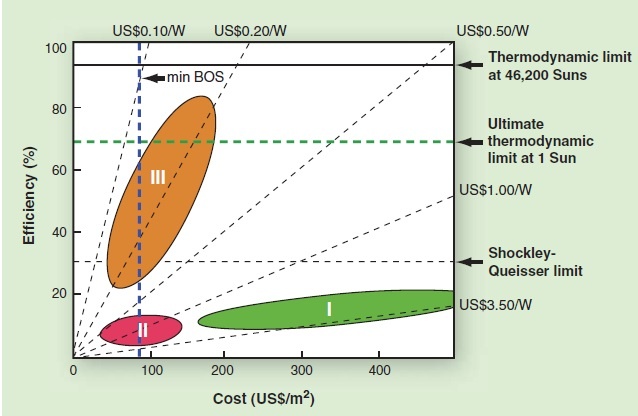
Figure above shows solar electricity costs as function of module efficiency and module cost.
The theoretical efficiencies are shown for three cases: the Shockley-Queisser limit for a quantum conversion device with a single band gap, in which carriers of lower energy are not absorbed and carriers of energy higher than the band gap thermalize to the band gap; the second-law thermodynamic limit on Earth for 1 Sun of concentration; and the second-law thermodynamic limit for any Earth-based solar conversion system. Current solar cell modules lie in zone I. The dashed lines are equi-cost lines on a cost per peak watt (Wp) basis. An estimate for the minimum balance-of-systems cost given current manufacturing methods is also indicated. A convenient conversion factor is that $1/Wp amortizes out to ~$0.05/kWh over a 30-year lifetime of the PV module in the field.
_
Because the total energy provided by the Sun is fixed over the 30- year lifetime of a PV module, once the energy conversion efficiency of a PV module is established, the total amount of “product” electricity produced by the module at a representative midlatitude location is known for the lifetime of the system. The theoretical efficiency limit for even an optimal single–band gap solar conversion device is 31%, because photons having energies lower than the absorption threshold of the active PV material are not absorbed, whereas photons having energies much higher than the band gap rapidly release heat to the lattice of the solid and therefore ultimately contain only a useful internal energy equal to that of the band gap. Small test cells have demonstrated efficiencies of >20%, with the remaining losses almost entirely due to small reflection losses, grid shading losses, and other losses at the 5 to 10% level that any practical system will have to some extent. Shipped PV modules now have efficiencies of 15 to 20% in many cases. At such an efficiency, if the cost of a module is ~$300/m2, and if we take into account the accompanying fixed costs in the so-called “balance of systems” (such as the inverter, grid connection, etc., which add a factor of ~2 to the total installed system cost), then the sale price of grid-connected PV electricity must be $0.25 to $0.30 per kilowatt-hour (kWh) to recover the initial capital investment and cost of money over the lifetime of the PV installation. Currently, however, utility scale electrical power generation costs are much less, with current and new installations costing ~$0.03 to $0.05 per kWh. Hence, for solar electricity to be cost-competitive with fossil-based electricity at utility scale, improvements in efficiency are helpful, but manufacturing costs must be substantially reduced.
_
In current manufacturing schemes for Si based solar cells, the cost of the processed and purified Si is only about 10% of the final cost of the PV module. Some of the Si is lost in cutting up boules into wafers, and other costs are incurred in polishing the wafers, making the diffused junction in the Si into a photovoltaic device, fabricating the conducting transparent glass, masking and making the electrical contacts, sealing the cells, connecting the cells together reliably into a module, and sealing the module for shipment. Hence, in such systems, the energy conversion efficiency is at a premium so as to better amortize these other fixed costs involved with making the final PV module. Improvements in efficiency above the 31% theoretical limit are possible if the constraints that are incorporated into the so-called Shockley- Queisser theoretical efficiency limit are relaxed. For example, if photons having energies greater than the band gap of the absorbing material did not dissipate their excess energy as heat, but instead produced more voltage or generated multiple, low-energy, thermalized electrons from the energy of a single absorbed photon, theoretical efficiencies in excess of 60% would, in principle, be attainable. Absorbers having a highly quantized band structure, such as quantum wells and quantum dots, can theoretically produce the desired effects. In fact, recent observations on PbSe quantum dots have demonstrated the production, with high quantum yield, of multiple excitons from a single absorbed photon, thereby establishing an existence proof for the process of interest. At present, however there is no method for efficiently extracting the photogenerated carriers from the quantum dot structure to produce electricity in an external circuit. Materials with “mini-bands” or with “intermediate bands” also offer the possibility for ultrahigh energy conversion efficiency. In this approach, different incident photon energies would promote absorption from different isolated energy levels and therefore allow for the production of different voltages. The phenomenon has been described theoretically but has yet to be demonstrated in a practical implementation.
_____
_____
Research studies to improve efficiency of solar technologies:
-1. Researchers improve efficiency of next-generation solar cell material, 2021:
Perovskites are a leading candidate for eventually replacing silicon as the material of choice for solar panels. They offer the potential for low-cost, low-temperature manufacturing of ultrathin, lightweight flexible cells, but so far their efficiency at converting sunlight to electricity has lagged behind that of silicon and some other alternatives. Now, a new approach to the design of perovskite cells has pushed the material to match or exceed the efficiency of today’s typical silicon cell, which generally ranges from 20 to 22 percent, laying the groundwork for further improvements. By adding a specially treated conductive layer of tin dioxide bonded to the perovskite material, which provides an improved path for the charge carriers in the cell, and by modifying the perovskite formula, researchers have boosted its overall efficiency as a solar cell to 25.2 percent — a near-record for such materials, which eclipses the efficiency of many existing solar panels. (Perovskites still lag significantly in longevity compared to silicon, however, a challenge being worked on by teams around the world.)
One of the keys to the team’s improvement of the material’s efficiency, was in the precise engineering of one layer of the sandwich that makes up a perovskite solar cell — the electron transport layer. The perovskite itself is layered with a transparent conductive layer used to carry an electric current from the cell out to where it can be used. However, if the conductive layer is directly attached to the perovskite itself, the electrons and their counterparts, called holes, simply recombine on the spot and no current flows. In the researchers’ design, the perovskite and the conductive layer are separated by an improved type of intermediate layer that can let the electrons through while preventing the recombination. This middle electron transport layer, and especially the interfaces where it connects to the layers on each side of it, tend to be where inefficiencies occur. By studying these mechanisms and designing a layer, consisting of tin oxide, that more perfectly conforms with those adjacent to it, the researchers were able to greatly reduce the losses.
______
-2. Researchers invent new triple-junction perovskite/Si tandem solar cells with high efficiency, 2024:
Solar cells can be fabricated in more than two layers and assembled to form multi-junction solar cells to increase efficiency. Each layer is made of different photovoltaic materials and absorbs solar energy within a different range. However, current multi-junction solar cell technologies pose many issues, such as energy loss which leads to low voltage and instability of the device during operation. To overcome these challenges, researchers demonstrated successful integration of cyanate into a perovskite solar cell to develop a cutting-edge triple-junction perovskite/Si tandem solar cell that surpasses the performance of other similar multi-junction solar cells. When assessing performance, scientists found that perovskite solar cells incorporated with cyanate can achieve a higher voltage of 1.422 volts compared to 1.357 volts for conventional perovskite solar cells, with a significant reduction in energy loss. The researchers also tested the newly engineered perovskite solar cell by continuously operating it at maximum power for 300 hours under controlled conditions. After the test period, the solar cell remained stable and functioned above 96 per cent capacity. Encouraged by the impressive performance of the cyanate-integrated perovskite solar cells, the research team took their ground-breaking discovery to the next step by using it to assemble a triple-junction perovskite/Si tandem solar cell. The researchers stacked a perovskite solar cell and a silicon solar cell to create a dual-junction half-cell, providing an ideal base for the attachment of the cyanate-integrated perovskite solar cell. Once assembled, the researchers demonstrated that despite the complexity of the triple-junction perovskite/Si tandem solar cell structure, it remained stable and attained a certified world-record efficiency of 27.1 per cent from an accredited independent photovoltaic calibration laboratory. Theoretical efficiency of triple-junction perovskite/Si tandem solar cells exceeds 50 per cent, presenting significant potential for further enhancements, especially in applications where installation space is limited.
______
-3. Most efficient QD solar cells, 2024:
A groundbreaking research breakthrough in solar energy has propelled the development of the world’s most efficient quantum dot (QD) solar cell, marking a significant leap towards the commercialization of next-generation solar cells. This cutting-edge QD solution and device have demonstrated exceptional performance, retaining their efficiency even after long-term storage. Researchers has unveiled a novel ligand exchange technique and this innovative approach enables the synthesis of organic cation-based perovskite quantum dots (PQDs), ensuring exceptional stability while suppressing internal defects in the photoactive layer of solar cells. This technology has achieved an impressive 18.1% efficiency in QD solar cells. This remarkable achievement represents the highest efficiency among quantum dot solar cells recognized by the National Renewable Energy Laboratory (NREL) in the United States.
______
-4. Flexophotovoltaic effect to harvest Solar Energy, 2024:
The engineering of structural deformations in light-sensitive semiconductors can boost the efficiency of solar cells:
Traditional solar cells are based on junctions between semiconductors, where a current is produced by photogenerated carriers separated by an electric field at the junction. Efforts to enhance solar-cell performance have focused on refining semiconductor properties and on perfecting devices. Concurrently, researchers are exploring alternative photovoltaic mechanisms that could work in synergy with the junction-based photovoltaic effect to boost solar-cell efficiency. Within this context, the engineering of a strain gradient in the material has emerged as a promising research direction. In this phenomenon, known as the flexophotovoltaic effect, an inhomogeneous strain in the material produces a photovoltaic effect in the absence of a junction. Researchers have uncovered a pronounced flexophotovoltaic effect in halide perovskites—materials pivotal to the development of fourth-generation solar cells with high efficiency and low production costs. Remarkably, the effect is orders of magnitude larger than in previously studied flexophotovoltaic materials, offering great promise for improving solar-cell technologies.
_
Photovoltaic effects require devices or materials that break inversion symmetry. The symmetry breaking creates a preferential direction for photogenerated electrons and holes to flow, generating a sizeable current before the carriers recombine. In traditional solar cells, symmetry is inherently broken at the interface between two different materials—a p–n junction between a hole-doped (p) and an electron-doped (n) material. Certain materials, known as piezoelectrics, also display inversion-symmetry breaking in their crystallographic structures. These materials display a bulk photovoltaic effect. Unlike the junction-based effect, the bulk one relies on a charge separation mechanism arising from the asymmetric distribution of photoexcited carriers in real and momentum space. This behavior leads to unique characteristics, such as a photocurrent that depends on light polarization and a photovoltage that can exceed the band gap of the semiconducting material. In contrast, the photovoltage obtained in a junction-based device cannot exceed the material band gap, limiting the maximum power output of a solar cell, which scales with the product of photovoltage and photocurrent. With judicious design, both junction-based and bulk photovoltaic effects can operate in concert within a single device, boosting its performance. However, the bulk photovoltaic effect is typically plagued by low efficiency. What’s more, the semiconductors typically used in mainstream solar cells are centrosymmetric, hence do not display the bulk photovoltaic effect.
_
A viable approach to addressing this challenge involves altering the semiconductor structure to disrupt its symmetry. The engineering of a strain gradient, a deformation of the material structure that increases along a spatial coordinate, has proven to be an effective means to break inversion symmetry and induce an electric dipole in materials regardless of their symmetry. Centrosymmetric materials subject to a strain gradient can exhibit the piezoelectric effect and transform mechanical energy into electrical energy, a phenomenon known as the flexoelectric effect. Similarly, the breaking of inversion symmetry obtained by applying a strain gradient to a semiconductor can lead to the emergence of the bulk photovoltaic effect. This strain-gradient-induced photovoltaic effect is referred to as the flexophotovoltaic effect and was demonstrated in the oxide perovskite SrTiO3 (STO). However, the magnitude of the effect achievable in materials—in particular, those integral to solar-cell technologies—remained until now insufficiently explored.
_
Researchers investigate the flexophotovoltaic effect in single crystals of two halide perovskites called MAPbBr3 (MAPB) and MAPbI3 (MAPI), where MA stands for methylammonium, CH3NH3. Thanks to low production cost, long carrier lifetime, and excellent charge-transport properties, these hybrid perovskites, which combine both organic and inorganic compounds, have emerged as some of most attractive solar-cell materials. These and related materials led perovskite-cell efficiency to surge from about 3% in 2009 to over 25% today—a figure that rivals that of the best silicon-based solar cells. Researchers fabricated capacitor structures by depositing electrodes on either side of these crystals. They then bent these crystals vertically to introduce an out-of-plane strain gradient and performed experiments to characterize the flexophotovoltaic efficiency.
_
Since MAPB is centrosymmetric at room temperature, the MAPB capacitor generates a negligible photocurrent when flat, but bending it activates the photovoltaic effect. Under illumination, both the measured photocurrent and the photovoltage increase linearly with the applied strain gradient. The observed response outperforms that of STO by nearly 3 orders of magnitude. Furthermore, the researchers showed that by increasing the strain gradient (through an extremely large local deformation obtained by applying pressure with the tip of an atomic force microscope), they could substantially increase the photovoltage in the crystal, achieving values more than twice larger than the material’s band gap. This achievement is groundbreaking, as it marks the first demonstration of a flexophotovoltaic-induced voltage exceeding the material band gap, underscoring the vast potential of strain gradients in enhancing photovoltaic efficiency.
_
MAPI capacitors, on the other hand, display a substantial bulk photovoltaic effect even in the flat state. This effect is ascribed to the presence of a macroscopic polarization within the crystal whose origin has yet to be established (it may be due to either a ferroelectric effect or chemical gradients in the material). Analogous to the behavior previously observed in ferroelectric materials, this bulk photovoltaic effect in MAPI crystal can be modulated by the application of an external bias. By bending the crystal, the flexophotovoltaic effect adds to the innate bulk photovoltaic effect, leading to an enhanced or depressed photocurrent depending on the sign of the applied strain gradient. The experiments with MAPI capacitors thus show that the flexophotovoltaic effect can coexist with other bulk photovoltaic effects—offering an option for combining multiple efficiency-enhancing phenomena.
_
The remarkable performance of the flexophotovoltaic effect observed by researchers in halide perovskite crystals validates the ability of strain gradients to boost the efficiency of solar-energy harvesting. The relatively low elastic modulus of these halide perovskite materials suggests a higher tolerance for mechanical deformation compared to traditional organic semiconductors like silicon, meaning that significant strain gradients could be incorporated in an operational device. The next step would be the demonstration of the combination of traditional and flexophotovoltaic effects. Such a step would involve designing device configurations that integrate both built-in fields at a p–n junction and strain gradients. The results obtained for halide perovskites show that the combination of the two effects holds great potential for overcoming the tyranny of the Shockley-Queisser limit—which states that the maximum efficiency of a solar cell based on a single p–n junction cannot exceed about 30%.
_____
-5. Innovation for indoor solar cells maximizes the use of light energy, 2024:
Researchers have synthesized materials that can improve solar elements for indoor use. Such photovoltaic cells, which can also be integrated into various electronic devices, generate electricity even in low-light conditions. They have synthesized a series of new efficient hole-transporting thiazol[5,4-d]thiazole derivatives for indoor perovskite photovoltaic cells. The main function of their layers is to selectively transport holes (positive charge carriers) while blocking electrons (negative charge carriers). This selective charge transport helps in reducing recombination losses, thereby improving the overall efficiency of the solar cell. An ideal hole transporting semiconductor for these applications would possess high hole mobility and good energy level alignment with those of adjacent layers. Researchers have developed organic semiconductor that allowed it to reach a power conversion efficiency of 37.0% under 3000 K LED (1,000 lx) illumination. Studies have shown the great potential of thiazol[5,4-d]thiazole derivatives for increasing the efficiency of perovskite solar cells.
______
______
Section-19
Cost of solar power:
Note:
Please do not confuse between cost of solar technology and cost of solar electricity. Cost of solar PV technology is in dollar per watt. Cost of solar electricity is in dollar per kWh or MWh.
_
The typical cost factors for solar power include the costs of the modules, the frame to hold them, wiring, inverters, labour cost, any land that might be required, the grid connection, maintenance and the solar insolation that location will receive. Photovoltaic systems use no fuel, and modules typically last 25 to 40 years. Thus upfront capital and financing costs make up 80% to 90% of the cost of solar power. In 2021 in the US, residential solar cost from 2 to 4 dollars/watt (but solar shingles cost much more) and utility solar costs were around $1/watt. In many countries, solar power is the lowest cost source of electricity. In Saudi Arabia, a power purchase agreement (PPA) was signed in April 2021 for a new solar power plant in Al-Faisaliah. The project has recorded the world’s lowest cost for solar PV electricity production of USD 1.04 cents/ kWh.
_
Grid parity:
Solar generating stations have become progressively cheaper in recent years, and this trend is expected to continue. Meanwhile, traditional electricity generation is becoming progressively more expensive. These trends led to a crossover point when the levelized cost of energy from solar parks, historically more expensive, matched or beat the cost of traditional electricity generation. This point depends on locations and other factors, and is commonly referred to as grid parity.
For merchant solar power stations, where the electricity is being sold into the electricity transmission network, the levelised cost of solar energy will need to match the wholesale electricity price. This point is sometimes called ‘wholesale grid parity’ or ‘busbar parity’.
Prices for installed PV systems show regional variations, more than solar cells and panels, which tend to be global commodities. The IEA explains these discrepancies due to differences in “soft costs”, which include customer acquisition, permitting, inspection and interconnection, installation labor and financing costs.
The first places to reach grid parity were those with high traditional electricity prices and high levels of solar radiation. The worldwide distribution of solar parks is expected to change as different regions achieve grid parity. This transition also includes a shift from rooftop towards utility-scale plants, since the focus of new PV deployment has changed from Europe towards the Sunbelt markets where ground-mounted PV systems are favored.
______
______
Falling cost of solar:
Many of us might assume that the reason so much energy still comes from gas and coal power plants is simple economics: those fuels are cheaper. But though it was once true, that assumption has actually been obliterated by a recent decline in solar and wind costs over the past decade.
When it comes to the cost of energy from new power plants, onshore wind and solar are now the cheapest sources—costing less than gas, geothermal, coal, or nuclear.
Solar, in particular, has cheapened at a blistering pace. Just 10 years ago, it was the most expensive option for building a new energy development. Since then, that cost has dropped by 90 percent, according to data from various sources. Utility-scale solar arrays are now the least costly option to build and operate.
Graph below shows cost of different energy sources changing from 2009 to 2019.
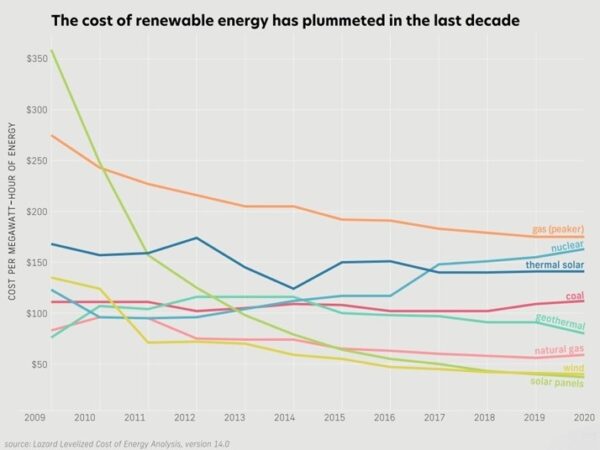
_
The story behind low costs:
Solar became cheap due to forces called learning curves and virtuous cycles. Harnessing the power of the sun used to be so expensive that it was only used for satellites. In 1956, for instance, the cost of one watt of solar capacity was $1,825. (Now, utility-scale solar can cost as little as $0.70 per watt.)
The initial demand for satellites fueled a so-called “virtuous cycle.” The more panels were produced for satellites, the more their price declined, and the more they were adopted for other niche purposes. As the cost further declined due to technology improvements and the rise of economies of scale, solar was able to eventually debut as a viable general-purpose energy source. Since 1976, each doubling of solar capacity has led to a 20.2 percent average decline in the price of solar panels.
_
The general idea holds that as production quantity increases, there is a predictable reduction in manufacturing cost. The price of solar modules declined when more of them were produced. More production gave us the chance to learn how to improve the production process: a classic case of learning-by-doing. The initial demand in the high-tech sector meant that some solar technology was produced and this initial production started a virtuous cycle of increasing demand and falling prices.
The figure below shows this mechanism. To satisfy increasing demand more solar modules get deployed, which leads to falling prices; at those lower prices the technology becomes cost-effective in new applications, which in turn means that demand increases. In this positive feedback loop solar technology has powered itself forward ever since its early days in outer space.
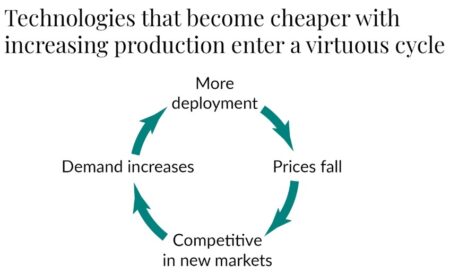
Figure above shows a cycle of deploying more of a technology causes its prices to fall, which increases demand, and more is deployed.
The learning rate of solar PV modules is 20.2%. With each doubling of the installed cumulative capacity the price of solar modules declines by 20.2%. The high learning rate meant that the cost of technology of solar electricity declined rapidly. The price of solar modules declined from $106 to $0.38 per watt. A decline of 99.6%.
__
Graph below shows price of solar modules dropping as capacity increased from 1976 to 2019.
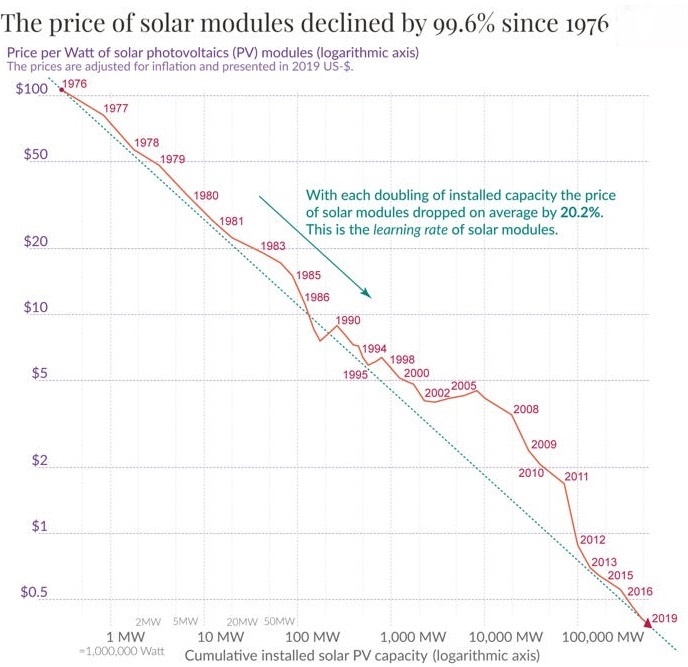
Figure above shows price of solar panels as a function of cumulative installed capacity. On the horizontal axis, we have the cumulative installed capacity of solar panels, and on the vertical axis, the cost. Both are measured on logarithmic scales, and the trend follows a straight line. That means the fall in cost has been exponential.
Costs have fallen by around 20% every time the global cumulative capacity doubles. Over four decades, solar power has transformed from one of the most expensive electricity sources to the cheapest in many countries.
Mark Paul, an environmental economist at the New College of Florida, adds that this cycle didn’t happen in a business-only vacuum. “The US government invested serious sums of money into developing modern [photovoltaic] technology during early stages of what we think of as the price curve,” he says. “It drastically improved the efficiency of solar modules, both in our ability to produce them and how much energy solar is able to produce.”
_
The costs of fossil fuels and nuclear power depend largely on two factors, the price of the fuel that they burn and the power plant’s operating costs. Renewable energy plants are different: their operating costs are comparatively low and they don’t have to pay for any fuel; their fuel doesn’t have to be dug out of the ground, their fuel – the wind and sunlight – comes to them free. Fossil fuels, in comparison, can’t keep up with this pace. That’s because fossil power plants have to buy mined fuels to operate. In coal plants, supplying the coal accounts for about 40 percent of total expenses. Sunshine and wind are free, which allows the costs of tapping into their power to decline sharply as technology improves and the industry grows. What is determining the cost of renewable power is the cost of the power plant, the cost of the technology itself. Solar power got so cheap because solar technology got cheap.
The exponential decline in solar PV costs has made solar energy one of the cheapest forms of electricity in many parts of the world. This trend is expected to continue as innovations in materials, manufacturing processes, and system design further improve the efficiency and cost-effectiveness of solar PV technology. The increasing affordability of solar energy is driving its adoption across sectors, from residential rooftops to utility-scale power plants.
_____
_____
LCOE:
Levelized cost of electricity/energy (LCOE) refers to the estimated revenue required to build and operate a generator over a specified cost recovery period. LCOE is often cited as a convenient summary measure of the overall competitiveness of different generating technologies. The levelized cost of electricity (LCOE) is the most common indicator to compare costs of electricity generation from various technologies (Aldersey-Williams and Rubert, 2019; Dobrotkova et al. 2018; Ouyang and Lin, 2014; Timilsina et al. 2013; Timilsina et al. 2012). LCOE refers to the cost of producing one unit of electricity from a particular technology, including capital costs, fixed and variable operation & maintenance (O&M) costs, and fuel costs. LCOE also accounts for quality of generation resources (e.g., availability of wind or solar), and other characteristics of the technology (Joskow, 2011; Stacy and Taylor, 2018; IEA, 2015; IRENA, 2020).
_
LCOE is increasingly used to compare the costs of new and renewable energy technologies with fossil fuel-based technologies. If the renewables are calculated to be cheaper than fossil fuel based technologies based on LCOE, that could signal the possibility of an expanding market for the renewables (Shea and Ramgolam, 2019; Lazard, 2019; Partridge, 2018; Myhr et al. 2014). If the LCOEs of renewables are higher than those of fossil fuels, or higher than prevailing grid electricity (shadow) prices, policy makers could use the difference as a basis to design subsidies to promote renewables (Ouyang and Lin; 2014). If a carbon tax is imposed on fossil fuels, the size of the carbon tax relative to the difference between LCOEs of renewable- and fossil fuel- based technologies provides some indication of the degree to which renewables can compete with fossil fuel-fired generation once the tax is imposed (Timilsina et al. 2012).
_
In general terms, LCOE is the estimated amount of money that is incurred for a particular electricity generation plant to produce a standard amount of electricity (either kWh or MWh) over its expected lifetime. Despite some critiques of LCOE as a tool for comparing costs across power generation technologies such as Hirth et al. (2015), Schmalensee (2016) and Synapse Energy Economics (2016) amongst others; LCOE remains a robust tool, as it offers several advantages as a cost metric, such as its ability to normalise costs into a consistent format across decades and technology types. Additionally, it provides ample flexibility to incorporate many factors and parameters to provide comprehensive cost perspectives. Consequently, it has become the de-facto standard for cost comparisons amongst the many stakeholders such as policymakers, analysts, and advocacy groups (Rhodes et al., 2017). There are many organisations that estimate LCOE values on an annual basis.
_
The costs of electricity generation from a given technology vary widely across countries or locations. For example, the LCOE of solar PV in Japan is almost 2.5 times as high as that of India. Similarly, the LCOE of wind power in Italy is almost twice as high as that of China (Timilsina and Kalim, 2020). An LCOE estimation using inputs applicable to a location will not be useful for another place. Moreover, LCOEs reported by various sources or studies cannot be compared because of differences in underlying assumptions and input data. It would be misleading to generalize an LCOE estimate carried out for a country and apply it elsewhere. It is also misleading if particular input data (e.g., capital cost, discount rate, capacity availability factors) applicable for a location, are used to calculate LCOEs somewhere else. Instead, it would be useful to compute a large number of LCOEs considering a range of values for each variable used to calculate the LCOE. This would provide insight into how LCOEs can vary across the values of variables. From the range of LCOEs thus available, one could use values that are most reflective for a given location.
_____
_____
With increasingly widespread implementation of renewable energy sources, costs have declined, most notably for energy generated by solar panels as seen in the figure below:
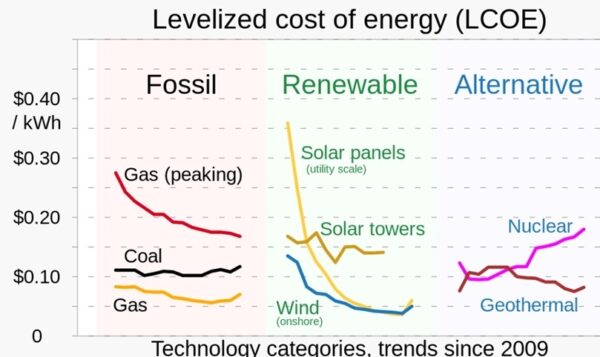
_____
_____
Levelized cost of energy in the U.S. 2023, by source:
Rooftop solar photovoltaic installations on residential buildings and nuclear power have the highest unsubsidized levelized costs of energy generation in the United States. If not for federal and state subsidies, rooftop solar PV would come with a price tag between 117 and 282 U.S. dollars per megawatt hour. These pricing estimates are based on underlying assumptions of 60 percent debt made with eight percent interest rate and 40 percent equity at 12 percent cost for all energy generation types. Rooftop installations have a higher levelized cost range due to their relatively small capacity when compared with utility-scale power plant facilities. Globally, the rooftop share in solar PV deployment is forecasted to reach 31 percent in 2021.
_
Levelized cost of electricity or energy generation (LCOE) is a measure used to compare cost efficiency of different electricity generating technologies. It describes the average expense of building and maintaining a power plant divided by its total power output over the facility’s lifetime. The global levelized cost of electricity for utility scale solar PV ranges between 30 and 180 U.S. dollars per megawatt hour. The economic viability of solar PV installations is dependent on a variety of factors largely centering around topography and the predominant weather pattern at the installation site. In regions with high sunshine duration, installing solar PV would come with lower LCOE’s as electricity production may be higher. As countries may stretch across highly variable topography and even across climate zones, solar PV LCOE may also vary greatly within a country. The U.S. has some of the lowest LCOE’s for utility-scale solar PV.
_
Estimated unsubsidized levelized costs of energy generation in the United States in 2023, by technology (in U.S. dollars per megawatt hour):
|
Characteristic |
Low estimate |
High estimate |
|
Solar PV – rooftop residential |
117 |
282 |
|
Nuclear |
141 |
221 |
|
Gas peaking |
115 |
221 |
|
Solar PV – community and commercial & industrial |
49 |
185 |
|
Coal |
68 |
166 |
|
Wind – offshore |
72 |
140 |
|
Wind with storage – onshore |
42 |
114 |
|
Solar PV and storage – utility-scale |
46 |
102 |
|
Geothermal |
61 |
102 |
|
Gas combined cycle |
39 |
101 |
|
Solar PV – utility-scale |
24 |
96 |
|
Wind – onshore |
24 |
75 |
As seen in the table above, utility scale solar PV is cheaper than coal, nuclear and gas, even without any subsidy.
_____
_____
Renewable power generation costs in 2022: IRENA analysis:
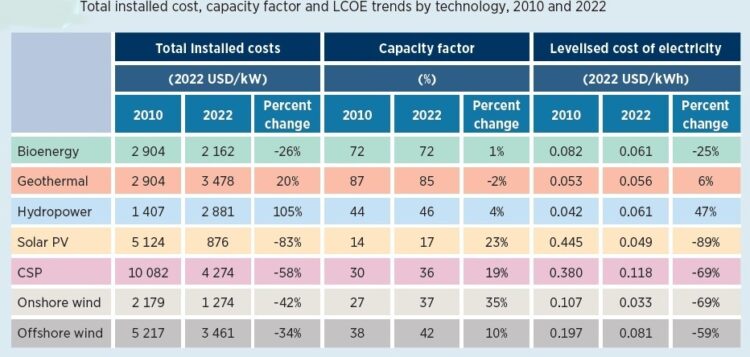
- The global weighted average levelised cost of electricity (LCOE) of utility-scale photovoltaic (PV) plants declined by 89% between 2010 and 2022, from USD 0.445/kilowatt hour (kWh) to USD 0.049/kWh.
- The cost of crystalline solar PV modules sold in Europe declined by 91% between December 2009 and December 2022.
- Solar PV capacity grew 26-fold between 2010 and 2022, with over 1047 gigawatts (GW) installed by the end of 2022.
- Between 2010 and 2022, the global weighted average levelised cost of electricity (LCOE) of concentrating solar power (CSP) plants fell by 69%, from USD 0.380/kilowatt hour (kWh) to USD 0.118/kWh. However, only a single plant has been commissioned in 2021 and 2022, so these years are not necessarily representative.
IRENA says that China drove the global decrease in solar and onshore wind costs in 2022, while other markets had more varied outcomes, including higher costs in several important markets.
IRENA also noted that while PV was 710% pricier than the least expensive fossil fuel-powered solution in 2010, by 2022, it had become 29% cheaper than the least expensive fossil fuel-powered option.
The world must add 1000 GW of renewable power annually on average every year until 2030 to keep 1.5°C within reach, more than three times 2022 levels. There is no time for a new energy system to evolve gradually as was the case for fossil fuels.
______
______
Solar is now ‘cheapest electricity in history’, confirms IEA 2020 analysis:
The world’s best solar power schemes now offer the “cheapest…electricity in history” with the technology cheaper than coal and gas in most major countries. That is according to the International Energy Agency’s World Energy Outlook 2020. The IEA says that new utility-scale solar projects now cost $30-60/MWh in Europe and the US and just $20-40/MWh in China and India, where “revenue support mechanisms” such as guaranteed prices are in place. These costs “are entirely below the range of LCOE [levelised costs] for new coal-fired power plants” and “in the same range” as the operating cost of existing coal plants in China and India, the IEA says.
_____
_____
Lazard’s Levelized Cost of Energy (“LCOE”) analysis 2023:
Levelized Cost of Energy Comparison—Unsubsidized Analysis 2023:
Selected renewable energy generation technologies are cost-competitive with conventional generation technologies under certain circumstances as seen in figure below:
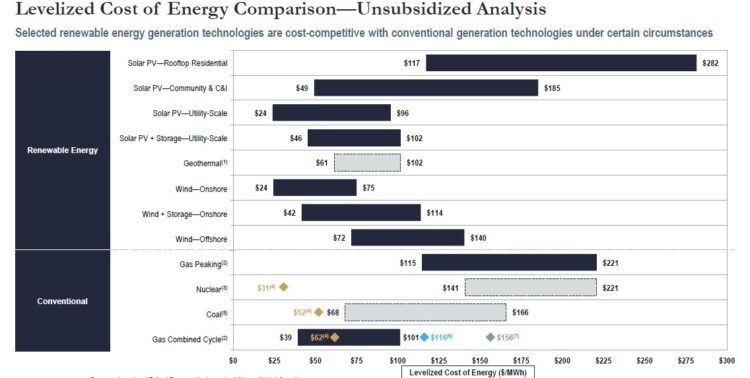
A new report by Lazard compares the levelized cost of energy (LCOE) for various generation technologies on a $/MWh basis. It shows that utility-scale solar and onshore wind LCOE increased for the first time in 2023, at $24/MWh to $96/MWh for solar and $24/MWh to $75 MWh for wind. Nevertheless, the two renewable sources are still the economic frontrunners when compared to nuclear, gas, and coal.
The report offers a comparative LCOE analysis for various generation technologies on a $/MWh basis, with exceptions for US federal tax subsidies, fuel prices, carbon pricing, and the cost of capital. The report also includes a cost-of-firming-intermittency analysis for the first time. Unlike in previous years, the LCOE for utility-scale solar omits thin-film technology and only focuses on crystalline silicon.
In a base comparison, without considering subsidies, fuel prices, or carbon pricing, utility-scale solar and wind have the lowest LCOE of all sources. Utility-scale solar PV comes in anywhere from $24/MWh to $96/MWh, while onshore wind registers the lowest possible LCOE over the shortest range, from $24/MWh to $75/MWh. Offshore wind’s LCOE ranges between $72/MWh and $140/MWh.
For comparison, under the same criteria, gas peaking comes in at $115/MWh to $221/MWh, nuclear is $141/MWh to $221/MWh, coal is $68/MWh to $166/MWh, and gas combined cycle is $39/MWh to $ 101/MWh, according to Lazard.
Unsubsidized residential rooftop PV has an LCOE between $117/MWh and $282/MWh, while the LCOE of community and commercial and industrial (C&I) solar ranges between $49/MWh and $185/MWh. When factoring in federal tax subsidies under the US Inflation Reduction Act, including domestic contest provisions, rooftop PV comes in at $74/MWh to $229/MWh, and community/C&I rooftop PV at $32/MWh to $155/MWh.
______
______
Solar PV LCOE expected to slide to $0.021/kWh by 2050, DNV says in 2023:
By 2050 the levelized cost of energy (LCOE) for solar PV will be $0.021/kWh (figure below), the international registrar and risk management company DNV, based in Norway, predicts in a new report published recently. The Energy Transition Outlook 2023 – a 211-page document charting global and regional renewable energy trends until mid-century – prophesizes some solar PV’s LCOE will be already close to $0.020/kWh by 2025.
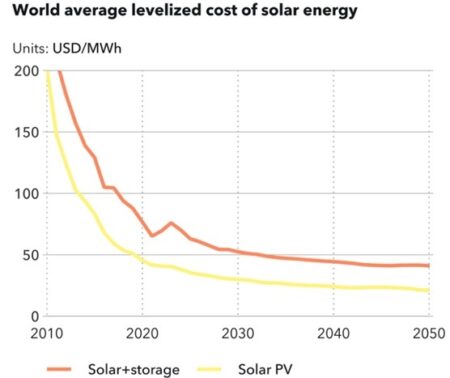
The Energy Transition Outlook 2023 expects solar to reach 54% of installed generation capacity by 2050, but only represent 39% of the world’s grid electricity generation. “The efficiency or the capacity factory of solar power stations trail behind other renewable energy sources like wind and hydropower,” the document states, “nevertheless, the underlying cause of Solar’s rapid proliferation lies in its dwindling costs.”
DNV expects China and the United States to continue leading global solar PV installations for the next two-and-a-half decades, however, both countries will experience “a slight dip” by 2050 as they reach installation saturation. India, the Middle East and North Africa will creep up in the solar hierarchy, nearly tripling their shares, from 6% and 3% in 2022 to 14% and 12% by mid-century, respectively.
_____
_____
Is LCOE misleading and misrepresenting facts?
-1. Is the cost of Nuclear Energy misunderstood vis-à-vis renewables:
Lazard, a leading investment and asset management firm, uses Levelized Cost of Energy (LCOE) to estimate the average cost of various forms of energy. Lazard found that utility-scale solar and wind is around $40 per megawatt-hour, while nuclear plants average around $175. Because LCOE is often used to argue for renewables and against nuclear, it requires closer examination.
LCOE was developed as a tool to describe “the cost of energy for power plants of a given nature.” But this tool fails when it attempts to compare the different energy sources needed to provide reliable, 24/7 electricity supply. The cost and performance of an electricity grid is dominated by the extremes and the worst cases. Extreme shortages of supply. Extreme difficulties with combining the right generators at the right time at the right user load.
Another factor that cost analyses like levelized cost of energy miss is the energy density of each form of electricity and the subsequent environmental impact of the facilities themselves. A wind facility would require more than 140,000 acres — 170 times the land needed for a nuclear reactor — “to generate the same amount of electricity as a 1,000 megawatt reactor,” according to the Nuclear Energy Institute. The institute notes that while nuclear requires 103 acres per million megawatt-hours, solar needs 3,200 acres, and wind uses up 17,800 acres.
Considering the LCOE of new sources also misses the comparatively low cost of existing generation, according to a 2019 report by the Institute for Energy Research. “The average LCOEs for existing coal ($41/megawatt-hour), CC [combined-cycle] gas ($36/MWh), nuclear ($33/MWh) and hydro ($38/MWh) resources are less than half the cost of new wind resources ($90/MWh) or new PV solar resources ($88.7/MWh) with imposed costs included,” the report states. Imposed costs include the need to keep baseload energy like coal or natural gas idling in case the wind or solar are not producing enough energy to meet demand; such costs are often ignored by advocates of wind and solar.
Thus, levelized cost of energy misrepresents the cost of solar and wind as too low, puts nuclear energy’s costs as too high, and misses key parts of the picture.
The cost of nuclear power itself doesn’t need to be as high as it is in the United States which takes more than 10 years. Japanese nuclear power plants only take an average of three to four years to build, from pouring concrete foundation to grid connection. French power plants mostly took between five and eight years to build. What do licensing, approval, and construction time have to do with costs? Experience has shown that the cost of building a nuclear power plant increases roughly in proportion to the construction time squared. This is because the longer the project goes on, the more requirements, technical changes, and legal actions are levied on it… By multiplying the time it takes to complete a nuclear power plant, the antinuclear regulatory process has inflated the cost of nuclear power by two orders of magnitude.
Given that solar and wind receive almost five times the subsidies that nuclear receives and more than 50 times the subsidies (when considered in terms of dollars of subsidy received per unit of energy produced), the competition is hardly slanted in nuclear’s favor.
The problem of cost is therefore one that is both exaggerated by critics and exacerbated by overzealous regulation. In other words, not only is the problem not as bad as it is often portrayed, but there’s far more significant room for improvement.
______
-2. Irrelevance of LCOE for solar and wind:
“I’m amazed at how many people still don’t realize that LCOE [levelized cost of electricity] is a misleading basis for estimating total system costs to governments, electricity consumers and taxpayers … That’s why I generally ignore it.” So begins an enlightening discussion from Michael Cembalest, Chairman of Market and Investment Strategy for J.P. Morgan Asset & Wealth Management, in his company’s 13th annual energy paper.
Though LCOE is often used as a “bottom-line” number for evaluating the economics of wind and solar projects, Cembalest puts little stock in its usefulness.
“Levelized cost of energy is a distraction,” he says, if you’re trying to understand total system costs of electricity.” This is because, when computed for individual generation or storage technologies, LCOE does not properly take account of:
- the need for backup power, storage and reserve margins to maintain system reliability
- the value of electricity supplied at different times of the day or year
- the need to overbuild wind and solar capacity to meet demand in deeply decarbonized systems
“In other words,” Zembalest says, “LCOE only measures the cost of a marginal MWh of wind or solar power and typically does not include any of these other capital or operating costs.” Zembalest describes a conversation with Paul Joskow, the Elizabeth and James Killian Professor of Economics Emeritus at MIT. Joscow recounted that LCOE was originally developed to compare costs of dispatchable baseload nuclear and coal plants with the same capacity factors. LCOE, Joscow asserts, is “inappropriate for comparing intermittent generating technologies like wind and solar with dispatchable generation…and also overvalues intermittent generating technologies compared to dispatchable baseload generation.”
To illustrate this point, Zembalest cites a recent example from the United States. The state of Texas has an enormous amount of wind generation, and it has also experienced some extreme weather events. On Dec. 23, 2022, temperatures dropped to 13⁰-28⁰F vs average levels, causing electricity demand to spike while renewable output collapsed. The result was a massive gap that only backup power could fill.
“Natural gas output doubled,” Zembalest says, “but this was not accounted for accounted for in LCOE.” In December 2022, Texas wind capacity factors averaged 32%. “But that doesn’t mean that wind provided steady power at 32% of installed capacity,” he says. In reality, Texas wind generation varied from a low of 5% of capacity to a peak of 70% during the month. Yet LCOE is calculated the exact same way whether Texas wind capacity factors are 32% for every hour of the month, or if they average 32% but vary from 5%-70%. In the latter scenario, backup thermal power/storage needs, and associated costs, are much higher than in the former. As for energy storage, “low wind conditions lasted for 3 days, in which case,” says Zembalest, “many billions of dollars of 4–6-hour storage would have been needed” to compensate. LCOE, he says, “is the cocktail napkin of energy math.”
_____
_____
How cheap does solar power need to get before it takes over the world? A 2016 study:
A provocative essay in Nature Energy by two solar analysts, Varun Sivaram and Shayle Kann, argues that solar still has some hard economic obstacles to overcome before it can become a major energy source and provide (let’s say) one-third of our power. Overcoming these hurdles could mean the difference between solar leveling off as a niche technology and solar taking over the world. Thanks to a little-discussed phenomenon known as “value deflation,” the electricity generated by solar panels gets less and less valuable as more panels come online. The corollary is that over time, solar panels continuously need to get much, much cheaper if we want them to scale up significantly.
How cheap? Sivaram and Kann argue that the industry should set a goal of pushing the installed price of solar to $0.25 per watt by 2050 — down from around $3 per watt today. That’s a mind-bogglingly low number, and it could require thinking about solar innovation in a radically new way. Current approaches to cutting costs won’t necessarily get us there. We may need experimental new technologies. Or novel ways of integrating solar into our walls and windows. Or robot installers.
____
____
Despite subsidies rooftop solar uptake low: 2023 study in India:
Were all rooftops in India’s estimated 250-300 million households to have solar panels installed, it would amount to 637 gigawatt or about five times the total renewable energy capacity already installed. However, were solar panel installations restricted to account for the electricity actually consumed by households, this would fall 80% to about 118 GW. India currently has about 11 GW of installed rooftop solar capacity, of which only 2.7 GW are in residential units and the rest in commercial or industrial spaces. The government aspired to a target of installing 40GW. India’s low uptake of rooftop solar systems – often touted as the pathway to clean, decentralised electricity –is largely due to limited electricity consumption and existing subsidies for coal-fired electricity that makes even subsidised solar power expensive, suggests the results of a first-of-its-kind study spanning 14,000 households across 21 states. India’s solar energy revolution–going from 2,000 MW of solar power capacity in 2010 to 72,018 MW now–must reach households too to reach its full potential. But to get there, residents must get the right price and attractive incentives and enjoy a convenient experience, which can then spur the markets to create the right products and capacities for homes.
______
______
Section-20
Environmental effects of solar technologies:
Fossil fuels and conventional energy generation processes have dominated the energy supply with coal, crude oil, and natural gas, representing more than 80% of primary energy supply in 2018. Little did we know that the extensive use of such fossil resources was a double-edged sword, which unfortunately has a detrimental damaging effect on the environment. The huge dependence on fossil fuels and massively abusing them in almost all the life sectors have developed a number of dangerous environmental problems, one leading into another such as land drought, heatwaves, wildfires, a rise of sea level, floods, and other extreme climate phenomena.
_
Research has been carried out to find several environmentally friendly and efficient replacements to the conventional energy market, considering their finite sources and their environmental impacts. Significant efforts have been carried out to improve the efficiency of the current energy conversion systems, producing efficient energy conversion systems, and/or relying on renewable energy sources, such as wind energy, solar thermal, solar PV, geothermal, hydro, and biomass energy. A massive part of these efforts has brought renewable energy systems to a level that encouraged developed countries working on transforming their current energy mix to more renewable energies, and calling for a global carbon emission reduction. Huge geopolitical decisions and specifically The Paris Agreement have called for a worldwide reduction of carbon emissions (UNFCC, 2015), but according to the IRENA’s 2017 Climate-Safe Energy Solutions report, to effectively achieve such big goals and sufficiently limit the negative effects on the climate change, complete decarbonization of energy use has to be achieved in less than 50 years. Even though the world’s economy will be tripled by 2060, this cannot be achieved without the renewable energy sources growing at least seven times the current growth rate (IRENA, 2017).
_
Energy Payback Time (EPBT) is the time in years required by the PV system to produce the same amount of energy equal to the energy consumed during its life cycle. A September 2006 joint paper by scientists from Brookhaven National Laboratory, Utrecht University and the Energy Research Center of the Netherlands demonstrates that crystalline silicon PV systems have energy payback times of 1.5 to 2 years for South European locations and 2.7 to 3.5 years for middle-European, while thin film technologies have energy payback times in the range of 1 to 1.5 years in South Europe. Accordingly, life-cycle carbon dioxide (CO2) emissions for PV were estimated to be in the range of 25 to 32 g/kWh.
_
Life-cycle assessment of the emissions produced, together with the land surface impacts of CSP systems, show that they are ideally suited to reduce greenhouse gases (GHG) and other pollutants, without creating other environmental risks or contamination. According to the European Solar Thermal Industry Association, 1 MWh of installed solar thermal power capacity results in the saving of 600 kilograms of CO2. The energy payback time of CSP systems is approximately five months, which compares very favourably with their lifespan of 25 to 30 years.
_
Solar thermal systems provide environmentally friendly heat for household water and space heating. Simple collectors, usually placed on the roof of a house or building, absorb the sun’s energy and transfer the heat. In many climates, a solar heating system can provide a very high percentage (50 to 75 per cent) of domestic hot water energy. Since, on average, water heating accounts for around 30 per cent of a home’s CO2 emissions, a solar water heater can reduce its total emissions by more than 20 per cent. Many countries are encouraging increased use of solar hot water technology. The IEA Heating and Cooling Program in April 2007 calculated that global installed solar thermal capacity reduces CO2 emissions by approximately 30 million tons each year.
_____
_____
Solar Energy benefits the Environment in many ways:
- Carbon emissions & air pollution
- Land use
- Water use
- Mining & material use
- Noise pollution
While solar panels are most often associated with producing very low-emission electricity, but by replacing fossil fuels they also benefit the environment in terms of land use, water use, noise pollution, and materials extraction (aka mining).
_
Let’s start with the environmental benefit that most people associate with solar panels: Reducing carbon emissions.
-1. Carbon emissions of solar vs fossil fuels:
Generating electricity with solar power instead of fossil fuels can dramatically reduce greenhouse gas emissions, including carbon dioxide (CO2). When we burn fossil fuels, we emit greenhouse gasses, leading to global warming and climate change. Climate change already contributes to severe environmental and public health issues, including extreme weather events, rising sea levels, and ecosystem changes. Going solar will shrink your carbon footprint because you’ll create fewer greenhouse gas emissions (including carbon dioxide and methane). One home installing a solar energy system can have a measurable effect on the environment: According to the U.S. Energy Information Administration, the average U.S. household uses 10,632 kilowatt-hours (kWh) of electricity annually. Switching that amount of electricity generation from fossil fuels to solar power has the same emissions reduction effect as planting 125 trees every year or eliminating the annual production of 8,440 pounds of coal.
_
While there are no global warming emissions associated with generating electricity from solar energy, there are emissions associated with other stages of the solar life-cycle, including manufacturing, materials transportation, installation, maintenance, and decommissioning and dismantlement. China is using record amounts of coal to produce the solar panels and wind turbines we use. Most estimates of life-cycle emissions for photovoltaic systems are between 0.07 and 0.18 pounds of carbon dioxide equivalent per kilowatt-hour. Most estimates for concentrating solar power range from 0.08 to 0.2 pounds of carbon dioxide equivalent per kilowatt-hour. In both cases, this is far less than the lifecycle emission rates for natural gas (0.6-2 lbs of CO2E/kWh) and coal (1.4-3.6 lbs of CO2E/kWh).
_
The biggest environmental benefit of solar energy is its incredibly small carbon footprint. According to the International Panel on Climate Change (IPCC), the lifecycle emissions per kWh of electricity produced by rooftop solar are around 41 grams of CO2 equivalent that is:
- Around 12 times less than electricity generated by natural gas (perhaps closer to 20 times less after factoring in methane leaks from natural gas)
- Around 20 times less than electricity generated by coal
The term lifecycle emissions is important because it includes the carbon footprint of manufacturing solar panels (where most of its emissions come from) to decommissioning them at the end of their useful life.
_
Solar energy technologies, such as PV and solar thermal systems, offer significant environmental benefits by reducing greenhouse gas emissions compared with conventional fossil-fuel-based energy sources. A study by Liu et al. assessed the greenhouse gas emissions associated with PV systems. The study found that, over a 30-year period, a PV system with a capacity of 2.4 MW could avoid approximately 32 million metric tons of CO2 emissions, contributing to greenhouse gas reduction and mitigating climate change. Zhang et al., in one of their studies, estimated that PV systems have a global warming potential of approximately 91.95 g of CO2 equivalent per kilowatt-hour (gCO2e/kWh), significantly lower than conventional fossil-fuel-based electricity generation sources.
____
-2. Air pollution reduction by solar:
It’s worth noting that reducing CO2 and other emissions isn’t only about curbing climate change – it’s also about improving the quality of the air that supports life on planet Earth. In fact, a 2023 Air Quality Life Index report found that “air pollution is the greatest external threat to human life expectancy on the planet” and “reducing global PM2.5 air pollution to meet the World Health Organization (WHO) guideline would add 2.3 years onto average human life expectancy.”
One of the most significant solar energy benefits is that it doesn’t release air pollutants because it’s a clean energy source. An analysis by the U.S. Department of Energy (DOE) ‘s National Renewable Energy Laboratory (NREL) found that widespread solar adoption would significantly reduce nitrous oxides, sulfur dioxide, and particulate matter emissions, all of which can cause health problems. NREL found that, among other health benefits, solar power results in fewer chronic bronchitis, respiratory and cardiovascular problems, and lost workdays related to health issues. Hertwich et al. conducted a comparative analysis of air pollution-related impacts between PV and fossil-fuel-based electricity generation. The study estimated that, per unit of electricity generated, PV systems have significantly lower emissions of pollutants, such as sulfur dioxide (SO2), nitrogen oxides (NOx), and particulate matter (PM), leading to improved air quality and human health benefits. Additionally, a study by Suresh et al. examined the environmental impact of a solar thermal power plant compared with a conventional coal-fired power plant. The study showed that the solar thermal power plant had significantly lower emissions of air pollutants, including sulfur dioxide (SO2), nitrogen oxides (NOx), and mercury (Hg), leading to improved air quality and reduced health risks. If you look at the number of deaths due to accidents and air pollution per TWh of energy produced, for solar it is 0.02, and for wind it is 0.04. Just to put things in perspective coal causes 24.62 deaths.
In a nutshell solar energy is a massive environmental upgrade when it comes to reducing the emissions that fuel climate change and improving local air quality.
______
-3. Land use of solar panels:
Land use may sound like an odd environmental benefit of solar energy, especially if you picture sprawling solar farms covering desert landscapes, but a 2022 study by the National Renewable Energy Lab (NREL) found that the land required for all of the solar, wind, and transmission infrastructure to decarbonize the US power sector by 2035 adds up to less than 1% of the available land in the continental US. In fact, it’s less than the area currently being used for railroads and less than half of the land dedicated to active oil and gas leases.
The study doesn’t take into account rooftop solar because… well… rooftop solar doesn’t use any additional land.
Solar has minimal land disturbance. Solar energy systems may be set up on several surfaces, such as parking lots, roofs, and vacant land. Because they don’t need extensive digging or clearing of land, they have less of an impact on ecosystems and natural habitats. We can prevent the erasure of landscapes and the preservation of biodiversity by making use of accessible locations for solar arrays, therefore fostering ecological balance and safeguarding priceless natural resources. On the other hand, mining and prospecting for fossil fuels have the potential to significantly degrade the environment. Surface mining, such as mountaintop removal for coal extraction, causes ecosystems to be destroyed, biodiversity to be lost, and species to be displaced. Similar to how habitat fragmentation and ecosystem disruption from oil and gas drilling may have long-lasting effects on biodiversity and ecosystem services.
And there are several mixed-use applications for solar panels to consider. For example, agrivoltaics is the practice of siting solar panels above crops and livestock areas. This technique has been found to increase certain crop yields by shading plants from intense sunshine and retaining ground moisture, and it also provides a secondary source of income for the hardworking farmers who feed the world. Solar panels are also being installed in urban locations above parking lots, water canals, and bike lanes to simultaneously create shade and clean energy right where it’s needed.
Finally, in a practice known as “floatovoltaics,” solar panels are floated on reservoirs and wastewater treatment plants. The water cools the panels to increase efficiency during peak sun hours, and the panels shade the water to reduce evaporation loss.
______
-4. Water use of solar vs fossil fuels:
In 2019, a review of 32 water use studies found that the median life cycle water consumption of photovoltaic solar is 330 liters per megawatt-hour of electricity, which boils down to a third of a liter of water per kilowatt-hour (kWh) of solar electricity – or just under 12 fluid ounces.
How does that compare to other types of electricity generation? Solar energy uses:
- Half of the water of gas-fired power plants
- Seven times less water than nuclear and coal power plants
Table below compares water use of solar vs other electricity sources:
|
ENERGY SOURCE |
LIFE CYCLE WATER CONSUMPTION PER MWH OF ELECTRICITY |
|
Oil |
3,220 Liters |
|
Nuclear |
2,290 Liters |
|
Coal |
2,220 Liters |
|
Natural gas |
598 Liters |
|
Photovoltaic solar |
330 Liters |
|
Wind |
43 Liters |
Just like emissions and land use, solar and wind are far better for the environment in terms of water use.
______
-5. Mining and material use:
Mining for materials is often seen as a blemish on the environmental impact of solar, and there’s no doubt that mining for the silicon, aluminium, copper, and silver used to manufacture solar panels is environmentally problematic. That’s something the solar industry has to own up to and improve on.
But it’s also worth zooming out a bit.
In 2023, data scientist Hannah Ritchie crunched the numbers on the total mining needs for a clean energy transition and found that to rapidly transition to a clean energy economy, we’d need to scale “low-carbon” energy mining up to 28 million tons of materials per year – about 7 times the amount we’re currently extracting. That sounds like a lot of mining… until you weigh it against the 15 billion tons of coal, oil, and natural gas currently being mined each year by the fossil fuel industry. Yes, that is around 535 times more than the total mining tonnage required for a clean energy economy as seen in the figure below.
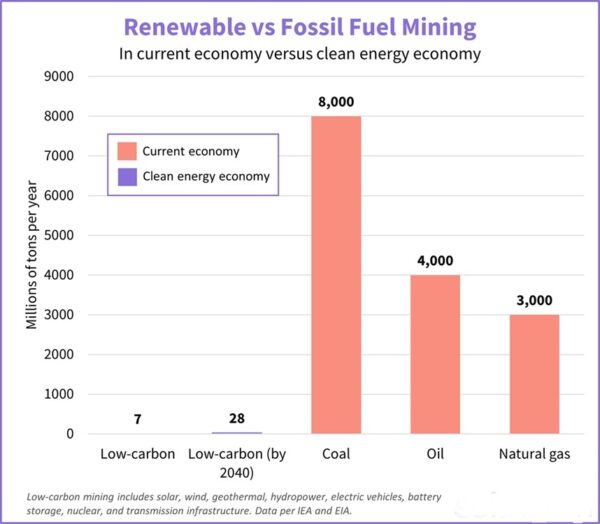
It’s also worth noting that mining for solar is just one part of the 28 million tons of minerals needed for low-carbon energy resources, which includes materials for wind, hydro, EVs, batteries, nuclear, and transmission infrastructure.
How can fossil fuels require so much more mining than low-carbon energy sources? It boils down to how efficiently these materials are used. The key difference between mining materials for solar energy and fossil fuel energy is that with solar you are using the materials solely to build infrastructure, while with fossil fuels you are mining for infrastructure and fuel. Theoretically, all the materials mined to build energy infrastructure can be recycled. However, it’s virtually impossible to recycle coal, oil, and gas once it has been burned and released into the atmosphere. While there’s a lot to be desired from solar panel recycling (and the end-life of oil wells, for that matter), fossil fuels have an insatiable appetite for mined fuels that far outweighs the material needs for renewable energy.
_____
-6. Noise pollution reduction by solar:
We’ve covered how solar energy is better for the environment than fossil fuels in terms of air, land, water, and mining. But perhaps the most overlooked environmental benefit of solar energy is that it’s quiet. Noise pollution is linked to stress related illnesses, high blood pressure, speech interference, hearing loss, sleep disruption, and lost productivity. Like any energy source, there is noise associated with manufacturing and installing solar panels. However, with no moving parts or combustion, solar panels themselves are virtually noiseless except for a soft hum from the inverter, which is capped at 45 decibels (about the volume of a quiet room) and only occurs during the day.
Meanwhile, coal and natural gas power plants generate, on average, 80-85 decibels – somewhere between a vacuum cleaner and city traffic – which can negatively impact workers and the surrounding community. For example, the Ellwood gas power plant in Santa Barbara County, Cali. is located within 200 feet of school property, where noise levels from the plant can contribute 60-64 decibels.
Not only are solar panels quieter than fossil fuels, they can actually help mitigate noise pollution. There are pilot programs for using solar panels as clean-energy-producing noise barriers along roadways to reduce the noise pollution from cars powered by fossil fuels.
______
______
Adverse Impact of solar energy on environment:
Does solar energy have its downsides? Absolutely. Solar panels often contain trace amounts of heavy metals which can be harmful if not properly handled, sprawling solar farms can disrupt wildlife habitats, and solar panel recycling leaves a lot to be desired. But don’t let perfect be the enemy of good. Solar energy has a much, much smaller impact on the environment than fossil fuels in many ways.
Utility-scale solar energy environmental considerations include land disturbance/land use impacts; potential impacts to specially designated areas; impacts to soil, water and air resources; impacts to vegetation, wildlife, wildlife habitat, and sensitive species; visual, cultural, paleontological, socioeconomic, and environmental justice impacts, and potential impacts from hazardous materials.
-1. Land Disturbance/Land Use Impacts:
All utility-scale solar energy facilities require relatively large areas for solar radiation collection when used to generate electricity at utility-scale (defined for the Solar Programmatic Environmental Impact Statement (PEIS) as facilities with a generation capacity of 20 MW or greater). Solar facilities may interfere with existing land uses, such as grazing, wild horse and burro management, military uses, and minerals production. Solar facilities could impact the use of nearby specially designated areas such as wilderness areas, areas of critical environmental concern, or special recreation management areas. Proper siting decisions can help to avoid land disturbance and land use impacts.
-2. Impacts to Soil, Water, and Air Resources
Construction of solar facilities on large areas of land requires clearing and grading, and results in soil compaction, potential alteration of drainage channels, and increased runoff and erosion. Engineering methods can be used to mitigate these impacts.
Parabolic trough and central tower systems typically use conventional steam plants to generate electricity, which commonly consume water for cooling. In arid settings, any increase in water demand can strain available water resources. CSP plants that use wet-recirculating technology with cooling towers withdraw between 600 and 650 gallons of water per megawatt-hour of electricity produced. CSP plants with once-through cooling technology have higher levels of water withdrawal, but lower total water consumption (because water is not lost as steam). Dry-cooling technology can reduce water use at CSP plants by approximately 90 percent. However, the trade-offs to these water savings are higher costs and lower efficiencies. In addition, dry-cooling technology is significantly less effective at temperatures above 100 degrees Fahrenheit. Use of or spills of chemicals at solar facilities (for example, dust suppressants, dielectric fluids, herbicides) could result in contamination of surface or groundwater.
The construction and operation of solar facilities generates particulate matter, which can be a significant pollutant particularly in any nearby areas classified as Class I under Prevention of Significant Deterioration regulations (such as national parks and wilderness areas).
-3. Ecological Impacts
The clearing and use of large areas of land for solar power facilities can adversely affect native vegetation and wildlife in many ways, including loss of habitat; interference with rainfall and drainage; or direct contact causing injury or death. The impacts are exacerbated when the species affected are classified as sensitive, rare, or threatened and endangered.
-4. Hazardous materials
The PV cell manufacturing process includes a number of hazardous materials, most of which are used to clean and purify the semiconductor surface. These chemicals, similar to those used in the general semiconductor industry, include hydrochloric acid, sulfuric acid, nitric acid, hydrogen fluoride, 1,1,1-trichloroethane, and acetone. The amount and type of chemicals used depends on the type of cell, the amount of cleaning that is needed, and the size of silicon wafer. Workers also face risks associated with inhaling silicon dust.
Photovoltaic panels may contain hazardous materials, and although they are sealed under normal operating conditions, there is the potential for environmental contamination if they were damaged or improperly disposed upon decommissioning. Concentrating solar power systems may employ materials such as oils or molten salts, hydraulic fluids, coolants, and lubricants, that may be hazardous and present spill risks. Proper planning and good maintenance practices can be used to minimize impacts from hazardous materials.
Thin-film PV cells contain a number of more toxic materials than those used in traditional silicon photovoltaic cells, including gallium arsenide, copper-indium-gallium-diselenide, and cadmium-telluride. If not handled and disposed of properly, these materials could pose serious environmental or public health threats. However, manufacturers have a strong financial incentive to ensure that these highly valuable and often rare materials are recycled rather than thrown away.
-5. Other Impacts
Because they are generally large facilities with numerous highly geometric and sometimes highly reflective surfaces, solar energy facilities may create visual impacts; however, being visible is not necessarily the same as being intrusive. Aesthetic issues are by their nature highly subjective. Proper siting decisions can help to avoid aesthetic impacts to the landscape.
Cultural and paleontological artifacts and cultural landscapes may be disturbed by solar facilities. Additionally, socioeconomic impacts (both positive and negative) may be associated with solar facilities. For example, solar energy development could provide new employment opportunities, but an influx of workers could disrupt public services. These impacts may be disproportionately experienced by minority or low-income populations, thus resulting in environmental justice issues.
Concentrating Solar Power (CSP) systems could potentially cause interference with aircraft operations if reflected light beams become misdirected into aircraft pathways. Operation of solar facilities, and especially concentrating solar power facilities, involves high temperatures that may pose an environmental or safety risk.
_____
_____
Solar Panels reduce CO2 Emissions more per acre than Trees:
In the United States, the emissions intensity of electricity produced by natural gas-fired power plants is about 1,071 pounds per megawatt-hour (MWh) on a lifecycle basis, whereas the emissions intensity of solar PV is about 95 pounds per MWh, a difference of 976 pounds per MWh. According to the Lawrence Berkeley National Laboratory, utility-scale solar power produces between 394 and 447 MWh per acre per year. Thus, when solar panels are installed to replace natural gas, an acre of solar panels saves approximately 385,000 to 436,000 pounds, or 175 to 198 metric tons, of carbon dioxide per year. By comparison, according to the EPA, the average acre of forest in the United States sequesters 0.84 metric tons of carbon dioxide per year. Thus, an acre of solar panels installed to replace natural gas reduces approximately 208 to 236 times more carbon dioxide per year than an acre of forest.
_
What about the carbon that is released when an acre of forest is removed? According to the EPA, the average acre of forest contains 81 metric tons of carbon, although the exact figure depends heavily on the species of trees in the forest. Approximately half of that amount is sequestered in the soil. Even if all 81 metric tons of carbon, comprising 297 metric tons of carbon dioxide, were released upon conversion to a solar farm, those emissions would be offset within 2 years of operation.
_
Replacing cornfields with solar panels:
An acre of corn could absorb roughly 36,000 pounds of carbon dioxide in a year that contains about 9,800 pounds of carbon. On the other hand, solar technology helps prevent carbon dioxide emissions from being released in the first place. It provides a substitute energy source for greenhouse gas-emitting fossil fuels. Different regions have different weather patterns and rely on different proportions of natural gas, coal, nuclear and renewable energy. Each solar installation is unique, too. So, the precise CO2 mitigation potential of one acre of solar panels is different according to different regions and different type of conventional fuel being replaced. Accordingly Solar panels can prevent an estimated 70 to 300 metric tons of CO2 from being released per acre per year when installed to replace fossil fuel; far greater than 36,000 pounds (16 metric ton) of CO2 absorbed by corn per acre per year.
_
Importantly, converting the land currently used for growing corn ethanol to solar energy would greatly increase the amount of energy produced on that land. In total, more than 30 million acres of farmland, covering an area roughly the size of Louisiana, are effectively used to grow corn for ethanol in the U.S. An analysis from PV Magazine recently found that converting the land currently used for corn ethanol to solar power could meet all of the U.S. electricity needs. Likewise, a UK-based analysis from Carbon Brief found that “a hectare of solar panels delivers between 48 and 112 times more driving distance, when used to charge an electric vehicle, than that land could deliver if used to grow biofuels for cars.”
Note that solar power produces between 394 and 447 megawatt hours (MWh) per acre per year. One acre of corn produces approximately 551 gallons of ethanol per year. With a heat content of 21 MJ/liter, 551 gallons of ethanol contains 551 X 3.7 X 21 = 42812.7 MJ of energy. Applying a standard conversion factor 3,600 megajoules = one megawatt-hour, one acre of corn produces a quantity of ethanol equivalent to 11.89 MWh. Thus, an acre of solar panels produces roughly 33 to 37 times more energy per acre than corn ethanol, even assuming a relatively high output per acre of corn.
_____
_____
Life cycle analysis (LCA) of solar technologies:
Life-cycle analysis (LCA) studies provide a comprehensive assessment of the environmental impacts associated with the entire life cycle of solar energy technologies, including PV technologies, solar thermal systems, and energy storage solutions.
LCA can help determine environmental burdens from “cradle to grave” and facilitate comparisons of energy technologies. Comparing life cycle stages and proportions of GHG emissions from each stage for PV and coal shows that, for coal-fired power plants, fuel combustion during operation emits the vast majority of GHGs. For PV power plants, the majority of GHG emissions are upstream of operation in materials and module manufacturing as seen in the figure below.
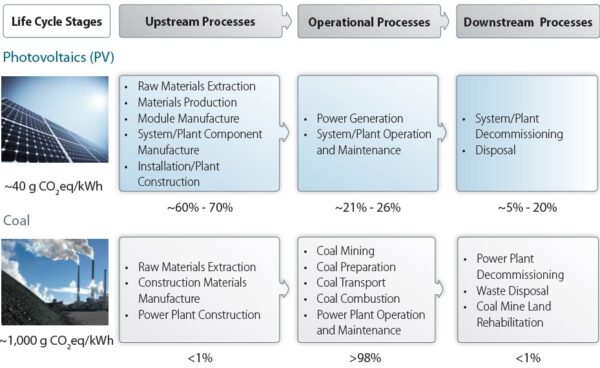
_____
_____
Figure below shows greenhouse gas emissions per energy source.
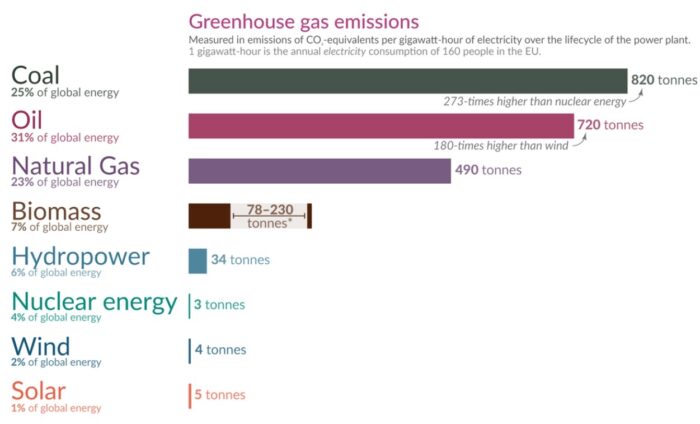
Solar power is one of the sources with the least greenhouse gas emissions. Solar power is cleaner than electricity from fossil fuels, so better for the environment. Solar power does not lead to harmful emissions during operation, but the production of the panels creates some pollution. A 2021 study estimated the carbon footprint of manufacturing monocrystalline panels at 515 g CO2/kWp in the US and 740 g CO2/kWp in China, but this is expected to fall as manufacturers use more clean electricity and recycled materials. Solar power carries an upfront cost to the environment via production with a carbon payback time of several years as of 2022, but offers clean energy for the remainder of their 30-year lifetime.
_
The life-cycle greenhouse-gas emissions of solar farms are less than 50 grams of carbon dioxide equivalent per kilowatt-hour, but with battery storage could be up to 150 g/kWh. In contrast, a combined cycle gas-fired power plant without carbon capture and storage emits around 500 g/kWh, and a coal-fired power plant about 1000 g/kWh. Similar to all energy sources where their total life cycle emissions are mostly from construction, the switch to low carbon power in the manufacturing and transportation of solar devices would further reduce carbon emissions.
______
Table below includes the median values for four life cycle phases (one-time upstream (e.g., materials acquisition and plant construction), ongoing combustion (where applicable), ongoing noncombustion (e.g., operation and maintenance), and one-time downstream (e.g., plant decommissioning and disposal/recycling)) as well as a total life cycle emissions factor. These results show that total life cycle GHG emissions from renewables and nuclear energy are much lower and generally less variable than those from fossil fuels. For example, from cradle to grave, coal-fired electricity releases about 20 times more GHGs per kilowatt-hour than solar, wind, or nuclear electricity (based on median estimates for each technology).
Median Published Life Cycle Emissions Factors for Electricity Generation Technologies, by Life Cycle Phase 2021:
|
Generation Technology |
One-Time Upstream |
Ongoing Combustion |
Ongoing Non Combustion |
One-Time Downstream |
Total Life Cycle |
|
Biomass |
NR |
— |
NR |
NR |
52 |
|
Photovoltaica |
~28 |
— |
~10 |
~5 |
43 |
|
Concentrating Solar Powerb |
20 |
— |
10 |
0.53 |
28 |
|
Geothermal |
15 |
— |
6.9 |
0.12 |
37 |
|
Hydropower |
6.2 |
— |
1.9 |
0.004 |
21 |
|
Ocean |
NR |
— |
NR |
NR |
8 |
|
Windc |
12 |
— |
0.74 |
0.34 |
13 |
|
Pumped- storage hydropower |
3.0 |
— |
1.8 |
0.07 |
7.4 |
|
Lithium-ion battery |
32 |
— |
NR |
3.4 |
33 |
|
Hydrogen fuel cell |
27 |
— |
2.5 |
1.9 |
38 |
|
Nucleard |
2.0 |
— |
12 |
0.7 |
13 |
|
Natural gas |
0.8 |
389 |
71 |
0.02 |
486 |
|
Oil |
NR |
NR |
NR |
NR |
840 |
|
Coal |
<5 |
1010 |
10 |
<5 |
1001 |
Notes for Table above:
All values are in grams of carbon dioxide equivalent per kilowatt-hour (g CO2e/kWh)
a Thin film and crystalline silicon
b Tower and trough
c Land-based and offshore
d Light-water reactor (including pressurized water and boiling water) only
NR = Not Reported.
CO2e means carbon dioxide equivalent. CO2e is a measurement of the total greenhouse gases emitted, expressed in terms of the equivalent measurement of carbon dioxide.
Note that because different numbers of references may be used in the calculation of each entry in Table above, the sum of the median estimates of each life cycle phase for a given generation technology might not equal the median of the total life cycle emissions factors (the sum of the medians need not equal the median of the sums). Indeed, the sum of the individual phase median values may be greater than the median total, as is the case with concentrating solar power.
______
______
Life cycle greenhouse gas emissions and energy footprints of utility-scale solar energy systems, 2022 study:
Grid-connected utility-scale solar PV has emerged as a potential pathway to ensure deep decarbonization of electricity in regions with fossil fuel-dominated energy mixes. Research on utility-scale solar PV projects mainly focuses on assessing technical or economic feasibility. Environmental performance assessments of large-scale solar applications are scarce. There is limited information on the greenhouse gas (GHG) emissions and energy footprints of utility-scale solar energy systems. Earlier studies conducted on small-scale solar systems have limited application in the grid system. Authors developed a comprehensive bottom-up life cycle assessment model to evaluate the life cycle GHG emissions and energy profiles of utility-scale solar photovoltaic (PV) system with lithium-ion battery storage to provide a consistent electricity supply to the grid with peak load options. Authors conducted a case study for a fossil fuel-based energy jurisdiction, Alberta (a western province in Canada). The results of the energy assessment show that raw material extraction, production, and assembly of solar panels are the key drivers, accounting for 53% of the total consumption. Energy consumed during battery manufacturing is responsible for 28%. The system shows a net energy production with a mean net energy ratio as high as 6.6 for two-axis sun tracking orientation. The life cycle GHG emissions range from 98.3 to 149.3 g CO2 eq /kWh with a mean value of 123.8 g CO2 eq /kWh. The largest emissions contribution is due to the manufacturing of batteries, 54% of the total emissions. The solar PV system offers a mean energy payback time of 3.8 years (with a range of 3.3 to 4.2 years). The results are highly sensitive to the expected lifetime of the system, the panel’s peak wattage, and process energy consumption at various life cycle stages.
______
______
Waste and recycling:
Solar energy is a rapidly growing market, which should be good news for the environment. Unfortunately there’s a catch. The replacement rate of solar panels is faster than expected and given the current very high recycling costs, there’s a real danger that all used panels will go straight to landfill. Regulators and industry players need to start improving the economics and scale of recycling capabilities before the avalanche of solar panels hits. There were 30 thousand tonnes of PV waste in 2021, and the annual amount was estimated by Bloomberg NEF to rise to more than 1 million tons by 2035 and more than 10 million by 2050. For comparison, 750 million tons of fly ash waste was produced by coal power in 2022. In the United States, around 90% of decommissioned solar panels end up in landfills as of 2023. Most parts of a solar module can be recycled including up to 95% of certain semiconductor materials or the glass as well as large amounts of ferrous and non-ferrous metals. Some private companies and non-profit organizations take-back and recycle end-of-life modules. EU law requires manufacturers to ensure their solar panels are recycled properly. Similar legislation is underway in Japan, India, and Australia. A 2023 Australian report said that there is a market for quality used panels and made recommendations for increasing reuse.
_
Recycling possibilities depend on the kind of technology used in the modules:
- Silicon based modules: aluminium frames and junction boxes are dismantled manually at the beginning of the process. The module is then crushed in a mill and the different fractions are separated – glass, plastics and metals. It is possible to recover more than 80% of the incoming weight. This process can be performed by flat glass recyclers, since the shape and composition of a PV module is similar to flat glass used in the building and automotive industry. The recovered glass, for example, is readily accepted by the glass foam and glass insulation industry.
- Non-silicon based modules: they require specific recycling technologies such as the use of chemical baths in order to separate the different semiconductor materials. For cadmium telluride modules, the recycling process begins by crushing the module and subsequently separating the different fractions. This recycling process is designed to recover up to 90% of the glass and 95% of the semiconductor materials contained. Some commercial-scale recycling facilities have been created in recent years by private companies.
Since 2010, there is an annual European conference bringing together manufacturers, recyclers and researchers to look at the future of PV module recycling.
_____
_____
Sustainability of photovoltaic technologies in future net-zero emissions scenarios, 2022 study:
Photovoltaic installed cumulative capacity reached 849.5 GW worldwide at the end of 2021, and it is expected to rise to 5 TW by 2030. The sustainability of this massive deployment of photovoltaic modules is analysed in this study. A literature review, completed with author’s own research for emerging technologies has been carried out following life cycle assessment (LCA) methodology complying with ISO 14040 and ISO 14044 standards. Different impact categories have been analysed for five commercial photovoltaic technologies comprising more than 99% of current market (crystalline silicon ~94% and thin film ~6%) and a representative of an emerging technology (hybrid perovskite). By using data from LCA inventories, a quantitative result for 15 impact categories has been calculated at midpoint and then aggregated in four endpoint categories of damage following ReCiPe pathways (global warming potential, human health damage, ecosystems damage and resources depletion) in order to enable a comparison to other renewable, fossil fuel and nuclear electricity production. In all categories, solar electricity has much lower impacts than fossil fuel electricity. This information is complemented with an analysis of the production of minerals with data from the British Geological Survey; the ratio of world production to photovoltaic demand is calculated for 2019 and projected to 2030, thus quantifying the potential risks arising from silver scarcity for c-Si technology, from tellurium for CdTe technology and from indium for CIGS and organic or hybrid emerging technologies. Mineral scarcity may pose some risk for CdTe and CIGS technologies, while c-Si based technology is only affected by silver dependence that can be avoided with other metals replacement for electrodes. When the risks grow higher, investment in recycling should boost the recovery ratio of minerals and other components from PV module waste.
_____
_____
Section-21
Solar versus other energy sources:
_
Solar vs fossil fuel:
When comparing solar energy to fossil fuels, the following are key factors to be compared.
-1. Amount of emissions
-2. Renewability
-3. Availability and cost
_
-1. Amount of Emissions:
Emissions released during the production and supply of energy enable us to figure out how clean the resource is. In the case of fossil fuels, emissions are released during the mining process when raw fossil fuels, such as coal, petroleum, and natural gas are mined or drilled from the Earth. They also release carbon dioxide during the combustion process when these fuels are burnt. Emissions released from fossil fuels like carbon dioxide and sulfur dioxide are the major cause of global warming and pollution.
Comparatively, the emissions from solar energy production are considerably low. Emissions of solar panels are released during silicon mining only. Once solar panels are manufactured, there is minimal or no pollution. If we compare both scenarios, the disastrous emissions of fossil fuels are highly risky, and solar energy is a clear winner in the race of energy resources. Undoubtedly, solar panels are a clean and renewable energy source! Once you install the solar panel, you make Earth free from loads of harmful emissions.
-2. Renewability
The next factor is renewability. A renewable energy source is one that is infinite and will never run out. Non-renewable energy resources are finite and will eventually run out. Fossil fuels are non-renewable; therefore, they will not last forever. Though much of the world’s energy is created by burning fossil fuels, these natural resources are formed from the remains of plants and animals that died. If fossil fuels are gone, they cannot be substituted. Therefore, it is better to use renewable energy resources, instead of fossil fuels.
Solar energy is a renewable and never-ending energy resource because it is empowered by the Sun. This means that solar energy will never run out till the sun is shining. The demand for solar panels is increasing rapidly due to the availability of renewable features.
-3. Availability and Cost
Availability and cost are critical factors that are, in a way, linked to one another. Fossil fuels are readily available in most countries and cheap. But sunlight is free and what is determining the cost of solar power is the cost of the power plant, the cost of the technology itself. Solar electricity got so cheap because solar technology got cheap. All you need to do is make sure you achieve a return on your initial investment (ROI). This depends on where you live. If you live in region with bright, sharp sunlight available throughout the day, you are covered!
Table below features various cost-related aspects of solar energy and fossil fuels.
|
Aspect |
Solar Energy |
Fossil Fuels |
|
Upfront expenses |
High |
Low |
|
Power expenses (after 5 years) |
Low |
Variable |
|
Lifetime cost |
Lower |
High |
|
Maintenance cost |
Low |
Variable |
|
Government incentives |
Available |
Available |
______
______
If solar energy is cheaper than coal, why isn’t coal replaced with solar energy in the energy sector?
The reasons fossil fuel still burns for generating electricity are:
-1. Electricity demand is climbing with electrification:
This raises the value of coal-based electricity generation and all sources of electricity. We need more solar to replace fossil fuels, but we can’t close fossil fuels because there are not enough solar. More solar now but they are non-dispatchable, so we need to continue with dispatchable fossil fuels running to make power consistent, that makes solar less desirable. People tend to need lots of electricity at sun-down. This makes fossil fuels more important since they can generate at this time period. Most dispatchable peak demand is met with gas or diesel generators, which the U.S. runs between $179-$230/MWh or $297-$332, respectively. Without storage, solar leaves much to be desired in terms of meeting the dispatch characteristics necessary to serve as a peaking technology.
-2. Enhance economic growth to alleviate poverty:
For the world’s large, emerging industrial nations — such as China, India, Bangladesh and Indonesia — reliance on coal is an inescapable fact of life. Last year, China got more additional power from coal than it did from wind and solar. India got three times as much, whereas Bangladesh got 13 times more coal electricity than it did from green energy sources, and Indonesia an astonishing 90 times more. Reliability matters — especially when they’re focused on growing an economy and helping millions of people to escape poverty. That is why they subsidises fossil fuel electricity.
The mistruth about the cost of wind and solar is possible because typically, the price that is quoted is the price when the wind is blowing or the sun is shining. On that basis, they are indeed comparatively cheap even without subsidy. But once you include the cost of reliability, the price tag explodes — one peer-reviewed study shows an increase somewhere between 11 and 42 times, which makes solar by far the most expensive source of electricity, followed by wind. Storage technology remains woefully inadequate. Recently, scientists looked at the United States and found that to achieve reliable, 100% solar or wind electricity, we’d need the ability to store nearly three months’ worth of annual electricity. The United States has only seven minutes of battery storage. Closing the storage gap would cost five times the entire U.S. GDP, and the storage would need to be replaced every 15 years.
-3. Location makes a difference:
Because of the curve of the Earth a sunbeam of Insolation hitting the Earth at higher latitudes has to spread out over a larger surface area than one reaching the Equator, thus lowering the amount of Insolation. It is no surprise that solar is not going to work everywhere equally well. Even by Solar’s low standards of versatility and reliability, they perform poorly in most locations. Yet the sunniest areas are used to make general rosy claims about solar. Every use of energy takes place in a certain location and was produced by processes taking place in another location. Location always affects the cost of energy. E.g., nearby or piped natural gas is often the cheapest solution while ocean-transported gas often isn’t. Because location has such a significant effect on the price of energy, one must be cautious in generalizing from a source of energy being cheapest in one location to it being cheapest everywhere. E.g., natural gas power has often been cheaper than coal in the US but not in Asia. Solar is incredibly location-sensitive. Although nowhere do they have the reliability of fossil fuels, let alone versatility, they perform at their best in consistently sunny (e.g., desert-like areas including Southern California). While most forms of energy are highly location-sensitive in where they originate (e.g., many places lack oil and coal), many are dense enough that they can be transported fairly easily to most places around the world. But not sunlight as it is not portable fuel. Transporting solar electricity from source to consumption often requires expensive, long-distance transmission lines that involve a lot of investment and that lose significant energy over distance. Since utility scale solar power plants are far away from consumption areas and since solar is not portable like coal, we will have to build new grids which takes time as seen in the figure below.
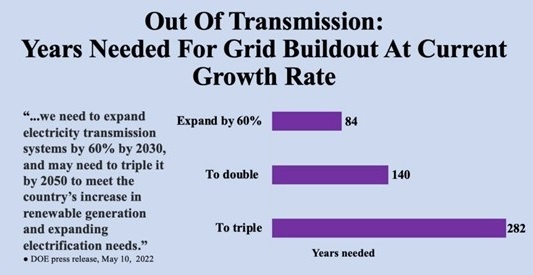
But the story does not stop here. The costs of solar development vary to some degree regionally, and public policy such as feed-in tariffs and subsidies largely determine where solar is most economically viable.
______
______
Solar vs wind:
When it comes to the various renewable sources of energy, it’s safe to say that everyone is a winner compared to fossil fuel energy in both the short and long run. Between solar and wind energies, the answer depends on where they are being utilized. Solar Energy can operate with practically zero hindrance in places with ample sunlight throughout the year. On the other hand, wind turbines require environments that are almost completely barren of large windbreaks and barrens. This is exactly why most windmills are installed away from urban areas. Solar Panels are relatively cheaper and come with significantly less maintenance cost compared to wind turbines when it comes to setup costs.
_
Modern wind turbines are a testament to human ingenuity and technological prowess. But they are also massive installations with many moving parts often exposed to harsh conditions — offshore wind in particular. Solar technologies are elegantly simple in comparison. Solar energy technologies are going to become increasingly favored over wind technologies. Sure, wind will continue to have a role in the global energy mix, but that role as a proportion of global electricity generation will soon be dwarfed by solar. Arguably, the data on global electricity generation shows that trend is already underway, as shown in figure below.
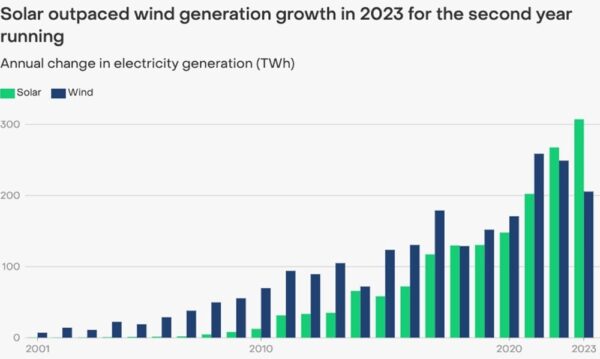
For the second year in a row, global growth in solar PV generation capacity outpaced that of wind in 2023, according to energy think tank Ember. Solar PV’s generation growth in 2024 is forecast to be even faster than in 2023. Ember’s fifth annual Global Electricity Review revealed that solar generation grew by 23% in 2023, the fastest-growing electricity source for 19 years in a row. With 1,631TWh, solar PV accounted for 5.5% the global electricity mix, up from 4.6% in 2022. Solar’s generation growth in 2024 is expected to be even larger due to a record surge of installations towards the end of 2023.
_
When compared with wind energy, solar energy offers several obvious advantages, such as:
-1. Between the two, solar energy provides a more steady and predictable energy outcome.
-2. The energy production in a typical photovoltaic power station is much higher than a series of windmills.
-3. Compared to the bulky and massive blades used in wind turbines, solar panels can be conveniently placed in almost any open space with direct sunlight availability.
-4. Solar panels essentially operate without creating any sound. On the other hand, wind turbines have a constant noise coming out of the rotor blades.
There are some advantages that wind energy has over solar power.
-1. Wind turbines can generate energy even during the night, whereas solar cells need sunlight for energy generation and work only during the day.
-2. In places where there is a constant flow of wind throughout the year, wind turbines can work as a very sustainable and uninterrupted source of energy.
_
In the United States, most homeowners have historically preferred to use rooftop solar panels as a sustainable energy option to power their homes, while an increasing number of commercial entities are moving toward large-scale wind farms. The one benefit of wind over solar for your home is that wind turbines can generate power 24 hours a day since they aren’t dependent on sunlight. A single wind turbine can generate the same amount of electricity in kWh (or kilowatt-hours) as thousands of solar panels. So technically, wind power is more efficient than solar panels, but it is not as easy to capitalize on wind resources as it is to utilize the sun’s energy. Wind would make sense for homeowners only if they have a large plot of land and live in an area with a lot of wind that can power the turbines. Weather is still a challenge for both wind and Solar power. Even with clouds, the Solar Panels will generate electricity, unlike wind turbines which won’t make any power with no or weak wind blowing.
_
The Efficiency of Solar and Wind Power:
A study by the International Renewable Energy Agency (IRENA) found that wind turbines generate 59.3% of the energy the wind captures. In comparison, solar panels turn out only 23% of the energy sunlight supplies them. It means wind power is more efficient than solar. Wind speed and solar irradiance are the two factors that define the output of wind and solar power. That means everything boils down to your geographical location.
However, both sunlight and wind are free fuels, hence installation cost per watt is a better metric. Solar panels cost roughly $2.19 per watt to install for commercial purpose but it may be $ 1/watt for large PV power plant, while wind power costs around $1.50 per watt. Wind turbines have a lifespan of about 20 years while solar panels 30 years. The levelised cost of electricity (LCOE) of onshore wind is USD 0.033/kWh, offshore wind 0.081/kWh and solar 0. 049/kWh in 2022. The life-cycle greenhouse-gas emissions of solar farms are less than 50 grams of carbon dioxide equivalent per kilowatt-hour without battery storage while for wind less than 25 gms/kWh offshore and less than 12 gms/kWh onshore.
_
Location:
Both wind turbines and solar panels have specific locations where they will have more advantages. Wind turbines aren’t a good choice for populated areas. The wind in urban and suburban areas is highly affected by buildings, trees and other obstacles. This often results in poorer energy production. Compared with solar power, wind farms require a vast area to be installed. Its manufacturing products, such as blades, foils, and rotors, are expensive. Besides, wind farms can be set up only in areas that have high wind speeds. Also, the typical residential wind turbine towers around 80 feet, therefore it would only make sense for homeowners on large parcels of land located in rural, windy regions. The Solar power system is less space-consuming and can be installed on the rooftops of houses, buildings, businesses. Solar power is usually the best choice for urban and suburban areas. Solar panels and wind turbine installation costs vary across different geographical locations pertaining to the amount of power generated by the sun and wind speed. The closer you are to the equator, the more sunlight you will receive. Similarly, the closer you are to the water bodies, the more wind you will receive. Hence, areas located near these places will cost less than the other areas. Onshore wind power refers to wind turbines constructed and situated on land. Offshore wind power refers to wind farms built on shallow bodies of water, usually in the ocean. So, offshore wind farms are the most effective compared to the onshore. But setting up an offshore wind farm and transmitting power to substations and grids is more than just feasible as opposed to solar
_
Upfront and ongoing cost:
The upfront cost of setting up a solar panel is higher than the ongoing cost because solar panels have a lifetime of 30 years. Their maintenance work involves cleaning the panels and batteries only. So, the maintenance cost is less. Considering the same for wind turbines, the upfront and the ongoing cost of wind turbines are both higher. The manufacturing products of wind turbines are expensive, and it does not stop there. Wind turbines have to be maintained regularly. If there are any faults, the replacement of parts costs a fortune.
_____
_____
Solar vs nuclear:
Nuclear energy taps into the heat released from fission reactions to make electricity. Fission splits large atomic nuclei into smaller nuclei, releasing energy in the process. Nuclear power plants control and sustain fission reactions to heat water into steam, which then spins turbines to generate power. Nuclear power provides steady large-scale baseline electricity with minimal greenhouse gases when reactors are running. The super high energy density of uranium fuel, we’re talking 2-4 million times more than fossil fuels, allows huge power output. Nuclear plants can crank out energy nonstop at multi-gigawatt levels. They churn out 10-30 times more energy yearly per unit of mass than coal or gas. Also, total carbon emissions stack up well against wind and solar. This makes nuclear a consistent carbon-free source, complementing intermittent renewables.
But nuclear energy faces challenges about safety, radioactive waste, and public perception. Complex reactor designs are needed to contain radiation and prevent meltdowns. While next gen reactors boost safety, past accidents have damaged the industry’s reputation big time. Additionally, nuclear waste stays radioactive for thousands of years, needing long-term disposal plans.
Regarding sustainability, total carbon emissions are low for both sources. But the limit for solar is materials availability, while nuclear is constrained by uranium abundance. Solar requires lots of land area, from which wildlife habitats and ecosystems may need protecting. Nuclear’s land usage is compact but its radioactive waste remains a major concern.
_
Solar power vs nuclear power is an interesting comparison, because they have one important thing in common: they are both carbon neutral. Just like solar, nuclear power is carbon neutral and does not contribute to climate change. However, that’s where the similarities between solar and nuclear end. It is natural, when considering global warming solutions and renewable energy options, to ask: Is nuclear better than solar or vice versa.
_
-1. Financial cost of Nuclear Energy vs Solar Energy:
Nuclear is by far the most expensive source of energy out of all the power options available. Its cost is often broken down into capital costs and operating costs. Capital costs include things such as the preparation of the site, engineering, manufacturing, construction, commissioning and financing. Operating costs include the costs of uranium mining and fuel fabrication, maintenance, decommissioning, and waste disposal. The capital cost of nuclear power is much higher than for solar power and the annual cost of repaying the initial investment is much higher than the annual operating costs.
Why is nuclear power so expensive?
Because nuclear power plants are technically complex and must satisfy strict design requirements, and its construction requires a lot of very highly qualified specialists and often take many years. Design changes and lawsuits can also increase the financing charges (which in some cases exceed the actual construction costs!) It’s also difficult to predict the cost of a project, because it is very common for nuclear power plants to have “unexpected” additional costs. A big example of this financial challenge is the 2 unfinished nuclear reactors in South Carolina that were abandoned in 2017 because of difficulties with equipment manufacturing, big construction delays and cost overruns. There are 2 identical reactors under construction in the state of Georgia but their original cost estimate of $14 billion has risen to $23 billion and the only reason it hasn’t been abandoned is because the U.S. government has provided extraordinary financial support for these reactors.
Solar Energy cost:
Multiple studies have concluded that Solar Energy is the cheapest renewable energy solution. But it’s also cheaper than coal and gas! In addition, the cost of solar is getting cheaper every year. Solar manufacturers are developing panels that are much cheaper to produce while being more effective, and the most expensive element of solar energy (storage) is getting cheaper every year in a drastic way with improvement in the battery technology, which means that solar energy will only be getting more affordable in the future.
Nuclear Power is nearly 10 times more expensive vs solar to build on a cost per KW basis. An Australian study by CSIRO concluded the following cost in dollar per kilo Watt ($/kW)
Nuclear (SMR): $16,000/kW
Large Scale Solar: $1,349/kW
The most recent Levelized Cost of Energy Analysis by Lazard suggest that the cost per kilowatt (kW) for utility-scale solar is less than $1,000, while the comparable cost per kW for nuclear power is between $6,500 and $12,250.
______
-2. Time to build Solar Power vs Nuclear Power:
Time to build Solar Energy:
Lazard’s levelized cost of energy analysis finds that utility-scale solar takes about 9 months to complete. However, a few factors can affect how long it takes. For example, land acquisition is a big factor, along with the time needed to get different approvals from the authorities and the size of the array being installed. Other variables affect the timing.
Time to build Nuclear Energy:
Lazard’s levelized cost of energy analysis finds that nuclear may take 69 months to complete (slightly less than 6 years). The submission by The Australia Institute (TAI) to the South Australian Nuclear Fuel Cycle Royal Commission includes discussion of time taken to build nuclear power plants. The mean time shown is 9.4 years. The recent history of nuclear power construction in the U.S. provides a useful point. Only a single nuclear power plant has been completed in the U.S. in the last 30 years: the two-unit Watts Bar Nuclear Plant in Tennessee, which required 23 years for one reactor to be operational and 33 years for the other. The logical conclusion is that solar power plants are much faster to build than nuclear power plants. The lifespan of solar panels is between 25 and 30 years, while the lifespan of a nuclear power plant is 40 to 60 years.
_____
-3. Capacity factor:
The measure that differentiates solar power to nuclear power is the “capacity factor”, which is how close to the maximum of possible power a source produces through the year. Once built, a nuclear power plant can run at its maximum potential until it needs new fuel, maybe 6 or 12 months later. Because of this, the capacity factor of nuclear is close to 100% since it normally produces as much energy as it possibly can 24 hours of the day, every day of the year. Solar power’s capacity factor is far from being this good, because well, it can only produce energy when the sun is out. This reduces its capacity to daytime and makes it vary a lot depending on how much sun the location of the solar farm gets through the year. The capacity factor of solar PV varies from 17–28%. For example, a nuclear power plant the size of the one under construction in Georgia has the capacity of 2,430 MW but to reach a similar capacity factor and generate as much power per year, it would require about 13,000MW of capacity in solar farms… So while solar can be built roughly 9-12 times faster than nuclear, we would need to build almost 5 times more capacity to generate the same amount of power through the year. For solar to produce as much electricity as is generated by the 2,430 MW Vogtle nuclear plant it would require about 13,000 MW of utility-scale solar capacity, nearly five times. However, the cost to build that capacity would be $12.4 billion, which is still just 50 percent of the cost of the $25 billion Vogtle nuclear plant.
_
To really understand which power options is best regarding cost and time of construction, see figure below:
![]()
_______
-4. Recycling:
Can Solar Panels be recycled?
Yes. Recycling Photovoltaic panels is a complex task as the way they are manufactured and the adhesives and sealants used make the task of breaking them apart a challenge. But it’s definitely doable, and it’s already being done. Just not very efficiently yet, and we’re making a lot of progress. A very big positive is that nearly 75% of the material that gets separated out is glass, which is very easy to recycle into new products! Decommissioning a solar farm is an easy and straightforward process: take the panels out and away we go! The land is not contaminated and because no concrete or infrastructures are built, the land can immediately be used for other purposes -even farming.
Can Nuclear Power Plants and Nuclear Waste be recycled?
Not really. Used nuclear fuel -or radioactive waste- can be recycled to make new fuel and by-products, since about 90% of its potential energy still remains in the fuel even after 5 years of operation in a reactor. The issue is, many countries like the United States -who produces more than 2,000 metric tons of radioactive waste every year- simply don’t recycle their radioactive waste at all. France is the leader in nuclear fuel recycling, with a commercial reprocessing capacity of used fuel of 1,700 tonnes per year while producing 1,150 tonnes per year (4 kilos of radioactive waste per citizen every year!). Globally, radioactive waste is still piling up and becoming a problem. So far, about 400,000 tonnes of used fuel has been discharged globally and only about 30% has been recycled. Even after recycling and reprocessing, a small amount of radioactive waste remains that cannot be recycled yet (and will continue to be radioactive and dangerous for hundreds or thousands of years). For example, a 1-GW nuclear power plant can produce 300 kg of nuclear waste, with a half-life of almost 24,000 years, and cause environmental issues.
Decommissioning Nuclear power plants is a daunting task at best, and a nightmare often.
Nuclear decommissioning is the administrative and technical process in which a nuclear power plant is dismantled to the point that it no longer requires measures for radiation protection. That’s obviously easier said than done. The progressive demolition of buildings and removal of radioactive material is potentially hazardous, expensive, time-intensive, and presents environmental risks that all need to be addressed. In theory, once a facility is decommissioned no radioactive danger persists and it can be released from regulatory control, which means that the land can be used for anything (including building schools and growing tomatoes). Decommissioning nuclear power plants is so expensive that even rich countries in the European Union are lacking the funds needed.
How long does it take to decommission a nuclear power plant?
Decommissioning a nuclear power plant takes a very long time, sometimes up to 60 years. It’s also a very big task. While about 99% of the radioactivity of a nuclear power plant is associated with the fuel and this “goes away” when the nuclear waste is disposed somewhere to wait for an eventual recycling, the 1% left radioactivity is found in all the scrap materials, steels, concretes, and even top soil around the nuclear power plant. In France, decommissioning of Brennilis Nuclear Power Plant, a fairly small 70 MW power plant, already cost €480 million (20x the estimate costs) and is still pending after 20 years. Despite the huge investments in securing the dismantlement, radioactive elements such as plutonium, caesium-137 and cobalt-60 leaked out into the surrounding lake.
Because of these challenges, many countries that had invested in nuclear energy have decided to discontinue their usage of nuclear power for energy consumption. The countries who have decided a nuclear phase-out are Austria, Belgium, Germany, Italy, the Philippines, South Korea, Sweden, Switzerland, Slovenia, Taiwan, and Vietnam. Other countries such as Spain and the United Kingdom are currently reviewing the future of their nuclear power. Ireland and Vietnam decided to abandon the construction of their nuclear power plants, Vietnam saying that their nuclear power plants were “not economically viable because of other cheaper sources of power.”
_____
-5. Sustainability:
Solar energy, which can be produced as long as there is sunlight, is one of the most environmentally beneficial kinds of energy. The panels normally have a life expectancy of 25 to 30 years. The best aspect is that the source of their energy is free, and they do not emit any harmful toxins into the environment. If utility-scale solar energy is not available in your location, a rooftop solar panel installation can help you reduce your household’s reliance on fossil fuels and satisfy your energy demands even if the grid goes down. Nuclear power, despite being carbon-free, is a non-renewable resource. Uranium, the chemical that powers nuclear reactors, must be renewed every three years and then carefully disposed of. Because it must be extracted from the Earth, uranium is a restricted resource.
__
In a nutshell:
While nuclear power produces a lot of energy and is carbon free, it is extremely expensive, takes a long time to build and even longer to decommission, poses issues with recycling radioactive waste and can potentially be dangerous to the population and the environment. In contrast, solar energy is much cheaper, fast to build, does not pose any dangers to the population or contamination to the environment, and is very easy to take apart. Solar projects can be built in substantially less time and at a much lower cost than a single nuclear project. Even when accounting for capacity built and energy produced from a nuclear facility, large-scale solar farms remain much less expensive and quicker to bring online than nuclear.
Nuclear beats solar in one point: Dispatchability. Utility scale PV solar is not dispatchable as it needs utility scale energy storage system. A CSP plant can incorporate thermal energy storage which makes CSP a dispatchable form of solar. It is found that increasing the dispatchability of solar power plants will necessarily lead to the emergence of additional energy losses and important LCOE increase, either because of low round-trip efficiency of the storage system, or because of its high cost of energy capacity. Despite lower energy production for a given collecting area, combination of PV power plants with electrochemical storage or thermal energy storage surprisingly seems to be the most promising paths according to 2023 study, Making solar electricity dispatchable: A technical and economic assessment of the main conversion and storage technologies. As governments and utilities across the world plan for the next century of power generation, utility-scale solar easily bests nuclear as the leading source of carbon-free power.
______
______
Solar vs hydro:
Hydro power uses the energy of flowing water – rivers or reservoirs – to generate electricity. It relies on the water cycle, where water evaporates, forms clouds, falls as rain, and flows downwards. Flowing water spins turbines connected to generators to produce power. Hydroelectricity requires either a naturally strong rushing river or the man-made creation of those effects through the construction of a dam. Hydro is considered renewable since it uses the sun-driven water cycle. Hydroelectricity is electricity generated from hydropower (water power). Hydropower supplies one sixth of the world’s electricity, almost 4,500 TWh in 2020, which is more than all other renewable sources combined and also more than nuclear power.
Hydro power has several major pluses. Once built, hydro facilities can provide low-cost electricity for long periods. Existing hydro plants also have very low emissions since no fuels are burned. At full capacity, hydro can provide a stable electricity base supply and adjust output to meet demand spikes.
However, hydro also has some minuses. While power generation itself is emissions-free, building huge dams displaces people and disrupts local habitats and ecosystems. Mega projects like China’s Three Gorges Dam require massive upfront investments into infrastructure and transmission lines. Droughts can severely limit hydro output in dry regions.
__
Ground-mounted solar parks have been easier to develop on broad areas of flat land. Hydropower, in contrast, requires steeper terrain so that water can flow. Solar energy needs access to lots of sunlight without any nature blocking the solar arrays, both in terms of foliage and inclement weather that could block out the sun. To that end, you’ll rarely see a hydro plant or solar farm in the same relative area. Substantial rushing rivers usually bring with them trees, grasses, farms, and civilization. Wide expanses of flat land that don’t receive regular rainfall or cloud cover usually exist in areas without many people or greenery.
_
The similarities between hydroelectricity and solar energy are rather fundamental. After the construction and installation of the necessary machinery, both use 100% renewable sources to create electricity with absolutely zero carbon emissions. Outside of very dramatic circumstances, the earth will never run out of the water and sunlight required for energy generation.
When comparing hydro and solar, efficiency, sustainability, and costs give useful insights. In terms of efficiency, hydro power conversion is better – modern hydro turbines can convert over 90% of the water’s energy into electricity. Solar panels remain less efficient, typically converting 15-20% of sunlight into power.
Yes, CSP plants and hydro plants both spin turbines, but the former is much less efficient than the latter. Directing the sunlight to boil water for a steam turbine is much more difficult than ensuring water can flow through a turbine.
For environmental impact, solar has an edge over hydro. Solar panels have minimal emissions when operating. Hydro power changes surrounding ecologies via disrupted water flows, land conversion for reservoirs, and trapped sediment. But solar arrays require large land areas too. With proper planning, both can reduce habitat impacts. Excavating the necessary area to create the dam can cause problems for the local ecosystems.
For costs, upfront capital costs tend to be lower for hydro, although transmission infrastructure can get expensive. Solar requires big initial investments but has no ongoing fuel costs. Operations and maintenance are also lower for simple solar panels versus complex hydro turbine mechanics. Both offer competitive lifetime generation costs, especially as solar prices fall. The global weighted average cost of electricity from hydropower projects in 2022 was US$ 0.061 per kWh, while solar $ 0.049/kWh.
_____
_____
Solar vs biomass:
When comparing biomass and solar power, three key factors stand out – efficiency, environmental impact, and cost. Efficiency-wise, solar takes the lead. It converts around 15-20% of the sun’s energy into electricity, thanks to advances in tech. Biomass lags behind with 2-3% efficiency, mostly because of heat loss when burning. The environmental footprint differs a lot too. Biomass uses waste but can still cause carbon emissions and deforestation. Solar has a much smaller footprint as a low-carbon energy source. But it has its issues like disposing of hazardous materials in old panels. Cost-wise, biomass usually needs less upfront investment compared to solar, which is pricey to install upfront. But solar can be cheaper overall since it needs little maintenance and you can make back the money over time through energy savings. So in summary, solar beats out biomass for efficiency and environmental impact but biomass has a lower startup cost.
_____
_____
Section-22
Barriers hindering future dominance of solar:
_
-1. Poor grid resilience (the ability of the grid to accommodate intermittent power):
PV technologies and solar thermal systems are dependent on sunlight availability, leading to intermittency in energy generation. This intermittency poses challenges for integrating these energy sources into the existing power grid, which requires a continuous and reliable power supply. In many published energy scenarios with higher shares of solar and wind power, “dark doldrums”, periods of simultaneously low wind speeds and solar irradiation, form the predominant vulnerability. From geophysical constraints, it is possible to compute an optimal mix of wind and solar power, which maximises the match between supply and demand. The typical optimal share of solar when 12h of battery storage is available lies between 10–70%, depending on geography. Where less storage is available, the optimal mix shifts towards more wind power. When either of the two main technologies is (near)-absent, the grid becomes more vulnerable to weather fluctuations. As such, solar-dominated grids may not always be desirable. In regions close to the equator there is less seasonality, so that the need for long term storage is small. The self-limiting effect of solar PV diffusion due to intermittency can be overcome with policy specifically supporting wind power and other zero-carbon energy sources, as well as improved storage, grid connections and demand-response. Notably, new power market rules can be designed to incentivise investment in generators that diversify grid sources of intermittency, according to the savings in storage that they generate. Energy storage solutions, such as batteries and pumped hydro storage, can address the intermittency challenge by storing excess energy during periods of high generation and releasing it during low generation periods. Prices for lithium-ion batteries have been declining, with costs around $137 per kilowatt-hour in 2020, but they still represent a substantial portion of the system’s total cost. In addition to costs, the lifespan of batteries is another concern. Most storage systems have a lifespan ranging from 5 to 15 years, which means they will need replacement at least once in the lifetime of the solar installation, adding to the long-term costs and maintenance requirements. Advanced grid management systems, including smart grids and demand response mechanisms, can help balance the intermittent nature of solar energy generation and ensure stable grid operation.
_____
-2. Investment:
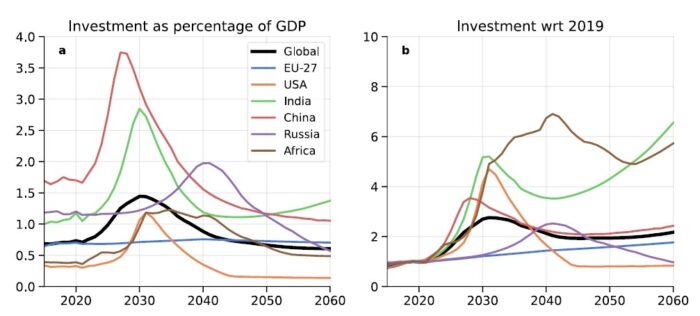
Figure above shows Investments in new generating capacity. (a) shows power sector investments as a percentage of GDP. (b) shows power sector investment with respect to 2019 values. Investment is forecast to see a moderate growth worldwide relative to historical trends. Various regions in the Global South, in particular India and Africa, will see a significant rise in investment in generating capacity by mid-century, due to projected rapid economic growth.
Solar growth trajectories will inevitably depend on the availability of finance. Low-carbon finance is presently highly concentrated in high-income countries. The initial cost of PV systems, solar thermal systems, and energy storage solutions can be perceived as a barrier for widespread adoption. The upfront investment required for installation and equipment can pose financial challenges, especially in regions with limited financial resources. Even international North-South flows largely favour middle-income countries, leaving lower income countries – particularly those in Africa – deficient for solar finance despite the enormous investment potential. This unequal distribution of finance reflects different investment risk considerations across countries. Differences in local financial environments, such as macroeconomic conditions, business confidence, policy uncertainty and regulatory frameworks impact risk perceptions and the willingness to invest by domestic and international actors. Equity investors and financial lenders apply high-risk premiums in perceived risky regional contexts, thus increasing the cost of capital for renewable projects.
Developing countries are particularly financially constrained. Domestically they are characterised by under-developed capital markets and lack capital stock; whereas international finance is restricted due to high sovereign risks and local currency risks on account of volatile economic fundamentals (as projects are funded with foreign currency while returns are generated in local currencies). This leads to a chronic lack of available finance to support investments in solar energy.
Energy sector deficiencies further exacerbate the negative investment outlook for solar projects. Weak contract enforcement, changing energy regulations, and underdeveloped electricity markets affect project returns and investment viability. Developing countries may also face high import costs due to shortages in foreign currency reserves needed to support an expanding solar sector.
Consequently, a key challenge for global solar deployment lies in the mismatch between high investment needs (Figure above) and finance flows mobilised in developing countries. Latest estimates suggest that climate financial flows would need to increase by a factor 4 to 8 in most vulnerable countries (IPCC 2022). Strategies to address this finance gap should include mechanisms to absorb currency and investment risk as a bridge to unlock international capital flows while creating domestic financial capacity over time.
______
-3. Supply chain:
A solar-dominated future is likely to be metal and mineral-intensive. Future demand for “critical minerals” will increase on two fronts: electrification and batteries require large-scale raw materials – such as lithium and copper; niche materials, including tellurium, are instrumental for solar panels. Solar panels often require rare materials like indium, gallium, and tellurium. The availability of these materials is limited, and their extraction can be environmentally damaging and expensive. The price of these materials fluctuates due to market demand and supply constraints, which can impact the overall cost of solar cells. For example, the price of tellurium can vary significantly, and it’s essential for manufacturing thin-film solar cells, which are a cost-effective alternative to traditional silicon-based panels. As countries accelerate their decarbonisation efforts, renewable technologies are projected to make up 40% of total mineral demand for copper and rare earth elements, between 60 and 70% for nickel and cobalt, and almost 90% for lithium by 2040.
_
The notion of criticality comes in three forms: physical, economic, and geopolitical. Firstly, there are risk associated with low reserves. Secondly, minerals supply typically reacts slowly to short-term changes in demand in, due to the long times required to establish mineral supply chains. This could lead to price rallies. The construction of new mining facilities (from exploration to mine operations) requires on average 16.5 years and may be stalled due to concerns about socio-environmental impacts. The geopolitical supply reliability of critical minerals is also weak, since mineral production displays higher geographical concentration, compared to fossil fuels production. China and The Democratic Republic of Congo, for example, own 60% and 70% of global production of rare earth minerals and cobalt respectively. Domestic shocks, including growing climate risks and political instability, could hamper the extraction and production and generate price shocks that along the value chain, impacting solar technology costs. Electricity networks could suffer similar impacts for nickel and aluminium.
_
Switch to circular economy necessary. Many of the materials required for manufacturing solar products are only available in limited quantities. For instance, the high-quality glass that is used for solar modules is not available in the quantities we would need for the sector to rapidly expand immediately. A switch to a circular economy – which would see the components of old solar products recycled at the end of their lifecycle – is necessary for the solar energy sector to grow. One way of achieving this shift is to find a way to replace the silver components in photovoltaic panels – which help to optimise energy generation – with aluminium. Although a large amount of energy is required to manufacture aluminium, it is the easiest metal to recycle. If we want to build an industry sector producing solar modules in a sustainable way, we need the whole value chain, from raw materials up to the complete systems, to work in a circular manner. Risk associated with low reserves can be mitigated with (research into) substitutions. Recycling and circular economy processes can further reduce extraction rates, but re-used materials are unlikely to meet future demand as it outgrows existing stocks.
_____
-4. Land:
One largely neglected factor is land. Most people do not think of land as a constraint on our ability to exploit this manna from the heavens. But solar installations are so space-hungry that switching large proportions of our electricity supply to solar power would occupy enormous swathes of land. A new study, produced as part of the European Union-funded LOCOMOTION project aimed at producing environmental policy models, estimates that the land requirements for solar energy are far from negligible. Focusing on the EU, Japan, South Korea and India, the simulation forecasts that, in a scenario where 80 percent of electricity is extracted from the sun by 2050, solar installations would require as much as 5 percent of the total landmass (in the case of Japan and South Korea). In the EU, the land requirements would reach up to 2.8 percent of the bloc’s total territory. To give you an idea of the scale of this, an estimated 4 percent of EU land is currently covered with man-made surfaces, such as cities, towns, villages and roads and other infrastructure required to sustain them.
_
Our scramble to capture the sun’s energy could set off a chain reaction that travels from urban areas to reach as far away as the rainforests. For example, if we convert productive land in Europe to solar parks, this may lead to other agricultural and economic activities shifting to other locations, leading potentially to deforestation within and outside Europe. Given the difference in the productivity of arable land in different parts of the world, this could potentially involve a magnifying effect, indirectly leading to the loss of more land (and more biodiverse areas) than that which is directly converted to solar installations.
______
-5. Political economy and resistance from declining industries:
The pace of the transition depends not only on (economic) decisions by entrepreneurs, but also on how desirable policy makers consider it. Solar energy aligns with many policy objectives (clean air, poverty alleviation, energy security). It also has disadvantages for some of the players involved, as it leads to rapid economic and industrial change. A rapid solar transition may also put at risk the livelihood of up to 13 million people worldwide working in fossil fuel industries and dependent industries. These people are frequently concentrated in communities close to mines extraction and industrial sites, where the closure of these activities can have severe repercussion on the well-being of communities decades on. Policy makers could have substantial incentives to slow down the transition to limit these direct impacts. Similarly, many countries currently provide fossil fuel subsidies to increase the purchasing power of low-income households, difficult to phase out and which reinforce opposition to change. New coalitions of actors who benefit from the transition (home and landowners, people with jobs in clean energy), may counterbalance some of the resistance from incumbents, but do not resolve equity issues. Policy to ensure a just transition does resolve inequity and can mitigate risks posed by resistance from declining industries.
_____
-6. Technological challenges in efficiency improvements:
The highest efficiency solar panels on the market today have efficiencies of about 22-23%, but the majority of photovoltaic (PV) panels have efficiencies in the range of 15-18%. This is a significant increase from early solar cells, which had efficiencies of around 6%. However, when we compare this to the theoretical efficiency limit for a single-layer silicon solar cell, which is about 30% — known as the Shockley-Queisser limit — there is still room for improvement. Several technological challenges exist in pushing solar cell efficiencies closer to their theoretical limits. One major challenge is the inherent loss mechanisms in silicon solar cells, such as electron-hole recombination, where electrons recombine with holes before they can contribute to electric current, leading to lost potential energy. Another challenge is improving the light absorption of solar cells without significantly increasing manufacturing costs. Advanced materials such as perovskites offer much promise in this area due to their high absorption and potential for lower manufacturing costs, but they currently suffer from issues with longevity and stability. Furthermore, increasing the efficiency of solar panels often involves using expensive materials or complex manufacturing processes that can raise the cost per watt of solar energy, potentially making solar less competitive with traditional energy sources.
_____
-7. The complexity of solar cell manufacturing:
Manufacturing solar cells is a complex process that involves precise engineering and cleanroom conditions. High purity levels are essential for the semiconductor materials used in solar cells, as impurities can significantly reduce efficiency. Maintaining these conditions requires substantial energy and resources, contributing to higher manufacturing costs. Furthermore, the production process requires sophisticated equipment and expertise. Advanced techniques such as nanotechnology and layer deposition can improve solar cell performance but also add to the manufacturing complexity and cost. Each stage of manufacturing must ensure the highest quality and performance standards, which can slow down production and increase the price of the end product. Even minor errors can lead to substantial losses in efficiency and longevity of the solar cells, emphasizing the need for meticulous manufacturing practices.
______
-8. Specific regional challenges:
Examining the barriers to the adoption of solar cells in different regions reveals a complex tapestry of economic, technological, and policy-related challenges. Looking at both developed and developing countries, as well as individual case studies, can provide valuable insights into what drives success or failure in solar energy adoption.
Solar cell usage in developed vs. developing countries:
In developed countries, the adoption of solar energy is often driven by government incentives, technological advancements, and environmental awareness. However, even here, high initial costs for installation and integration into existing power grids can be prohibitive. For example, in the United States, despite federal tax credits, the average cost for a residential solar panel system can be upwards of $15,000 before incentives. In contrast, developing countries face additional challenges such as lack of financing, inadequate infrastructure, and sometimes, an insufficient regulatory environment. For instance, in parts of Africa, despite abundant sunlight, the adoption rates are low due to the high cost relative to the average income, and a lack of access to affordable financing options for both consumers and potential local solar companies.
Specific case studies of successful and unsuccessful adoption:
Looking at Germany, a success story, the country has become one of the world’s leaders in solar energy through a combination of feed-in tariffs, grants, and subsidies that have incentivized adoption. As a result, Germany had installed over 53 gigawatts of solar PV capacity by the end of 2020. On the flip side, Spain’s solar sector faced a dramatic setback after the government retroactively cut subsidies and imposed what came to be known as the “sun tax,” which penalized solar energy self-consumption. This severely hindered the growth of solar installations in the country for a number of years.
Lessons learned and what they mean for global adoption:
These case studies highlight the importance of stable and supportive government policies in the successful adoption of solar energy. Incentive programs must be sustainable and reliable to foster long-term growth in the solar sector. Furthermore, they show the need for appropriate financing mechanisms to make solar technology affordable and accessible, particularly in developing regions. Additionally, they underscore the need for technological innovation to reduce costs and improve the efficiency of solar cells. The global market for solar energy continues to evolve, with technological advancements promising to lower costs further. For example, perovskite solar cells could revolutionize the market with their potential for lower costs and higher efficiency, provided manufacturers can produce them on a large scale and ensure their long-term reliability. In conclusion, the global adoption of solar energy is influenced by a variety of factors that differ across regions. Successful adoption hinges on tailored strategies that address specific regional challenges, with lessons from both successful and unsuccessful case studies serving as a guide for future efforts in different parts of the world.
______
______
Section-23
Factors promoting solar adoption:
_
Here are some of the primary reasons why solar energy is considered a better alternative:
-1. Renewable and Sustainable: Solar energy is a renewable resource, meaning it is continuously replenished as long as the sun is shining. It provides a sustainable and inexhaustible source of power, unlike finite fossil fuels.
-2. Reduced Greenhouse Gas Emissions and Pollution: Solar power generation produces minimal or no greenhouse gas emissions during operation, significantly reducing the environmental impact compared to fossil fuels. Solar panels reduce greenhouse gas emissions and contribute to a cleaner atmosphere by decreasing air pollution. Traditional energy sources, such as coal and natural gas, release pollutants like sulfur dioxide, nitrogen oxide and particulate matter, all of which can have detrimental effects on air quality and human health. The generation of electricity through fossil fuels contributes to air pollution, which is linked to a variety of health issues, including respiratory problems, cardiovascular disease, and premature death. By replacing fossil fuel-derived electricity with clean, solar energy, we can improve air quality and create healthier communities. Utility-scale photovoltaic arrays are an economic investment across most of the United States when health and climate benefits are taken into account, concludes an analysis by researchers Patrick Brown and Francis O’Sullivan. Their results show the importance of providing accurate price signals to generators and consumers, and of adopting policies that reward installation of solar arrays where they will bring the most benefit.
-3. Energy Independence: Solar energy systems enable greater energy independence by allowing individuals, businesses, and countries to generate their own electricity. This reduces dependence on external energy sources and enhances resilience against geopolitical or supply disruptions.
-4. Low Operating Costs: Once installed, solar photovoltaic (PV) systems have low operating and maintenance costs. The sunlight needed for energy generation is free, and solar panels have no fuel costs, resulting in stable and predictable energy expenses over the system’s lifespan.
-5. Technological Advancements and Cost Reductions: Advances in solar technology and increased production have led to significant cost reductions over the years. The declining costs of solar panels and associated equipment make solar energy more economically viable and accessible.
-6. Job Creation: The solar industry creates job opportunities in manufacturing, installation, maintenance, and research and development. Supporting the growth of the solar sector contributes to employment generation and economic development. In 2015, for instance, the UK become the second-largest solar employer, with 35,000 people, and the continent’s largest solar photovoltaic (PV) panel installation market. Solar energy employment has offered more employment than other renewable sources. In 2021 it provided 4.3 million jobs, more than a third of the current global workforce in renewable energy.
-7. Scalability and Modularity: Solar energy systems can be easily scaled to meet varying energy needs, from small residential installations to large utility-scale projects. This scalability allows for flexibility in deployment based on specific energy requirements.
-8. Low Water Consumption: Unlike some traditional power plants that require significant water for cooling, solar PV systems have minimal water requirements for operation. This is especially important in regions facing water scarcity.
_______
_______
Solar is Scalable:
A homeowner can put solar panels on their roof. They can’t do that with a wind turbine, a hydroelectric dam, or a powerplant. That means that solar can be “right-sized” in a way that wind cannot. There are places around the world where it is possible to locate a 22-sqaure mile utility scale solar farm, such as the Bhadla Solar Park, which is in the desert of western Rajasthan, India. That massive solar park has a capacity of about 2.25 gigawatts, which in terms of generation (assuming a capacity factor of ~30%) would be about the same as a single 700 MW nuclear facility. If solar only was possible at the utility scale, then it would suffer similar shortfalls to wind. But solar generation can be deployed from the kilowatt to the gigawatt scale, and that opens up many opportunities for deployment. In the U.S., the Energy Information Agency (EIA) in 2023 reports that about one third of solar generation comes from small-scale solar (defined as less than 1 MW capacity), as shown below.
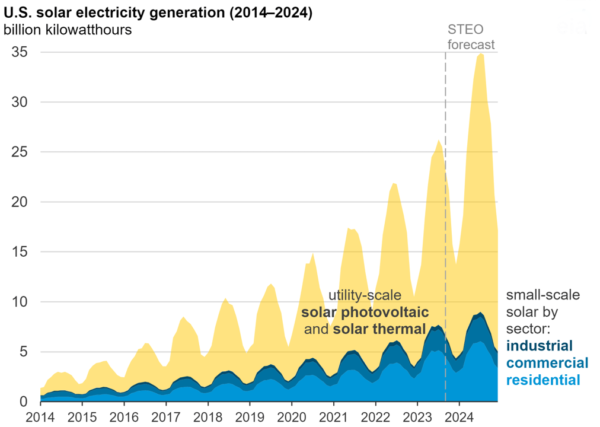
_____
Solar is cheap:
When clean energy becomes cheaper, it readily gobbles up market share, eventually displacing dirtier and more expensive energy. With or without subsidies, solar costs should be expected to continue to drop, motivating further deployment, which will lead to greater reductions in costs — a virtuous cycle. Even if solar were free, the technology will always have an intermittency problem when the sun doesn’t shine. Massive battery storage can smooth over demand, but it cannot address intermittency with today’s technologies. Today’s lithium-ion batteries typically only deliver power for two to four hours before needing to recharge. If costs keep falling, battery companies might be able to extend that to eight or ten hours (it’s a matter of adding more battery packs) but it may not be economical to go far beyond that. That means additional long-duration storage technologies could be needed. If California wants to rely largely on renewable energy, it will have to handle weeklong periods where there’s no wind and little sun. Also, there’s far more solar power available in summer than in winter, and no battery today can store electricity for months to manage those seasonal disparities.
As solar gets cheaper, it will see continued expansion, but accompanying that expansion will be the associated costs of reliable back-up generation, which today means natural gas. Even though natural gas is a fossil fuel, the expanded use of solar backed up by gas has considerable potential to reduce emissions, especially in places where that combo displaces coal generation. The low costs of solar mean that we should expect to see more such displacement.
______
Solar is Popular:
Solar energy is the safest source of energy production, as measured by deaths per terawatt-hour of production. The only other energy production technology that is close is nuclear energy but many people have dread risk fears about nuclear energy. These fears are not backed by evidence, but they are legitimate and will limit the expansion of nuclear energy in many places. There are of course concerns about solar supply chains, solar waste, and risks to solar installations but these issues are common across all energy technologies.
A 2023 survey by Glocalities of 21,000+ people in 21 countries found solar energy to be the most favored energy technology, and overwhelmingly so, with 68% favouring solar over other technologies, as shown in the figure below.
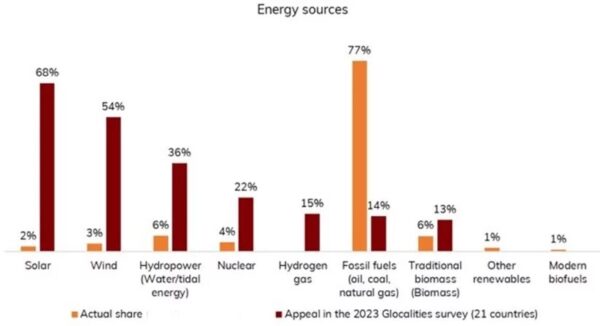
The strong public support for solar and lack of public fears mean that among energy technologies, solar has strong political tailwinds that are unique in the energy space. Correspondingly, the ongoing expansion of solar generation will face much less opposition than proposed new wind and nuclear. Of course, the fact that effective solar deployment also means more gas back-up may result in greater opposition in the future from those who believe that we can just stop fossil fuel use.
______
Solar energy been deployed to the point of no return:
According to the latest World Energy Outlook by the International Energy Agency (IEA), investments in clean energy have risen by 40% since 2020 and more than $1 billion per day is being spent on solar deployment. With this, the installed capacity of solar photovoltaic (PV) is poised to surpass coal by 2027 and become the largest installed capacity of energy in the world. Researchers from the U.K., Sweden and the U.S. have used additional metrics to take these projections even further, estimating solar, along with wind, could “irreversibly become the dominant electricity technologies within 1-2 decades, as their costs and rate of growth far undercut all alternatives.”
India and China are set to lead the deployment of solar among countries in the Global South, where the barriers challenging the widespread proliferation of solar are more pronounced. India is ahead of the game for a country in the Global South and has started to see rapid growth in solar. Barriers unique to the Global South are the higher costs of borrowing money, which historically made solar less attractive, as it has a high upfront cost and low maintenance cost. Now that solar is frequently the cheapest option, industries, installation capacity and all need to be built, which usually takes a few years.
What drives solar to dominate the energy mix by mid-century, according to the researchers, is “costs declining far below the costs of all alternatives, while its parent industrial supply capacity increases rapidly.” The cost of storage will also decrease as innovations advance. Solar energy may see widespread adoption even without additional policies supporting renewable energy.
______
Solar Energy in Emergency Response:
In emergency situations, whether they be natural disasters or other crises, the importance of reliable energy sources becomes abundantly clear. The availability of power can be the difference between effective communication and complete isolation, light and darkness, a functioning hospital or a critical health service failure. During emergencies, energy fuels crucial lifesaving services and facilitates the operation of emergency response mechanisms. It powers everything from hospitals and clinics, providing crucial medical services, to communication networks and command centers, coordinating effective response strategies. In the aftermath of a disaster, reliable energy enables clean water provision, aids in food preparation, and offers the necessary comfort and safety to displaced individuals. A lack of energy during these critical times can exacerbate the crisis and hinder recovery efforts, making the role of sustainable and reliable energy sources like solar power essential in such scenarios.
Solar energy is increasingly being recognized as a powerful ally in emergency response scenarios. Solar systems, with their ability to generate electricity independent of the traditional grid, can provide a reliable source of energy when other options may not be available. They offer a renewable, scalable and, importantly, portable power solution that can be critical in the wake of a disaster. Solar panels can be deployed in various configurations, from large-scale arrays powering emergency shelters or hospitals, to small, portable units that can charge essential communication devices, or provide light in remote or compromised locations. A variety of solar-powered devices are now available, each serving different functions within the broader landscape of disaster relief. Many emergency medical devices, such as vaccine refrigerators or dialysis machines, can also be powered by solar energy. Additionally, solar-powered street lights can illuminate strategic areas, ensuring safety and security during nighttime hours. Moreover, in the aftermath of an emergency, when traditional energy infrastructure may have been severely damaged, solar power can offer a resilient and more robust alternative. While grid repairs can be a lengthy process, solar installations can be more rapidly deployed, providing an immediate and long-term solution to energy needs. In this sense, solar energy not only assists during the emergency response but also aids in the recovery and rebuilding phase, contributing to the development of a more resilient and sustainable energy infrastructure for the future.
______
Solar energy in Socioeconomic development:
The social impact of solar energy is significant, and its potential reaches far beyond simply reducing our reliance on fossil fuels. As solar power continues to gain popularity and becomes more accessible, it brings with it a plethora of social benefits that are reshaping our societies and communities in meaningful ways. At a fundamental level, solar energy promotes equality by democratizing access to power. Many regions across the globe lack reliable or consistent access to electricity. Solar power, with its ability to operate off the grid, can bring electricity to remote or impoverished communities that might otherwise go without, improving living conditions and opening up new opportunities. From lighting homes after dark, to powering local schools or medical facilities, solar energy can significantly enhance quality of life and facilitate social development in these areas. Solar energy also contributes to job creation, playing a crucial role in stimulating economic growth. The solar industry has been a significant source of job creation worldwide, often outpacing other sectors. These jobs range from manufacturing and installation to maintenance and administration, offering new employment opportunities and skills training across a variety of levels and fields. Moreover, the solar industry significantly contributes to local economies. Investments in solar projects stimulate economic activity by necessitating the purchase of goods and services, creating jobs in related industries. This ripple effect can lead to substantial economic development, particularly in regions with high solar potential. In addition, the operation and maintenance of solar installations provide long-term, steady employment opportunities. This stability can lead to the development of new skills and industries within local communities, further boosting economic growth. Lastly, solar energy can be a pathway to energy independence for many regions, reducing reliance on imported fossil fuels and keeping more money within local economies. This can lead to a more resilient economy, better able to withstand fluctuations in global energy markets.
______
______
Moral of the story:
_
-1. When we burn fossil fuels, we emit greenhouse gasses, leading to global warming and climate change. The huge dependence on fossil fuels and massively abusing them in almost all the life sectors have developed a number of dangerous environmental problems, one leading into another such as land drought, heatwaves, wildfires, a rise of sea level, floods, and other extreme climate phenomena. We need environmentally friendly and efficient replacements to the conventional energy market, considering their finite sources and their environmental impacts. The world needs electricity that is affordable, available, reliable, scalable and clean. No single technology can achieve that for us.
_
-2. The Sun emits radiation at a rate of 3.8 × 10^26 Watt, of which only two parts in a thousand million arrive at the Earth, with the rest disappearing into space or warming the other planets in our solar system. About 40 per cent of the solar radiation received at the earth’s surface on clear days is visible radiation within the spectral range of wavelength 0.4 to 0.7 μm, while 51 per cent is infrared radiation in the spectral range of wavelength 0.7 to 4 μm. Approximately 5% of solar terrestrial radiation is UV radiation in the spectral range of wavelength 0.1 to 0.4 μm. Light has dual nature as both a particle and a wave. Sunlight is composed of particles called photons. These have energy, but zero rest mass. When the photons collide with other particles their energy is converted to other forms depending on the kind of atoms they strike. Most collisions create only heat. Of course, heat can be converted in to electricity. But electricity can also be produced when the photons make electrons in the atoms so agitated that they break away and move about freely. Photons also drive numerous chemical reactions e.g. photosynthesis, ozone & vitamin D formation.
_
-3. The amount of radiant energy emitted by the sun is called solar radiation, while solar irradiation refers to the amount of solar radiation received from the Sun on earth per unit area which is expressed in watts per square meter (W/m2). Insolation is the amount of solar energy that strikes a given area on earth over a specific time, and varies with latitude or the seasons. The unit of insolation often used in the solar power industry is kilowatt hours per square metre (kWh/m2) per day. Kilowatt-hour is a common billing unit for electrical energy supplied by electric utilities. 1 kWh = l kilowatt × 1 hour = 1000 watts × 3600 seconds = 3,600,000 watt-seconds or joules.
_
-4. Voltage is the difference in electrical charge between two points in a circuit. This difference in charge allows electricity to flow. Current is the rate at which electricity flows through the system. Electrical power is the product of voltage and current and it is the rate at which energy is generated by solar panels. Electric power is measured in watts or kilowatts, while electric energy is measured in kilowatt-hours.
Base load is the minimum level of electricity demand required over a period of 24 hours. Peak load is the time of high demand. These peaking demands are often for only shorter durations. Low-cost, base-loadable, dispatchable, fossil fuel based electricity has always served as a formidable cost competitor for electrical power generation. To provide a truly widespread primary energy source, solar energy must be captured, converted, and stored in a cost-effective fashion to provide baseload and peak load.
_
-5. The Earth revolves around the sun in an elliptical orbit and is closer to the sun during part of the year. When the sun is nearer the Earth, the Earth’s surface receives a little more solar energy.
The 23.5° tilt in the Earth’s axis of rotation is a significant factor in determining the amount of sunlight striking the Earth at a particular location. Tilting results in longer days in the northern hemisphere from the spring (vernal) equinox to the fall (autumnal) equinox; and longer days in the southern hemisphere during the other 6 months.
Countries which lie in the middle latitudes, receive more solar energy in the summer not only because days are longer, but also because the sun is nearly overhead. The sun’s rays are far more slanted during the shorter days of the winter months.
The rotation of the Earth is also responsible for hourly variations in sunlight. In the early morning and late afternoon, the sun is low in the sky. Its rays travel further through the atmosphere than at noon, when the sun is at its highest point. On a clear day, the greatest amount of solar energy reaches a solar collector around solar noon.
Latitude, seasons, and weather patterns are major factors that affect insolation— the amount of solar radiation received on a given surface area during a specific amount of time. Locations in lower latitudes and in arid climates generally receive higher amounts of insolation than other locations. Clouds, dust, volcanic ash, and pollution in the atmosphere affect insolation levels at the surface. Buildings, trees, and mountains may shade a location during different times of the day in different months of the year. In general, the intensity of solar radiation at any location is greatest when the sun is at its highest apparent position in the sky—at solar noon—on clear, cloudless days.
_
-6. The solar azimuth and solar zenith express the position of the sun.
The solar zenith is the angle measured from the local zenith and the line of sight of the sun. Due to the spherical shape of the Earth, greater the zenith angle, the larger the area that the sun’s rays are spread over and the lower the intensity. Solar zenith angle is 0 for the overhead Sun. This angle changes systematically with latitude, the time of year, and the time of day.
The solar azimuth angle is the azimuth (horizontal angle with respect to north) of the Sun’s position. This horizontal coordinate defines the Sun’s relative direction along the local horizon. For a geographic location, the azimuth is the horizontal angle of the sun rays. At solar noon, the sun is always oriented to the south in the northern hemisphere and oriented to the north in the southern hemisphere. At noon, the sun’s light comes from the south in the Northern Hemisphere and from the north in the Southern Hemisphere.
_
-7. Solar energy contains a direct component and a diffuse component. Direct radiation travels directly from the Sun to any point on the Earth along a straight line connecting the Sun with the selected point on the Earth. Diffuse radiation is the solar radiation that is absorbed, scattered, or reflected by water vapor, dust particles or pollution when passing through the atmosphere. This distinction is important because only the direct solar component can be effectively focused by mirrors or lenses. The direct component typically accounts for 60–80 percent of the total solar insolation in clear sky conditions and decreases with increasing humidity, cloud cover, and atmospheric aerosols such as dust or pollution plumes. Technologies that rely on the direct solar component such as CSP plants work best in areas with high direct normal irradiance, which generally limits their application to arid regions. Nonconcentrated solar technologies such as PV panels can use both the direct and diffuse solar components and are not geographically limited in their application.
_
-8. The earth at sea level receives about 1,000 Watts per square meter of solar energy (1000 joules every second per m2) at high noon on clear day. This figure 1000w/m2 includes both beam (direct) and diffuse radiation. A peak sun hour is defined as one hour in which the intensity of solar irradiance (sunlight) reaches an average of 1,000 watts of energy per square meter throughout one hour, and that happens to be the exact amount of sunlight used to test and rate solar panels in the lab. In other words, one peak sun hour is 1 kWh radiation energy received in 1 square meter over 1 hour. Even though the average day is 12 hours, the power you actually get on your panels is equal to about 4 to 6 peak sun hours. For example, you receive 300 watts/m2 radiation continually for 12 hours in a day, it would come to 3.6 peak sun hours (300 x 12 = 3600 / 1000 = 3.6).
If insolation map in a given area says 6 kWh/m2/day, then you are getting about 6 peak sun hours of sunlight on the panel. Modern solar panels are around 20% efficient, so that works out to approximately 200 watts per square meter, or 20 watts per square foot. So, you will get maximum 1.2 kWh/m2/day output from solar panel in that given area adjusted by factors such as tilt, tracking and shading. Higher the insolation in a given area, higher the output of solar panels, all other factors same. Most of the world’s population live in areas with average insolation of 3.5–7.0 kWh/m2 per day.
Peak sun hour allows you to precisely measure the amount of irradiance (sunlight) that will hit solar panels installed in a given location. This, in turn, allows you to calculate the expected energy production for a given solar system size installed at that location. In other words, peak sun hours tell you how much power a solar installation will generate. They also allow you to compare sunlight availability between locations. Greater the peak sun hours per day, greater the solar irradiance and greater the solar panel output provided other factors remain same.
Note:
1000w/m2 = 1000 joules energy per second per square meter. One hour has 3600 seconds. One peak sun hour = 1000 x 3600 = 3,600,000 joules energy per m2 equivalent to 1 kWh of energy per m2.
_
-9. The world’s energy supply today is neither safe nor sustainable. Despite the continuous expansion in renewable energy source proportions, fossil fuels including oil, coal, and gas, still dominate at an overwhelming majority. They account for 84.3% of all energy consumption. As the burning of fossil fuels accounts for 87% of the world’s CO2 emissions, a world run on fossil fuels is not sustainable, they endanger the lives and livelihoods of future generations and the biosphere around us. And the very same energy sources lead to the deaths of many people right now – the air pollution from burning fossil fuels kills 3.6 million people in countries around the world every year; this is 6-times the annual death toll of all murders, war deaths, and terrorist attacks combined. If you look at the number of deaths due to accidents and air pollution per TWh of energy produced, for solar it is 0.02, and for wind it is 0.04. Just to put things in perspective coal causes 24.62 deaths. Solar energy is the safest source of energy production, as measured by deaths per terawatt-hour of production. The alternatives to fossil fuels – renewable energy sources and nuclear power – are orders of magnitude safer and cleaner than fossil fuels.
_
-10. Solar energy refers to sources of energy that can be directly attributed to the light of the sun or the heat that sunlight generates. Solar power is generated when energy from the sun (sunlight) is converted into electricity or used to heat air, water, or other fluids. Solar energy technologies can be classified along the following continuum: (1) passive and active; (2) thermal and photovoltaic; and (3) concentrating and non-concentrating.
Passive solar technologies involve the accumulation of solar energy without transforming thermal or light energy into any other form. Active solar technologies collect solar radiant energy and use special equipment to convert it into other forms of energy, e.g., heat or electricity. Active solar techniques use photovoltaics, concentrated solar power, solar thermal collectors, pumps, and fans to convert sunlight into useful output. Passive solar techniques include selecting materials with favorable thermal properties, designing spaces that naturally circulate air, and referencing the position of a building to the Sun. Active solar technologies increase the supply of energy and are considered supply side technologies, while passive solar technologies reduce the need for alternative resources and are generally considered demand-side technologies.
Photovoltaics generate electricity directly from sunlight while solar thermal energy technologies capture the heat energy directly from the solar radiations, to be used for heating purposes and to produce electrical energy.
Concentrating solar uses mirrors or lenses to focus sunlight onto a smaller area, increasing the intensity of the solar radiation. Non-concentrating solar do not use mirrors or lenses to concentrate sunlight. Instead, they have a large surface area that directly absorbs solar radiation.
A comprehensive solar energy system draws upon the synergy of three key components: photovoltaic (PV) technologies, solar thermal systems, and energy storage solutions. In recent years, significant advancements have been made in these three components, revolutionizing the efficiency, scalability, and reliability of solar energy systems. PV technologies have undergone rapid advancements, enhancing solar cell efficiency, reducing manufacturing costs, and increasing their applicability in various environments. Solar energy does have lots of potential, with 87% of the world’s nations able to power themselves using less than 5% of their land.
_
-11. Solar thermal technology is harnessing solar energy to generate thermal energy (heat). Solar water heating, solar house heating, solar distillation, solar drying of agricultural and animal goods, solar cooking, solar furnaces and CSP are few examples of solar thermal technologies. The most common usage of solar thermal energy is for onsite water and space heating. CSP systems use lenses or mirrors and tracking systems to focus a large area of sunlight onto a small area. The concentrated light is then used as heat or as a heat source for a conventional power plant (solar thermoelectricity).
_
-12. For the 200,000 displaced citizens of Darfur living in refugee camps in Chad, the simple task of cooking a meal poses serious risks. Since wood for cooking is scarce in the desert region, refugees must travel several miles outside the camp to gather firewood, where they are highly vulnerable to rape attacks. Solar cookers have cut their firewood use by 50 to 80 % to prepare their meals and ensured their security. Solar cookers provide many advantages over wood-burning stoves and solar cookers also allow villagers to pursue time for education, business, health, or family during time that was previously used for gathering firewood.
_
-13. There are two types of solar panels – solar PV and solar thermal. Photovoltaic (PV) panels turn sunlight into electricity. Solar thermal panels turn sunlight into heat. In terms of pure efficiency at harvesting energy from the sun, solar thermal is more efficient at around 70% while PV is around 15-20%. So in theory thermal panels will require less roof space than PV. But this is somewhat misleading. Thermal energy is classed as a ‘lower grade’ than electric; in this case it can only be used for one purpose, heating water/space. PV’s electric energy can be used for a multitude of applications in the home from lighting and heating to appliances and car charging. After weighing up both systems, solar PV is much more worthwhile in terms of flexibility and cost-efficiency.
Both types of solar panels, PV and thermal can be combined to make photovoltaic thermal hybrid solar collector.
Note:
Unless specified otherwise, solar panel means PV panel.
_
-14. A solar thermal collector collects heat by absorbing sunlight. The term “solar collector” commonly refers to a device for solar water heating (solar thermal panel), but may refer to large power generating installations such as solar parabolic troughs and solar towers or non-water heating devices such as solar air heaters. Solar thermal collectors are either non-concentrating or concentrating. In non-concentrating collectors, the aperture area (i.e., the area that receives the solar radiation) is roughly the same as the absorber area (i.e., the area absorbing the radiation). A common example of such a system is a metal plate that is painted a dark color to maximize the absorption of sunlight. Concentrating collectors have a much larger aperture than the absorber area. The aperture is typically in the form of a mirror that is focussed on the absorber, which in most cases are the pipes carrying the working fluid. Non-concentrating collectors are typically used in residential, industrial and commercial buildings for space/water heating, while concentrating collectors in concentrated solar power plants generate electricity by heating a heat-transfer fluid to drive a turbine connected to an electrical generator.
_
-15. Solar water heating (SWH) is heating water by sunlight, using a solar thermal collector (solar thermal panel). SWH are active (pumped) and passive (convection and gravity driven). Active systems can achieve higher efficiencies and provide consistent hot water supply, making them suitable for various regions. The results showed that active solar water heating systems achieved efficiencies ranging from 60% to 70%, with higher values observed in regions with ample sunlight. The passive solar water heating system achieved efficiencies ranging from 50% to 60%, making it a viable option for regions with moderate sunlight. To prevent global warming & pollution, reduce dependence on imported fuel, and ease the price of natural gas, we ought to jumpstart a mainstream market for solar hot water.
_
-16. A photovoltaic (PV) cell, also known as Solar Cell, is a semiconductor device that generates electricity when light falls on it. When sunlight strikes a PV cell, the photons of the absorbed sunlight dislodge the electrons from the atoms of the cell. The free electrons then move through the cell, creating and filling the holes in the cell. It is this movement of electrons and holes that generates electric current. The physical process in which a PV cell or Solar cell converts sunlight into electricity is known as the Photovoltaic Effect. Materials presently used for photovoltaics include monocrystalline silicon, polycrystalline silicon, amorphous silicon, cadmium telluride, and copper indium gallium selenide/sulphide. Some PV cells can convert artificial light into electricity. Solar cells are connected electrically and packaged into a frame (more commonly known as a solar panel), which can then be grouped into larger solar arrays. Photovoltaic solar panel is the most commonly used solar technology to generate electricity energy. Solar panels are installed at three main scales: residential, commercial, and utility. All scales will require system flexibility measures, such as energy storage and demand-response, whereby demand is shifted to match electricity supply.
_
-17. When energy is added to pure silicon, in the form of heat for example, it can cause a few electrons to break free of their bonds and leave their atoms. A hole is left behind in each case. These electrons, called free carriers, then wander randomly around the crystalline lattice looking for another hole to fall into and carrying an electrical current. However, there are so few of them in pure silicon that they aren’t very useful.
But the doped silicon with phosphorus atoms mixed is a different story. Phosphorus has five electrons in its outer shell, not four. It still bonds with its silicon neighbor atoms, but in a sense, the phosphorus has one electron that doesn’t have anyone to hold hands with. It doesn’t form part of a bond, but there is a positive proton in the phosphorus nucleus holding it in place. It takes a lot less energy to knock loose one of the “extra” phosphorus electrons because they aren’t tied up in a bond with any neighboring silicon atoms. As a result, most of these electrons do break free, and there are a lot more free carriers than there would be in pure silicon. N-type (n for negative) doped silicon is a much better conductor than pure silicon. The other part of a typical solar cell is doped with the element boron, which has only three electrons in its outer shell instead of four, to become P-type silicon. This means that instead of making four bonds of shared pairs of electrons with other silicon atoms, there is one open “hole.” P-type (p for positive) silicon is silicon doped with boron that turns it into a conductive material that readily accepts electrons when voltage is applied.
Electric field forms when the N-type and P-type silicon come into contact. A solar cell consists of a layer of p-type silicon placed next to a layer of n-type silicon. A solar cell is a p-n junction diode in its most basic form.
When light reaches the p-n junction, photons can readily pass through the thin n-type layer and into the junction. The particles in light energy supply the junction with enough energy to build a number of electron-hole pairs and due to local electrical field forces (p-n junction field), holes and electrons go to opposite sides. It is this electrical field that may separate electron from holes, leading to a positive potential difference (voltage) from the p to the n side of the junction.
The p-n junction will function like a tiny battery cell when the concentration of electrons increases on one side, i.e., the n-type side of the junction, and the concentration of holes increases on the other side, i.e., the p-type side of the junction. A voltage is established, which is referred to as photovoltage. If you connect the n-type and p-type layers with a metallic wire, the electrons will travel from the n-type layer to the p-type layer by crossing the depletion zone and then go through the external wire back of the n-type layer, creating a flow of electricity.
Note:
P-N junction field is due to diffusion of extra electrons of phosphorus and extra holes of boron across P-N junction. Photons of incoming light causes movement of silicon electrons from valence band into conduction band. All P-N junction field does is to separate silicon electron from holes to generate photovoltage.
_
-18. The maximum open-circuit voltage of a standard single junction silicon solar cell is around 0.5 to 0.6 volts whose dimensions are 10cm × 10cm × 0.3mm, consisting of a very thin layer of phosphorous-doped (n-type) silicon on top of a thicker layer of boron-doped (p-type) silicon. The voltage of a cell under load is approximately 0.46 volts, generating a current of about 3 amperes. The power that one cell produces is, in other words, approximately 1.38 watts (voltage multiplied by current). As a single solar cell has low power, voltage and current, we make series and parallel combinations of solar cells to get a solar module. Solar panels can be wired in series or in parallel to increase voltage or current respectively. A number of cells are wired together to form a solar panel or ‘module’ that can generate anything between 80–360 watts. Solar panels are classified according to their rated power output in Watts. This rating is the amount of power the solar panel would be expected to produce in 1 peak sun hour, i.e. 1000w/m2 irradiance throughout one hour. Most solar panels produce an output between 250 watts to 400 watts, i.e. Panel Size is 250 to 400 w, which generate electricity 0.25 to 0.4 kWh every hour in peak sun hours. Panel size is always in DC and inverter converts it into AC.
_
-19. The threshold energy to knock an electron out of its orbit from valence band into the conduction band is known as the band gap. Once in the conduction band, the extra energy in the electron can be harvested as electricity. The size of this energy bandgap matters because it impacts how efficiently solar cells convert light into electricity. Specifically, if photons hit the electrons with less energy than the electron needs to jump from the valence band to the conduction band, none of the light’s energy is captured. Alternatively, if the light has more energy than is needed to overcome that gap, then the electron captures the precise energy it needs and wastes the remainder. Both of these scenarios lead to inefficiencies in solar harvesting, making the choice of solar cell material an important one. The bandgap energy is 1.12 electron volts for silicon, that correspond to wavelength of 1100 nm. Any photon with energy greater than 1.12 eV can dislodge an electron from a silicon atom and send it into the conduction band, so any light with wavelength less than 1100 nm can knock electron out of silicon. The wavelengths of visible light occur between 400 and 700 nm, so they will generate electricity. Any radiation with a longer wavelength, such as microwaves and radio waves, lacks the energy to produce electricity from a solar cell. Very short wavelength photons (with an energy of more than about 3 eV) send electrons clear out of the conduction band and render them unavailable to do work. In short, PV cells are sensitive to light from the entire spectrum as long as the wavelength is above the band gap of the material used for the cell, but extremely short wavelength light is wasted.
Why can’t we choose a material with a really low band gap, so we can use more of the photons? Unfortunately, band gap also determines the strength (voltage) of the electric field, and if it’s too low, then what we make up in extra current (by absorbing more photons), we lose by having a small voltage. Remember that power is voltage times current. The optimal band gap, balancing these two effects, is around 1.4 eV for a cell made from a single material. Crystallin silicon had bandgap of 1.12 eV close to optimal 1.4 eV, and silicon is cheap and abundant. Gallium arsenide (GaAs) has a band gap of 1.42 eV, close to the value giving peak solar cell efficiency. Gallium arsenide is more costly than silicon since GaAs are much rarer and harder to get.
_
-20. Most solar modules are currently produced from crystalline silicon (c-Si) solar cells made of polycrystalline or monocrystalline silicon. Two key factors that contribute for this supremacy is the attractive bandgap energy of Silicon, at 1.12 eV and the abundance of high-quality material, due to an already scaled silicon-based semiconductor production for microchips. A key disadvantage of c-Si is its relatively poor ability to absorb light, which encourages the use of thick and brittle wafers. Crystalline silicon is the most common solar-cell substrate material, despite the fact that it is indirect bandgap and therefore does not absorb light very well. As such, they are typically hundreds of microns thick; thinner wafers would allow much of the light (particularly in longer wavelengths) to simply pass through. This shortcoming translates to high capital costs, low power-to-weight ratios, and constraints on module flexibility and design. In 2021, crystalline silicon accounted for 95% of worldwide PV production, while the rest of the overall market is made up of thin-film technologies using cadmium telluride (CdTe), copper indium gallium selenide (CIGS) and amorphous silicon (a-Si). Since its appearance, crystalline Silicon (c-Si) photovoltaic cells have increased in efficiency by 20.1%, from 6% when they were first discovered to the present efficiency record of 26.1%.
_
-21. Thin-film solar cells are made by depositing one or more thin layers (thin films or TFs) of photovoltaic material onto a substrate, such as glass, plastic or metal. Commercial thin-film PV technologies are represented primarily by cadmium telluride (CdTe), copper indium gallium diselenide (CIGS), and hydrogenated amorphous silicon (a-Si:H). These materials absorb light 10–100 times more efficiently than silicon, allowing the use of films just a few microns thick. Thin-film solar cells are made of direct band gap materials (such as amorphous silicon, CdTe, CIGS or CZTS), which absorb the light in a much thinner region, and consequently can be made with a very thin active layer (often less than 1 micron thick). Thin-film solar cells are typically a few nanometers (nm) to a few microns (µm) thick–much thinner than the wafers used in conventional crystalline silicon (c-Si) based solar cells, which can be up to 200 µm thick. Thin-film cells have several advantages over first-generation silicon solar cells, including being lighter, cheaper and more flexible due to their thin construction. This makes them suitable for use in building-integrated photovoltaics and as semi-transparent, photovoltaic glazing material that can be laminated onto windows. Other commercial applications use rigid thin film solar panels (interleaved between two panes of glass) in some of the world’s largest photovoltaic power stations. A key disadvantage of today’s commercial thin-film modules is their comparatively low average efficiency, typically in the range of 12%–15%, compared to 15%–21% for c-Si. Many thin-film technologies have been found to have shorter operational lifetimes and larger degradation rates than first-generation cells in accelerated life testing, which has contributed to their somewhat limited deployment.
_
-22. While first-generation PV cells based on crystalline silicon remain highly efficient and stable, second-generation thin-film technologies such as CdTe and CIGS offer advantages in terms of cost effectiveness and flexibility. Third-generation PV cells, including perovskite and tandem (multijunction) solar cells, hold great promise for achieving higher efficiencies and pushing the boundaries of solar energy conversion. These examples highlight the ongoing research and development efforts in the field of PV technologies, driving innovation and paving the way for more efficient and economically viable solar energy systems.
_
-23. Perovskites are a broad class of materials defined by the fact that they have a particular kind of molecular arrangement, or lattice, that resembles that of the naturally occurring mineral perovskite. They could be made much more cheaply than silicon or gallium arsenide and it forms extremely thin layers while still efficiently capturing solar energy. Solar-cell efficiencies of laboratory-scale devices using these materials have increased from 3.8% in 2009 to 25.7% in 2021 in single-junction architectures, and in silicon-based tandem cells, to 29.8%, exceeding the maximum efficiency achieved in single-junction silicon solar cells. Perovskite solar cells have been the fastest-advancing solar technology due to their superior semiconducting characteristics such as tunable band gap, high carrier mobility, high‐efficiency light absorption capability, and low manufacturing costs. Main issues in perovskite solar cells are film quality and thickness, and the perovskite material will break down quickly due to exposure of heat, moisture, snow etc. Researchers and scientists are actively working to improve the stability and scalability of these cells. By resolving these issues, perovskite solar cells could become a game-changer in the renewable energy industry, offering a cost-effective and efficient alternative to traditional silicon-based solar panels.
_
-24. In Concentrated Photovoltaics (CPV), mirrors or lenses are typically used to focus the incoming radiation on a receiver, that in turn are designed for a certain level of concentration, ranging from just above 1 sun, in Low Concentration Photovoltaics (LCPV), to 2000 suns and higher in High Concentration Photovoltaics (HCPV). As the intensity of the radiation increases, so does the temperature and hence decreases the electrical efficiency of the cell. Modern CPV systems operate most efficiently in highly concentrated sunlight (i.e. concentration levels equivalent to hundreds of suns), as long as the solar cell is kept cool through the use of heat sinks. Diffuse light, which occurs in cloudy and overcast conditions, cannot be highly concentrated using conventional optical components (i.e. macroscopic lenses and mirrors). Filtered light, which occurs in hazy or polluted conditions, has spectral variations which produce mismatches between the electrical currents generated within the series-connected junctions of spectrally “tuned” multi-junction (MJ) photovoltaic cells. Therefore, to produce equal or greater energy per rated watt than conventional PV systems, CPV systems must be located in areas that receive plentiful direct sunlight. This is typically specified as average DNI (Direct Normal Irradiance) greater than 5.5-6 kWh/m2/day or 2000 kWh/m2/yr.
CPV increases efficiency by:
(1. Third-generation solar cells boost efficiency through the integration of multi-junction device geometry to approximately 42% efficiency under one-sun illumination.
(2. In addition to creating more electron-hole pairs simply by increasing the number of photons available for absorption, having a higher concentration of charge carriers can increase the efficiency of the solar cell by increasing the conductivity. Along with a proportional increase in the generated current, there also occurs a logarithmic enhancement in operating voltage, in response to the higher illumination.
Concentrator photovoltaics and multijunction cells, both are employed in the highest-efficiency solar cell. As of 2024, the world record for solar cell efficiency is 47.6%, set in May 2022 by Fraunhofer ISE, with a III-V four-junction concentrating photovoltaic (CPV) cell. They enable a smaller photovoltaic array that has the potential to reduce land use, waste heat and material, and balance of system costs. The added costs of the solar tracking systems, the needed cooling systems, more so in higher levels of concentration, and the added device complexity can offset the benefits of reduced cell area, so the choice is once again in terms of the intended application. The rate of annual CPV installations has fallen to near zero since 2018 with the faster price drop in crystalline silicon photovoltaics.
_
-25. For solar cells, the efficiency of energy conversion is defined as the percentage of incident solar power that gets converted into electrical output power. Specifically:
Efficiency (%) = Electrical output power (W) / Incident solar power (W)
Under the same conditions, a panel with a higher efficiency will produce more electrical power than one with a lower efficiency. With standard sunlight exposure 1000W/m2, if output falls, efficiency falls and if output increases, efficiency increases. So, when we talk about efficiency of solar technologies, we have to keep standard irradiance of 1000W/m2 sunlight. Most polycrystalline panels on the market have an efficiency between 14 and 19%. Monocrystalline panels have a higher efficiency of up to 25%.
Shading and clouds decrease input energy (irradiance) and so output falls. Efficiency is same.
Concentrated sunlight increases input energy and so output increases. Efficiency is same.
However, in CPV, in addition to creating more electron-hole pairs simply by increasing the number of photons available for absorption, having a higher concentration of charge carriers can increase the efficiency of the solar cell by increasing the conductivity. Along with a proportional increase in the generated current, there also occurs a logarithmic enhancement in operating voltage, in response to the higher illumination. In CSP, higher concentration leads to higher temperatures resulting in better thermal efficiency although energy will be lost due to blackbody emission, and very high temperature affect material durability and maintenance.
No method of energy transformation is 100 per cent efficient. Plants convert sunlight into energy with an efficiency of around 5–6 per cent, and a fossil-fuel power plant is only around 30–50 per cent efficient—all the extra energy contained in the fuel it burns is emitted as heat, and effectively wasted. The electricity conversion efficiencies of wind turbines can achieve up to 59 percent efficiency, and hydropower systems can have efficiencies of up to 90 percent. The ultimate efficiency of a silicon photovoltaic cell in converting sunlight to electrical energy is around 20 per cent, and large areas of solar cells are needed to produce useful amounts of power. Higher Efficiency of solar technology leads to increased cost-effectiveness compared to traditional fossil fuel-based power plants, reduced environmental impact and enhanced energy security.
_
-26. Silicon, the most prevalent material in photovoltaic cells, has a band gap energy of approximately 1.12 eV, therefore only incident photons of equal or higher energy value will lead to the formation of charge carriers, and even so there are still thermalisation and recombination losses to consider. As only part of the solar spectrum meets the needed energy requirements for carrier formation, for a given semiconductor, the limitation becomes apparent. This limit, with an estimation of 29.4%, for silicon-based homojunction solar cells is the well-known Shockley–Queisser limit. The key concept of the SQ limit is that solar cells can only convert photons with energies equal to or greater than the band gap energy of the semiconductor into electricity. Photons with energies below the band gap energy cannot be absorbed, while photons with energies significantly above the band gap energy generate excess energy in the form of heat and not electricity. This limit takes into account not only bandgap energy but also factors such the temperature of the cell and the spectrum of sunlight incident on the cell. Importantly, it applies to ideal solar cells, meaning that practical solar cells have efficiencies even lower than the SQ limit due various factors. The Shockley–Queisser limit only applies to conventional solar cells with a single p-n junction; solar cells with multiple layers can (and do) outperform this limit, and so can solar thermal and certain other solar energy systems. In the extreme limit, for a multi-junction solar cell with an infinite number of layers, the corresponding theoretical limit is 68.7% for normal sunlight, or 86.8% using concentrated sunlight.
_
-27. With 1000 w/m2 standard irradiance, limit to solar cell efficiency exists due to several factors:
(1. Band gap losses
Light can be separated into different wavelengths with photons possessing a wide range of energies. Some of the photons don’t have enough energy to alter an electron-hole pair. Some of the photons have too much energy. Only a certain amount of energy, measured in electron volts (eV) and defined by the cell material (about 1.12 eV for crystalline silicon), is required to knock an electron loose. This is known as the band gap energy of the material. If a photon has more energy than the required amount, then the extra energy is lost (unless there is sufficient energy to create two electron-hole pairs). These two effects account for the loss of about 70% percent of the radiation energy incident on the silicon solar cell.
If a lower band gap material is used, the cell will produce more current (fewer photons lost), but the cell voltage is lowered, which leads to a loss in power. A balance has to be struck: the optimal band gap, balancing these two effects, is around 1.4 eV for a cell made from a single material.
(2. Metallic contact grid
The electrons have to flow from one side of the cell to the other through an external circuit. The back of the cell can be covered with a metal, to allow for good conduction, but the top needs to be kept as clear as possible because photons can’t get through an opaque conductor. The circuit could be run at the sides of the cells, but the electrons would have to travel too far to reach the contacts. The internal resistance of silicon is quite high and losses would therefore be high.
To minimise the losses, cells are typically covered by a metallic contact grid, made using silver paste as in the standard cell structure. It has to be thick enough to minimise resistance and shorten the distance that electrons have to travel, while still minimising coverage of the cell surface. Inevitably, some photons are blocked by the grid.
(3. Recombination
One way for electric current to flow in a semiconductor is for a “charge carrier,” such as a negatively-charged electron, to flow across the material. Another such charge carrier is known as a “hole,” which represents the absence of an electron within the material and acts like a positive charge carrier. When an electron encounters a hole, they may recombine and therefore cancel out their contributions to the electrical current. Direct recombination, in which light-generated electrons and holes encounter each other, recombine, and emit a photon, reverses the process from which electricity is generated in a solar cell. It is one of the fundamental factors that limits efficiency. Indirect recombination is a process in which the electrons or holes encounter an impurity, a defect in the crystal structure, or interface that makes it easier for them to recombine and release their energy as heat. Auger recombination is the prevalent intrinsic recombination process in silicon. Auger recombination limits the lifetime and ultimate efficiency. So a direct semiconductor like GaAs that allows greater light absorption with a bandgap value 1.42 eV close to the value giving peak solar cell efficiency would be preferable for photovoltaic energy conversion although direct semiconductor has faster radiative recombination.
Note:
Carrier separation (electron and hole separation) leads to electricity generation and carrier recombination leads loss of electricity generation. Anything that separates electrons and holes leads to increased efficiency of solar cell (e.g. PERC cell). Anything that recombines electrons and holes leads to reduced efficiency of solar cell.
(4. Temperature
Solar cells generally work best at low temperatures. Higher temperatures cause the semiconductor properties to shift, resulting in a slight increase in current, but a much larger decrease in voltage. Extreme increases in temperature can also damage the cell and other module materials, leading to shorter operating lifetimes. Since much of the sunlight shining on cells becomes heat, proper thermal management improves both efficiency and lifetime. The concentration of sunlight might cause spots with significantly increased temperature on the surface of the solar cell causing the formation of hot (overheated) spots which can hamper the functionality and the life span of the system.
(5. Cell series resistance
Series resistance means two or more resistors are said to be connected in series when the same amount of current flows through all the resistors. Series resistance in a solar cell has three causes: firstly, the movement of current through the emitter and base of the solar cell; secondly, the contact resistance between the metal contact and the silicon; and finally the resistance of the top and rear metal contacts. The higher the series resistance, the bigger the power losses due to heat. Many solar cells designed for concentrated light in fact have special features to reduce the series resistance, but the limits of design may still be dependent on the cell material. For silicon, for example, it is hard to create cells that would be efficient at concentration ratios higher than 200. The power loss will grow very rapidly as the concentration ratio increases. So, there is no sense to increase concentration infinitely because those efforts may not pay off in terms of useful power increase.
_
-28. Under standard irradiance of 1000 w/m2, the efficiency of solar cell can be increased by:
(1. Choosing right material: The intrinsic properties of the semiconductor base chosen, such as bandgap energy and carrier recombination velocity, represent inherent limitations to the performance of the cell. The optimal band gap is around 1.4 eV for a cell made from a single material. Crystallin silicon had bandgap of 1.12 eV close to optimal 1.4 eV, and silicon is cheap and abundant. Gallium arsenide (GaAs) has a band gap of 1.42 eV, close to the value giving peak solar cell efficiency. As a direct bandgap semiconductor GaAs can take in more of the sun’s spectrum, even the infrared part. This makes GaAs cells better at making energy from sunlight, even on cloudy days. Gallium arsenide (GaAs) is used for production of high efficiency solar cells. It is often utilized in concentrated PV systems and space applications. Single junction GaAs cell efficiency is up to 25%, and up to 28% at concentrated solar radiation. Special types have efficiency over 30%. Gallium arsenide is more costly than silicon since GaAs are much rarer and harder to get.
(2. Shortens the distance that electrons have to travel
(3. Reduce thickness of the semiconducting material. If photons have to travel a long way through the material, they lose energy through collisions with other particles and may not have enough energy to dislodge an electron.
(4. Reduce reflectivity of the solar cell: Anti-reflection coatings and textured surfaces help decrease reflection.
(5. Increase the likelihood of a photon-electron collision by patterning the silicon in solar cells in microscopic pyramid shapes
(6. Employing passivated emitter rear contact (PERC) technology. Passivated Emitter and Rear Contact (PERC) solar panels are used today in nearly 90 percent of solar panels on the market. They incorporate coatings on the front and back to capture sunlight more effectively and to avoid losing energy, both at the surfaces and as the sunlight travels through the cell. The coatings, known as passivation layers, are made from materials such as silicon nitride, silicon dioxide, and aluminium oxide. The layers keep negatively charged free electrons and positively charged electron holes apart, preventing them from recombining at the surface of the solar cell and wasting energy. Mono PERC panels can achieve efficiency rates of up to 22% or higher, making them one of the most efficient solar panel options available on the market.
(7. The utilization of bifacial solar cells. Bifacial solar panels provide a unique advantage in solar energy generation by capturing sunlight from both the front and back of the module and panels yield 5-30% more power than traditional panels.
(8. Use multi-junction solar cells by stacking multiple layers of different semiconductor materials on top of each other. Each layer absorbed a different portion of the solar spectrum, increasing the overall efficiency of light absorption and energy conversion. With this solution, it is possible to overcome the previous value of the Shockley–Queisser limit. Crystalline group IV (Si and Ge) and III–V compound semiconductors (GaAs, InP, and the numerous III–V alloys) are the best candidates for multijunction cells. Indeed, the highest-efficiency solar cells made are Ga0.5In0.5P/Ga0.99In0.01As/Ge triple-junction devices with concentrated efficiencies of ∼40%.
(9. Cooling the solar panel by proper thermal management improves efficiency as much of the sunlight shining on cells becomes heat.
_
-29. For optimum performance, a solar panel needs to be oriented in the direction perpendicular to direct sunlight. Performance varies depending on geographic location, time of day, the day of the year, amount of solar irradiance, direction and tilt of modules, cloud cover, shading, soiling, state of charge, and temperature.
_
-30. Solar panel angle or tilt:
The angle between the horizontal ground and the solar module is known as the solar panel tilt angle. This angle varies based on several factors, including the latitude of your location and the time of year. Fixed racks can hold modules stationary throughout the day at a given tilt (zenith angle). A good rule of thumb for maximum annual energy output is to tilt your panels at an angle equal to your latitude. The sun is lower in the sky at higher latitudes, which means solar panels are installed at a greater angle to receive direct sunlight while the sun is higher in the sky at lower latitudes, so solar panels are positioned at a lower angle to receive more sunlight. Also, the sun is higher in the summer and lower in the winter, so you can capture more energy during the whole year by adjusting the tilt of the panels according to the season.
Solar panel orientation or direction:
It is the direction of solar panels towards south or north or west or east etc. Fixed racks can hold modules stationary throughout the day facing a given direction (azimuth angle).
At noon, the sun’s light comes from the south in the Northern Hemisphere and from the north in the Southern Hemisphere. Solar panels should always face true south if you are in the northern hemisphere, or true north if you are in the southern hemisphere. By aligning your panels with true south rather than magnetic south, you can ensure optimal performance.
If you live in the Northern Hemisphere, the general recommendation is to orient your panels facing true south. By facing south, your solar panels are positioned to receive maximum sunlight exposure throughout the day. North-facing roofs are the most unfavourable option for solar panels, since they receive very little direct sunlight. In the northern hemisphere, north-facing roofs are the least ideal for solar production. Explore alternatives like ground-mounted solar or carport installations to make the most of the solar system for your home. With a south-facing roof, your solar panels will produce the greatest amount of energy overall, but east or west-facing roofs can also work well and will produce energy for a large portion of the day. Remember, effect of orientation is less pronounced as significant light energy is diffuse (reflected off clouds or ground or landscape), and this light energy is less effected by the orientation of the panel than the light arriving direct from the sun.
Note:
Direction/orientation is determined by azimuth angle and tilt is determined by zenith angle. The panels are normally oriented towards the Equator, at a tilt angle slightly less than the latitude of the site.
_
-31. As the majority of the energy is in the direct radiation, maximizing collection requires the Sun to be visible to the panels for as long as possible. The energy contributed by the direct beam drops off with the cosine of the angle between the incoming light and the panel (zenith angle). In addition, the reflectance (averaged across all polarizations) is approximately constant for angles of incidence up to around 50°, beyond which reflectance increases rapidly. A solar tracker is a device that orients a payload toward the Sun. Payloads are usually solar panels, parabolic troughs, Fresnel reflectors, lenses, or the mirrors of a heliostat. The purpose of a tracking mechanism is to follow the Sun as it moves across the sky keeping payloads in an optimum position perpendicular to solar radiation. Solar trackers increase the energy produced per module at the cost of mechanical complexity and increased need for maintenance. They sense the direction of the Sun and tilt or rotate the modules as needed for maximum exposure to the light. The installation of solar trackers can improve the performance of photovoltaic panels by up to 40%. Single-axis systems increase efficiency between 25% and 30%, while dual-axis trackers add between 5% and 10% more, which translates into greater solar energy generation.
Tracking is not used on residential rooftop installations.
The optics in concentrated solar applications accept the direct component of sunlight light and therefore must be oriented appropriately to collect energy. Tracking systems are found in all concentrator applications because such systems collect the sun’s energy with maximum efficiency when the optical axis is aligned with incident solar radiation.
_
-32. Elevated temperatures can change the properties of the semiconductors used in solar panels. This often leads to a slight rise in current but can result in a significant voltage drop, leading to reduced power generation. For every degree Celsius above 25°C (77°F), a solar panel’s efficiency typically declines by 0.3% to 0.5%. Solar panels are power tested at 25 C, so the temperature coefficient percentage illustrates the change in efficiency as it goes up by a degree. This decrease in efficiency can be significant in regions where temperatures rise dramatically during the day, such as deserts or tropical areas. In these environments, it’s best to select PV panels with a low-temperature coefficient. On average, monocrystalline panels have lower temperature coefficients than polycrystalline panels, which means they are less affected by heat. This is a major advantage in warm regions where hot temperatures can impact solar panel performance over time. Also, installing cooling systems and ensuring adequate ventilation can help mitigate the effects of heat on solar panel efficiency.
In contrast, cold environments can offer improved solar panel efficiency due to the favorable temperature conditions for PV cell performance. Lower temperatures lead to increased output voltage, boosting overall power generation. At freezing temperature (0 C), there is a 10% increase in voltage and at more extreme temperatures it can be as much as a 25% increase. Many areas in North America and Europe regularly get well below 0 C and the voltage increase can become substantial.
Even though solar panels are more efficient in cold weather, they don’t necessarily produce more electricity in the winter than in summer. In fact, during the winter, solar panels will produce an average of 50% less energy compared to the summer. Why? Because the sun is more directly overhead in summer months, a solar panel puts out more power than during the winter, when the sun’s rays are slanted so less intense, and the days are also shorter. Sunnier weather often occurs in the warmer summer months. In addition to fewer clouds, the sun is usually out for more of the day. So even though your panels may be less efficient in warm weather, they’ll still likely produce more electricity in summer than in winter.
Solar panels can reach temperatures around 66°C (150°F) or even higher under direct sunlight, far above ambient temperature, since a considerable portion of the sunlight that hits the cells converts into heat. Elevated temperatures can negatively impact solar panel efficiency, reducing energy production. Also, extremely high temperatures can damage the cells, reducing their operational lifespan. Proper installation and ventilation can help mitigate this issue for enhancing solar panels’ efficiency and longevity.
_
-33. When a solar panel is partially shaded, we intuitively think that the loss in power production is going to be proportional to the shaded area of the solar panel. This is not the case. Partial shading causes disproportional losses in energy production. In a series panel configuration, the impact of shading can be quite drastic. If even one panel is partially shaded, it can significantly reduce the output of the entire string. In some cases, shading 10% of a solar panel can reduce its output power to 0 Watts. For example, shading the bottom 6 cells of a 60-cell solar panel can cause a 100% loss in power production. When a solar panel is only partially shaded, the amount of power it produces does not only depend on how much of the solar panel is shaded, but also on which cells are shaded and the number of bypass diodes it has.
On the other hand, parallel configurations are a bit more resilient. If one panel is shaded, it only affects the production of that particular panel, not the whole array.
_
-34. Solar panels generate electricity by converting sunlight into electrical energy. While they can work under a range of weather conditions, their output is highest when they receive direct, unobstructed sunlight. During cloudy conditions, the amount of sunlight that reaches the panels is diminished, resulting in decreased power production. However, it’s important to note that solar panels do not entirely stop producing electricity on cloudy days. Solar radiation still reaches the earth’s surface, albeit in a diffused form, on overcast days. This diffused light can still be converted into electricity, although the output of this process is lower compared to clear conditions. Research also shows that certain types of solar panels, such as thin-film panels and panels equipped with micro-inverters, can perform better under these conditions by optimizing the capture and conversion of diffused light. Depending on the cloud cover and the quality of the solar panels, the output of the solar panels’ electricity production commonly drops from 10 to 25 percent or more compared to a sunny day.
_
-35. For maximum panel efficiency, the best weather conditions you’ll need include:
- Temperatures between 70 and 90°F
- Sunny days with minimal cloud cover
- Light breezes to keep the panels cool
- Low humidity
_
-36. The solar eclipse that passed over New York in April 2024 led to a sharp temporary drop (3000 to 600 MW) in power production from solar panels. While it didn’t disrupt the power grid because solar provides such a small amount of the state’s energy, the event illustrated the need to anticipate similar occurrences in future years as solar become more important in energy mix.
_
-37. Please don’t confuse kW and kWh of solar panel output. If you do, you may end up with a solar system that’s completely the wrong size. While solar system size is measured in watts/kilowatts, the amount of electricity a solar array generates is measured in kilowatt-hours. The nameplate wattage of solar panels is determined under ideal conditions that do not reflect real-world applications. For example, a 360 W panel may operate closer to 300 W when installed on a rooftop with average sunlight conditions. The sun shining on the panels stimulates the flow of electrons in a single direction, creating a direct current.
There are losses in converting the energy from the sun into DC power, and turning the DC power into AC power. This ratio of DC to AC is typically about 0.8. This means you convert about 80% of the DC power into AC power using inverter. Panel wattage 300W DC is converted into 300 X 0.8 = 240W AC
- Formula to calculate how many solar panels it takes to power a house:
To solve for the number of solar panels, we can write the equation like this:
(Daily electricity consumption watt-hour AC/ peak sun hours) / (panel wattage AC) = number of solar panels
- Formula to calculate AC electricity generated per day:
There are four variables: panel size, efficiency, peak sun hours and DC to AC factor in calculating electricity generated per day.
AC electricity kWh per day = panel size in square meter X efficiency X peak sun hours X 0.8
Another way of putting the same formula:
AC electricity kWh per day = panel size in kW X peak sun hours X 0.8
For example, 5kW system will actually generate 4 kW AC electricity every second i.e. 4 kWh per hour and 5 peak sun hour per day would amount to 20 kWh per day. All you need to know is peak sun hours in your location.
_
-38. Solar panel system cost includes solar panel cost plus other components and labour. The solar panels alone can cost between 80 cents to $1.80 per watt, depending on the type, size and application. Residential solar panels system cost $3.30 per watt including the cost of installation and of all the other equipment needed to get them producing energy and powering your home. While the initial cost of solar panel installation may seem substantial, it’s important to consider the long-term financial benefits. Despite the high initial cost, solar panels guarantee savings on electricity bills and reduce your reliance on your utility company. The average solar panel payback period is between 6 and 10 years. For most homeowners, solar panels are a worthwhile investment.
But solar isn’t right for everyone. If you already have low energy costs, your roof doesn’t face the right direction, or if it’s just not in your budget, a residential solar system might not be worth it for you.
As of October 2022, the average price of grid electricity in the US was 16.7 cents per kilowatt hour –– while the average cost of solar electricity was around 7 cents per kilowatt hour. The primary advantage of solar energy is that it freezes your energy costs at a low rate for 25+ years, effectively shielding you from energy price increases. Yes, solar requires a sizeable upfront investment, but, solar systems typically pay for themselves several times over their lifetime. Grid-tie solar is the best option if you want to offset your electricity bill and save money over the life of your system. Off-grid solar is best for delivering power to remote locations where there is no access to a utility line.
_
-39. Every sunny roof without solar panels is a missed opportunity. Everyone backs solar energy, but only a few have installed solar rooftop system. The biggest reason why people do not purchase solar panel is the need to pay more now to save more later. Rooftop solar provides huge future financial benefits but not immediate. People would change mind if their utility-generated electricity becomes very costly or erratic. India’s low uptake of rooftop solar systems is largely due to limited electricity consumption and existing subsidies for coal-fired electricity that makes even subsidized solar power expensive.
_
-40. Solar panels are difficult to relocate. Due to the size and delicate nature of solar arrays, it is next to impossible to relocate them. Dismantling and refitting of solar panels is a very complicated process. Transferring solar panels will need huge installation, maintenance, and transportation cost. Since solar panels use a lot of space and are tailored for a specific rooftop, chances are low that it can be installed properly on a new rooftop. Subsidies won’t be considered for the re-installation of solar panels. For homeowners who move around a lot, solar panels don’t seem like a good investment.
_
-41. According to analysis by the National Renewable Energy Laboratory, nearly 50% of households and businesses are unable to host rooftop solar systems. This may be because they don’t own their homes, have roof conditions that do not support a rooftop photovoltaic (PV) system due to shading, roof size, or other factors, or due to the upfront costs of installing home PV. They benefit from community solar farm that allow customers to purchase a share of the farm and the energy produced by that farm.
_
-42. Solar panels have an average degradation rate of 0.5 to 1% per year. This means that if you’ve had your panels for four years, your energy production will be 2 to 4 % less than when you installed them. After 20 years, your energy production will be 10 to 20 % less than when you got your panels. Prolonged exposure to high humidity and high temperature leads to increased power degradation rates. Solar panels last between 20 and 30 years. Some well-made panels may even last up to 40 years.
_
-43. Net metering is a billing mechanism that credits solar energy system owners for the electricity they add to the grid. By tracking the kilowatt-hours produced and consumed, it allows solar system owners to only pay for the net amount of electricity used. In net metering the price of the electricity produced is the same as the price supplied to the consumer, and the consumer is billed on the difference between production and consumption. Net metering is like using the grid for storage and the power grid acts as the customer’s battery backup, which saves the customer the added expense of purchasing and maintaining a battery system.
Feed-in tariffs means instead of getting a kilowatt-hour’s worth of credit for every kilowatt-hour your panels produce, you get a monetary credit that corresponds to the value of that energy. This value can be either higher or lower than the retail cost, and this rate can determine the viability of solar energy in the state. In many markets, the price paid for sold PV electricity is significantly lower than the price of bought electricity, which incentivizes self-consumption.
_
-44. Solar scams can take numerous forms, making them sometimes challenging to identify. Deceptive practices may include aggressive sales tactics, unrealistic promises, lack of transparency, or even identity theft. Scammers might exaggerate potential savings, misrepresent government incentives, or sell low-quality equipment at inflated prices.
_
-45. Solar panel output is reduced by the accumulation of dust, grime, pollen, and other particulates on the solar panels, collectively referred to as soiling. The effects of “soiling” (as it’s known in the solar industry) vary widely by location, but energy yield losses of 10 percent are not uncommon. Massachusetts Institute of Technology (MIT) research shows that dust gathering on solar panels can drastically reduce their output in a single month, and the researchers say that even a 3 to 4 percent reduction in solar power worldwide could lead to losses of up to $5.5 billion. Ideally solar panels should be cleaned every few weeks to maintain peak output.
_
-46. Solar panels work through all four seasons of the year, come rain or shine, or even hail or in light snow. All solar panels are waterproof. On a rainy day, a solar panel system’s performance is reduced by 40-90%, depending on how heavy the cloud cover is. But once the storm has passed, you’ll benefit from a good side effect: rain helps to clean solar panels.
_
-47. Solar panels themselves are not inherently fire hazards. In fact, they are designed with numerous safety measures in place, making them remarkably safe for everyday use. International data suggests that far fewer than 1 percent of all solar systems catch fire and one analysis suggests there may be about 0.03 fires per MW of solar power. Solar panel fires can be caused by improper installation or maintenance, and by damage from extreme weather events, such as hail or lightning.
_
-48. Solar energy production can be affected by season, time of day, clouds, dust, haze, or obstructions like shadows, rain, snow, and dirt. Solar energy is not always produced at the time energy is needed most. Peak power usage often occurs on summer afternoons and evenings, when solar energy generation is falling. Temperatures can be hottest during these times, and people who work daytime hours get home and begin using electricity to cool their homes, cook, and run appliances. Storage helps solar contribute to the electricity supply even when the sun isn’t shining. It can also help smooth out variations in how solar energy flows on the grid. The integration of energy storage systems with solar energy plays a vital role in maximizing its utilization and overcoming the intermittent nature of solar power generation. Energy storage technologies enable the capture and storage of excess solar energy during periods of high generation and release it when sunlight is unavailable, thus ensuring a more consistent and reliable power supply.
Photovoltaic self-consumption occurs when individuals or companies consume the energy produced by photovoltaic generation installations located close to the place in which that energy is consumed. Solar energy storage can increase the self-consumption of solar energy by up to 50% and significantly reduce grid reliance and curtailment of solar power.
_
-49. A solar power plant is based on the conversion of sunlight into electricity, either directly using photovoltaics (PV), or indirectly using concentrated solar power (CSP). High-capacity systems of over 100kW are called Solar Power Stations. A photovoltaic power station, also known as a solar park, solar farm, or solar power plant, is a large-scale grid-connected photovoltaic power system (PV system) designed for the supply of merchant power. Most solar parks are ground mounted PV systems. Concentrating Solar Power (CSP) technologies use mirrors, lenses and tracking system to concentrate (focus) the sun’s light energy and convert it into heat to create steam to drive a turbine that generates electrical power. It can easily be coupled to thermal energy storage (TES), so that energy collected during periods of high solar irradiance can be used to improve dispatchability (by compensating cloudy or overnight periods). The primary energy resource of the CSP technology is direct normal irradiance (DNI), which is typically available in subtropic regions and/or high altitudes. Two main challenges of building larger solar power plants are finding suitable land for construction and high upfront capital costs.
_
-50. Molten salt is used both as a heat transfer fluid (HTF) as well as a thermal energy storage medium. Molten salt can be employed as a thermal energy storage method to retain thermal energy collected by a solar tower or solar trough of a CSP plant so that it can be used to generate electricity in bad weather or at night. The system is predicted to have an annual efficiency of 93 to 99%, a reference to the energy retained by storing heat before turning it into electricity, versus converting heat directly into electricity. However, the efficiency of the energy transformation from heat to electricity is much lower, at around 50%. The molten salt mixtures vary. The most extended mixture contains sodium nitrate, potassium nitrate and calcium nitrate. When electricity is needed, the hot salt is pumped to a conventional steam-generator to produce superheated steam for a turbine/generator as used in any conventional coal, oil, or nuclear power plant. Molten salts lose only about 1 degree Celsius of heat a day in very well insulate tanks, so it is possible to store at 600°C – and top up – this thermal energy for months. Molten salt thermal energy storage can be heated and cooled daily for at least 30 years with round trip efficiency of 93 to 99%.
_
-51. The efficiency of a concentrating solar power (CSP) system will depend on the technology used to convert the solar power to electrical energy, the operating temperature of the receiver and the heat rejection, thermal losses in the system, and the presence or absence of other system losses; in addition to the conversion efficiency, the optical system which concentrates the sunlight will also add additional losses. The net annual solar-to- electricity efficiencies are 7-20% for power tower systems, and 12-25% for demonstration-scale Stirling dish systems. When it comes to solar photovoltaics, the conversion efficiencies of solar cells are in a similar range as CSP; most solar panels available on the market today have efficiencies between 14 and 23 percent.
_
-52. Two factors have contributed the most for the dominance of PV over CSP:
(1. PV can be installed almost everywhere CSP can, but not the other way around. Current commercial CSP technology needs higher levels of irradiance (typically those of the sunbelt countries), access to water (just like a coal plant) and large-scale deployments (typically more than 20 MW, compared with the few kW of a residential PV system).
(2. Technological simplicity has allowed the PV industry to focus on solving one issue — driving down the cost per Watt — while the CSP industry is spread across multiple challenges e.g. improving the optical efficiency of collectors, researching new heat transfer fluids or procuring higher efficiency turbines. The price per watt for solar PV has significantly decreased, while system efficiency has increased, making power generation through this source somewhat lucrative.
As of 2023, the total installed capacity of CSP was only 8.1 GW, while 1200 GW for solar PV.
On the other hand, CSP has two major advantages over PV: dispatchability and process heat.
(1. CSP can easily be coupled to thermal energy storage (TES), so that energy collected during periods of high solar irradiance can be used to improve dispatchability (by compensating cloudy or overnight periods). The effectiveness of CSP plants lies in their capabilities to store large amounts of thermal energy that are collected during the day using thermal energy storage, allowing the plant to store this energy and dispatch it during the night. As a result, CSP plants can deliver power on demand, giving them an economic advantage over other renewable energy technologies. This makes CSP a dispatchable form of solar. Molten salts can store the sun’s heat during the day and provide power at night or on demand.
(2. Heat generated by CSP can be used simply as a heat to run industrial processes. This is how solar energy could replace fossil fuels in high-temperature manufacturing processes. To manufacture materials like glass, steel, cement and ceramics, raw materials are heated to above 1,800 F (1,000 C). These industries are responsible for around 25% of global energy consumption.
_
-53. Utility-scale photovoltaic arrays are an economic investment when health and climate benefits are taken into account. Utility scale solar PV electricity is cheaper than coal, nuclear and gas, even without any subsidy. In a base comparison, without considering subsidies, fuel prices, or carbon pricing, utility-scale solar PV and wind have the lowest levelised cost of electricity (LCOE) of all sources. Utility-scale solar PV comes in anywhere from $24/MWh to $96/MWh without storage and $46/MWh to $102MWh with storage, while onshore wind registers the lowest possible LCOE over the shortest range, from $24/MWh to $75/MWh. Offshore wind’s LCOE ranges between $72/MWh and $140/MWh. For comparison, under the same criteria, gas peaking comes in at $115/MWh to $221/MWh, nuclear is $141/MWh to $221/MWh, coal is $68/MWh to $166/MWh, and gas combined cycle is $39/MWh to $ 101/MWh, according to Lazard 2023. Note that solar PV rooftop residential is from $117/MWh to $282/MWh in the US, far higher than utility scale; but levelized cost of rooftop solar generation is lowest in India ($66/MWh) and China ($68/MWh).
_
-54. The general idea holds that as production quantity increases, there is a predictable reduction in manufacturing cost. The initial demand for satellites fueled a so-called “virtuous cycle.” The more panels were produced for satellites, the more their price declined, and the more they were adopted for other niche purposes. As the cost further declined due to technology improvements and the rise of economies of scale, solar was able to eventually debut as a viable general-purpose energy source.
To satisfy increasing demand more solar modules get deployed, which leads to falling prices; at those lower prices the technology becomes cost-effective in new applications, which in turn means that demand increases. In this positive feedback loop solar technology has powered itself forward ever since its early days in outer space. Normally, this can’t continue. In earlier energy transitions – from wood to coal, coal to oil, and oil to gas – it became increasingly expensive to find fuel. But the main ingredient in solar cells (apart from energy) is sand, for the silicon and the glass.
With each doubling of the installed cumulative capacity the price of solar modules declines by 20.2%. There are many reasons why solar has experienced such high learning rates. Its simplicity, modularity and mass scale replicability allow for significant learning opportunities. The price of solar modules declined from $106 in 1976 to $0.38 per watt in 2019. A decline of 99.6%. Over four decades, solar power has transformed from one of the most expensive electricity sources to the cheapest in many countries.
Solar electricity got so cheap because solar technology got cheap. The same cannot be said about fossil fuel and nuclear power as there is a price of the fuel that they burn. In coal plants, supplying the coal accounts for about 40 percent of total expenses. Sunshine is free, which allows the costs of tapping into their power to decline sharply as technology improves and the industry grows. What is determining the cost of solar power is the cost of the power plant, the cost of the technology itself. Utility-scale solar arrays are now the least costly option to build and operate. Wind and hydro energy are constrained by high costs and location dependency, while solar energy is flexible, efficient and relatively inexpensive.
_
-55. LCOE could be misleading and misrepresenting facts. LCOE was originally developed to compare costs of dispatchable baseload nuclear and coal plants with the same capacity factors. LCOE is inappropriate for comparing intermittent generating technologies like wind and solar with dispatchable generation…and also overvalues intermittent generating technologies compared to dispatchable baseload generation. LCOE also ignores the need to overbuild wind and solar capacity to meet demand in deeply decarbonized systems. The advocates of wind and solar ignore imposed cost that include the need to keep baseload energy like coal or natural gas idling in case the wind or solar are not producing enough energy to meet demand.
_
-56. A solar-dominated future is likely to be metal and mineral-intensive. Solar panels often require rare materials like indium, gallium, and tellurium. The availability of these materials is limited, and their extraction can be environmentally damaging and expensive. The geopolitical supply reliability of critical minerals is also weak, since mineral production displays higher geographical concentration, compared to fossil fuels production. China and Democratic Republic of Congo, for example, own 60% and 70% of global production of rare earth minerals and cobalt respectively. A switch to a circular economy – which would see the components of old solar products recycled at the end of their lifecycle – is necessary for the solar energy sector to grow.
_
-57. Renewable energy is getting cheaper. Why aren’t electricity bills?
Solar panels and wind turbines make electricity at a low cost. The problem is, there aren’t enough of them. In 2023, in the United States, about 60% of grid electricity generation was from fossil fuels—coal, natural gas, petroleum, and other gases. About 19% was from nuclear energy, and about 21% was from renewable energy sources. That means the majority of the grid is susceptible to swings in oil prices, which can be influenced by wars across the globe, weather events and other chaos.
_
-58. The capacity factor of a power plant basically measures how often a plant is running at maximum power. Nuclear energy has by far the highest capacity factor of any other energy source. Nuclear power plants are producing maximum power more than 92% of the time during the year. That’s about nearly 2 times more as natural gas and coal units, and almost 3 times or more reliable than wind and solar plants. A typical nuclear reactor produces 1 gigawatt (GW) of electricity and requires 1.3 square miles (3.4km2) of land. That doesn’t mean you can simply replace it with a 1-gigawatt coal or solar plant. Based on the capacity factors, you would need almost two coal or three to four solar plants (each of 1 GW size) to generate the same amount of electricity onto the grid. Photovoltaic (PV) solar farms have relatively low capacity factors because unsurprisingly, the PV panels do not generate electricity at night or less on cloudy days. The capacity factor of solar PV varies from 17–28%. Thus, to generate the same amount of electricity as the 1 GW nuclear plant, a solar farm would need an installed capacity of 3.3–5.4GW, requiring between 45–75 square miles (116–200km2). Solar requires significantly more land than nuclear, and wind requires even more than solar.
_
-59. At 25–80% penetration of solar in the electricity mix by 2050, solar energy may occupy 0.5–5% of total land. Occupation of such large areas for PV farms could drive residential opposition as well as lead to deforestation, removal of vegetation and conversion of farm land. However, some countries, such as South Korea and Japan, use land for agriculture under PV and floating solar, together with other low-carbon power sources.
Given the fact that transitioning to low-carbon energy technologies would prevent millions of premature deaths each year from air pollution, and tackle climate change, a small increase in land use – especially on unproductive lands – seems like a reasonable price to pay. However, compared to fossil fuel, solar PV uses less land. In 2021, Carbon Tracker Initiative estimated the land required for solar panels alone to provide all global energy is 450,000 km2, 0.3% of the global land area of 149 million km2. But that is less than the land required for fossil fuels today, which in the US alone is 126,000 km2, 1.3% of the country.
Land that is not used and neither has potential for any other productive use from a human perspective, such as deserts and dry scrublands, can be suitable for solar energy. The amount of land required for a solar farm depends on various factors, such as the type of solar panels used, panel efficiency, types of mounting system, spacing, terrain and site characteristics, additional infrastructure, and local solar irradiance. In general, a rough estimate for the land area needed for a solar farm is about 4 to 6 acres per megawatt (MWDC) of installed capacity.
_
-60. Agrivoltaics is the dual use of land for solar energy production and agriculture. The term agrivoltaics is applied to dedicated dual-use technology, generally a system of mounts or cables to raise the solar array some three to five meters above the ground in order to allow the land to be accessed by farm machinery, or a system where solar panela are installed on the roofs of greenhouses. Because the sunlight is shared, system design requires trading off objectives such as optimizing crop yield, crop quality, and energy production. Recent studies show that, under certain conditions, the yield of agrivoltaic crops can be more compared to conventional crops, because of better water balance and evapotranspiration, as well as reduced temperatures. Agrivoltaics installation panels help to retain moisture in the soil and boost crop growth. Additionally, photovoltaic energy production potential is actually greater over croplands than other types of land because of the cooling effect of the crops’ evapotranspiration. By 2019, some authors had begun using the term agrivoltaics more broadly, so as to include any agricultural activity among existing conventional solar arrays. As an example, sheep can be grazed among conventional solar panels without any modification. On grazing lands, solar arrays increase the forage quality, the water and nutrient content of plant matter and reduce water demand. Agrivoltaics is a solution simultaneously to the food and energy global challenges. On the top of it, rainwater harvesting can be done by solar farms as a solution to water scarcity. Solar not only mitigate climate change but also mitigate water, food and energy scarcities.
_
-61. Floating solar photovoltaics (FPV) is using conventional solar panels installed on floating structures such as floats, pontoons or membranes, while the whole system is firmly anchored and connected to the electrical connection onshore. Floating solar capacity has grown hugely in the past decade, from 70 MWp in 2015 to 1,300MWp in 2020. Japan is investing heavily in floating solar farms because of limited land availability or very expensive land. Floating solar panels generate extra energy because of the cooling effect of the water they hover over. Floating solar plant is expected to generate up to 15 percent more energy than a land-based array.
_
-62. Solar panels could be installed in the spaces between railway tracks. There are over a million kilometers of railway lines in the world. By installing PV panels into rail beds, it is estimated that 100 kW of electricity could be generated per kilometer of rail line.
_
-63. Solar power does not lead to harmful emissions during operation, but the production of the panels creates some emissions. The term lifecycle emissions is important because it includes the carbon footprint of manufacturing solar panels (where most of its emissions come from) to decommissioning them at the end of their useful life. The life-cycle greenhouse-gas emissions of solar farms are less than 50 grams of carbon dioxide equivalent per kilowatt-hour, but with battery storage could be up to 150 g/kWh. Most estimates for concentrating solar power range from 36 to 90 grams of carbon dioxide equivalent per kilowatt-hour. In contrast, a combined cycle gas-fired power plant without carbon capture and storage emits around 500 g/kWh, and a coal-fired power plant about 1000 g/kWh. From cradle to grave, coal-fired electricity releases about 20 times more GHGs per kilowatt-hour than solar, wind, or nuclear electricity.
While solar panels are most often associated with producing very low-emission electricity, but by replacing fossil fuels they also benefit the environment in terms of land use, water use, noise pollution, and materials extraction with the sole exception of CSP plants with wet-cooling systems that have the highest water-consumption intensities of any conventional type of electric power plant.
Yes, solar energy has its downsides environmentally. Solar panels often contain trace amounts of heavy metals which can be harmful if not properly handled, sprawling solar farms can disrupt wildlife habitats, and solar panel recycling leaves a lot to be desired.
_
-64. When solar panels are installed to replace fossil fuel, an acre of solar panels saves 70 to 300 metric tons of carbon dioxide per year. An average acre of forest sequesters 0.84 metric tons of carbon dioxide per year. An acre of solar panels installed to replace fossil fuel reduces approximately 83 to 357 times more carbon dioxide per year than an acre of forest.
_
-65. An acre of solar panels produces roughly 33 to 37 times more energy than corn ethanol, even assuming a relatively high output per acre of corn. Today more than 30 million acres of farmland are effectively used to grow corn for ethanol in the U.S. and converting the land currently used for corn ethanol to solar power could meet all of the U.S. electricity needs.
_
-66. With an installed capacity of 1053 GW in 2022, solar energy is the second most installed renewable energy technology, following hydropower technology with 1392 GW. About half of installed capacity of solar is utility scale. CSP represented less than 1% of worldwide installed capacity of solar electricity plants. With 1,631 TWh, solar PV accounted for 5.5% the global electricity mix in 2023.
China’s relative contribution accounts for nearly 37% of the entire solar installation in 2022. China is expected to account for 50 percent of new global solar PV projects by 2024. China made so many solar panels that even its own grid can’t support all the energy produced. On the other hand, vast solar potential remains untapped. The sunniest countries have installed the least solar capacity. Japan has 13 times as many solar panels per person than India and 41 times as many as Egypt despite the fact that a solar panel in these two sunnier countries would produce 32% and 64% more electricity, respectively. Africa accounted for less than 1% of global installed solar capacity as of 2023. In parts of Africa, despite abundant sunlight, the solar adoption rates are low due to the high cost relative to the average income, and a lack of access to affordable financing options for both consumers and potential local solar companies.
_
-67. When comparing solar energy to fossil fuels, the following are key factors to be compared.
(1. Amount of emissions
(2. Renewability
(3. Cost
Solar beats fossil fuel in all 3 aspects. However solar is non-portable unlike oil and coal, non-dispatchable due to lack of grid-scale storage and not working equally well in all locations and all weathers. Solar is cheaper than fossil fuel even without subsidy when sun is shining, but once you include the cost of reliability, the price tag explodes. Biggest drawback of utility scale PV solar is lack of grid scale energy storage.
_
-68. The levelised cost of electricity (LCOE) of onshore wind is cheaper than solar, and wind emits less GHGs than solar on lifetime basis, yet solar energy technologies are going to become increasingly favored over wind technologies. Compared with solar power, wind farms require a vast area to be installed. Its manufacturing products, such as blades, foils, and rotors, are expensive. Besides, wind farms can be set up only in areas that have high wind speeds. Compared to the bulky and massive blades used in wind turbines, solar panels can be conveniently placed in almost any open space with direct sunlight availability. If solar was only possible at the utility scale, then it would suffer similar shortfalls to wind. But solar generation can be deployed from the kilowatt to the gigawatt scale, and that opens up many opportunities for deployment. On the other hand, wind turbines can generate energy even during the night, whereas solar cells need sunlight for energy generation and work only during the day.
Hybrid system that combines wind with solar PV offers several advantages over either single system. Wind speeds are low in the summer when the sun shines brightest and longest. The wind is strong in the winter when less sunlight is available. Because the peak operating times for wind and solar systems occur at different times of the day and year, hybrid systems are more likely to produce power when you need it. One potential solution to reduce grid-scale storage needs is the hybridization of different RE sources, such as solar-wind hybridization, since mixes of RE sources may manifest a lower variability or be better aligned with demand than the individual RE sources constituting the mix. India houses world’s largest solar-wind hybrid power plant totaling 2.14 GW in area of 11,500 acres.
_
-69. Solar projects can be built in substantially less time and at a much lower cost than a single nuclear project. Even when accounting for capacity factor and energy produced from a nuclear facility, large-scale solar farms remain much less expensive and quicker to bring online than nuclear. While nuclear power takes a long time to decommission, and poses issues with recycling radioactive waste and can potentially be dangerous to the population and the environment, solar does not pose any dangers to the population or contamination to the environment, and is very easy to take apart. Nuclear beats solar in two aspects: dispatchability and land requirement (vide supra). Utility scale solar PV is not dispatchable as it lacks grid scale energy storage system but a CSP plant can incorporate thermal energy storage which makes CSP a dispatchable form of solar.
_
-70. In terms of efficiency, hydro power conversion is better – modern hydro turbines can convert over 90% of the water’s energy into electricity. Solar panels remain less efficient, typically converting 15-20% of sunlight into power. The global weighted average cost of electricity from hydropower projects in 2022 was US$ 0.061/kWh, while solar PV $ 0.049/kWh.
The penetration of variable PV and wind power into conventional power grids may have a significant impact on the reliability of power systems. Hydropower is expected to play a critical role in peak shaving, frequency regulation, and energy storage, making it an excellent complement to intermittent renewable energy sources. Thus, developing hydro-PV-wind hybrid systems is a promising way to reduce power grid fluctuation caused by the intermittency of wind and PV power, and to accommodate more clean energy.
_
-71. The overwhelming majority of electricity produced worldwide is used immediately because traditional generators can adapt to demand and storage is usually more expensive. One significant challenge in integrating solar energy into electric grids is the intermittent nature of solar power. Solar energy depends on sunlight, and its production varies with weather conditions and time of day. This intermittency can create instability in the power grid, particularly if the share of solar power is significant. A solution to this challenge lies in energy storage technologies such as batteries and pumped hydro storage, that can address the intermittency challenge by storing excess energy during periods of high generation and releasing it during low generation periods.
Battery storage can solve intermittency problem for few hours. Batteries are by far the most common way for residential installations to store solar energy. Batteries can also be used at Utility-scale energy storage systems that have a typical storage capacity ranging from around a few megawatt-hours (MWh) to hundreds of MWh. Batteries typically only deliver power for few hours but it may not be economical to go far beyond that. If California wants to rely largely on renewable energy, it will have to handle weeklong periods where there’s no wind and little sun. Also, there’s far more solar power available in summer than in winter, and no battery today can store electricity for months to manage those seasonal disparities. That means additional long-duration storage technologies could be needed but pumped hydroelectric storage (PHS) is economically viable only if used on daily basis. As solar gets cheaper, it will see continued expansion, but accompanying that expansion will be the associated costs of reliable back-up generation, which today means natural gas. Even though natural gas is a fossil fuel, the expanded use of solar backed up by gas has considerable potential to reduce emissions, especially in places where that combo displaces coal generation. Worldwide coal can be replaced by solar & wind plus natural gas as backup generator.
_
-72. Power systems relying on a combination of baseload (i.e., coal, gas or nuclear) and variable (i.e., wind or solar PV) generation are considered difficult to operate. For the grid integration of variable renewables, we need a combination of measures such as more flexible generation capacity, grid-scale storage, more transmission, more flexible loads, and changed systems operations. Despite the fact that wind and PV generation costs are falling, traditional baseload generation can be expected to remain relevant for some decades while the transition of power systems worldwide is underway.
A fleet of CSP plants with molten salt storage is able to provide baseload electricity, and could do so at economically viable costs under some circumstance. This leads to the question whether CSP could therefore compete against nuclear as a supplier of clean baseload power. Thermal storage increased the capacity factor of the CSP plant from 37% to 65%, leading to more continuous and reliable power generation.
_
-73. Solar energy is increasingly being recognized as a powerful ally in emergency response scenarios. Solar systems, with their ability to generate electricity independent of the traditional grid, can provide a reliable source of energy when other options may not be available. They offer a renewable, scalable and, importantly, portable power solution that can be critical in the wake of a disaster.
_
-74. Perhaps the greatest challenge in solar energy is what photovoltaics cannot do. They cannot make fuel. The amount of sunlight that beams to Earth could more than supply all of humanity’s energy if we knew how to convert the energy of sunlight into liquid fuels, like petrol/diesel for cars. Plants, plankton, and algae can do it; they produce the fuel they need to grow from sunlight, water, and carbon dioxide. If we could do it, our energy problem is solved. Corn ethanol is not a solution as an acre of solar panels produces roughly 33 to 37 times more energy than corn ethanol, even assuming a relatively high output per acre of corn. We need solar fuel not biofuel.
_
-75. Solar panels can generate power only during the daytime, clouds often get in the way and much of the sunlight is absorbed by the atmosphere during its journey to the ground. That is why concept of collecting solar power up in space and beam it down to the surface came into existence. The biggest challenge is that – in order to generate optimal, economically-viable levels of solar power – the required structures need to be very large, both on Earth and in space. A single solar power satellite at geostationary orbit might extend more than a kilometre across, with the receiver station on the ground needing a footprint more than ten times larger for a microwave beam at 2.45 GHz. Shorter wavelengths have increased atmospheric absorption and even potential beam blockage by rain or water droplets.
The high costs and hard engineering problems that prevent us from building orbital solar-power systems today arise mainly from the enormity of these satellites and their distance from Earth, both of which are unavoidable consequences of the physics of this kind of energy transmission; not to mention temperature volatility, stability and intactness of solar arrays, and shaping & aiming the beam.
Energy is lost at each step in the conversion from sunlight to DC electricity, then to microwaves, then back to DC electricity and finally to a grid-compatible AC current. It will be hard to improve much on the 11 percent end-to-end efficiency seen in recent field trials at 2.45 GHz.
Electricity made this way would initially cost 12 to 80 times as much as power generated on the ground, and the first power station would require at least $275 billion in capital investment.
For the monumental task of electrifying everything while reducing greenhouse gas emissions, it’s better to focus on solutions based on technology already in hand, like conventional nuclear, wind, hydro and Earth-based solar, rather than wasting time, brainpower, and money on a fantasy of space based solar power.
_
-76. Car sizes vary a lot, but a full-size car in the U.S. is about 18 feet long and 6 feet wide, so it has about 100 to 110 square feet (9 to 10 square meters) of horizontal surface. That would collect roughly 9000 W and with 20% PV efficiency, it comes to 1800 watts or 2.4 horsepower, given current PV efficiencies; while average horsepower for a car is anywhere from 100hp to 200hp. It, therefore, seems difficult to envision a solar powered vehicle in near future for common people. There is considerable military interest in solar unmanned aerial vehicles (UAVs) as solar power would enable these to stay aloft for months, becoming a much cheaper means of doing some tasks done today by satellites.
______
Dr. Rajiv Desai. MD.
August 20, 2024
______
Postscript:
Energy shortage and fresh water scarcity are two key challenges for global sustainable development. My last article on ‘Desalination’ help resolve fresh water scarcity and this article on ‘Solar Technologies’ help resolve energy shortage and climate change.
______
16 comments on “Solar Technologies”
Leave a Reply

eneowp
Рекомендую обратиться к проверенным хакерам за услугой – Взлом vk
Hey people!!!!!
Good mood and good luck to everyone!!!!!
I’ve never commented on a blog post before, but I couldn’t resist after reading yours. It was just too good not to!
Your writing style is so engaging and easy to follow. I couldn’t stop reading once I started your blog post!
Your blog post was so relatable – it’s like you were reading my mind! Thank you for putting my thoughts into words.
Your blog post was exactly what I needed to read right now. It’s amazing how you always seem to know just what to say.
Your blog post was like a crash course in [topic]. I feel like I learned more in five minutes than I have in months of studying.
Your blog post was so relatable – it’s like you were reading my mind! Thank you for putting my thoughts into words.
Your blog post was like a warm hug on a cold day. Thank you for spreading positivity and kindness through your words.
Your blog post was a much-needed dose of inspiration. Thank you for motivating me to chase my dreams.
Your blog post was the highlight of my day. Thank you for brightening my inbox with your thoughtful insights.
Your blog post was like a breath of fresh air. Thank you for reminding me to slow down and appreciate the beauty of life.
Your blog post was like a crash course in [topic]. I feel like I learned more in five minutes than I have in months of studying.
Your blog post was like a warm hug on a cold day. Thank you for spreading positivity and kindness through your words.
Your blog post was a much-needed reminder to slow down and appreciate the little things in life. Thank you for the dose of positivity!