Dr Rajiv Desai
An Educational Blog
The Enigma of COVID-19:
The Enigma of COVID-19:
_____
Caveat:
Medicine is an ever-changing science. As COVID-19 pandemic is continuing worldwide, new research and clinical experience broaden our knowledge and necessitates changes in prevention and treatment. I have quoted sources believed to be reliable in their efforts to provide information that is complete and generally in accord with the standards accepted at the time of publication of this article. However, in view of the possibility of human error or changes in medical sciences, readers are encouraged to confirm the information contained herein with other sources.
______
Prologue:
An epidemic happens when a disease spreads between large numbers of people in a short period of time. When an epidemic goes global, it is called a pandemic. The 1918 influenza pandemic was the deadliest event in human history (50 million or more deaths, equivalent in proportion to 200 million in today’s global population). For more than a century, it has stood as a benchmark against which all other pandemics and disease emergences have been measured. Global health experts have been saying for years that another pandemic rivalling the speed and severity of the 1918 influenza epidemic wasn’t a matter of if but when. We should remember the 1918 pandemic as we deal with yet another infectious-disease emergency: the growing pandemic of novel coronavirus infectious disease (COVID-19), which is caused by the severe acute respiratory syndrome coronavirus 2 (SARS-CoV-2). This virus spread in China since December 2019 and exported to many countries, and has been seeding more than two secondary cases for every primary case.
The current coronavirus disease, COVID-19, has been called a once-in-a-century pandemic. But it may also be a once-in-a-century evidence fiasco. As the coronavirus pandemic takes hold, we are making decisions without reliable data. At a time when everyone needs better information, from disease modelers and governments to people quarantined or just social distancing, we lack reliable evidence on how many people have been infected with SARS-CoV-2 or who continue to become infected. Better information is needed to guide decisions and actions of monumental significance and to monitor their impact. The data collected so far on how many people are infected and how the pandemic is evolving are utterly unreliable. Given the limited testing to date, some deaths and probably the vast majority of infections due to SARS-CoV-2 are being missed. We don’t know if we are failing to capture infections by a factor of 10 or 100. Five months after the outbreak emerged, most countries, including the U.S., lack the ability to test a large number of people and countries have no reliable data on the prevalence of the virus in a representative random sample of the general population. This evidence fiasco creates tremendous uncertainty about the risk of dying from COVID-19. Reported case fatality rates, like the official 3.4% rate from the World Health Organization, cause horror — and are meaningless. Patients who have been tested for SARS-CoV-2 are disproportionately those with severe symptoms and bad outcomes. As most health systems have limited testing capacity, selection bias may even worsen in the near future. So far, there is no approved medical treatment for the virus and no vaccine. Social distancing and wearing mask are the only tool we have, and we know that we can’t maintain it indefinitely.
Draconian countermeasures have been adopted in many countries. If the pandemic dissipates — either on its own or because of these measures — short-term lockdowns may be bearable. How long, though, should measures like these be continued if the pandemic churns across the globe unabated? How can policymakers tell that they are doing more good than harm? Money has to be earned, rent has to be paid, food has to be put on the table. Housing volatility and food insecurity are also dangerous and deadly. What happens if small businesses are forced to close en masse? What becomes of all those workers? What happens to their families? India is facing exodus of 140 million migrant workers trapped in lockdown without job & money. Furthermore, what happens to the educational system when schools finally open? What about the lost time that students have suffered? What about all the students who didn’t have the technology to fully participate digitally?
The global coronavirus pandemic has prompted a wide range of responses by governments around the world. China has instituted severe lockdowns, which South Korea has avoided in favour of widespread testing and surveillance, while Sweden has pursued a much more relaxed approach altogether. UK has pursued a strategy guided heavily by disease modelling of using social distancing to slow the spread of the virus and stop the health service being overwhelmed, while waiting for the development of a vaccine or natural herd immunity. How can the experts be so profoundly at odds? The COVID-19 pandemic has highlighted just how many ways that scientists and academic experts can disagree. The disease was first spotted by epidemiologists who identified a SARS-like virus that appeared to have emerged from live animals held in a “wet market”. These markets are still the subject of much scrutiny. But other scientists have since argued that the virus probably began elsewhere, as data suggests many of the first patients probably caught the disease before people in the market were infected. Disease experts also appear to differ on exactly what measures are needed to tackle the virus. Despite a sophisticated system for gathering scientific advice, the UK government was initially criticized by hundreds of scientists for not enforcing sufficient social distancing. New modelling data convinced the government to recommend changing tactics and moving to a lockdown. But some public health specialists are still arguing that the overall strategy being pursued by the UK and some other countries of trying to suppress rather than eliminate the virus is wrong. In complete contrast, Sweden’s state epidemiologist has expressed skepticism with regard to lockdowns. We even have pathologists saying the level of threat of the virus may have been overestimated. What’s going on here, and why the stark difference of opinion? This is more than just people not sharing the same worldviews. The problem may instead lie in the interpretation of what counts as fact. Experts in different fields tend to hold different beliefs about cause and effect and draw on different sources of evidence in support of their various claims.
I have taken a different approach.
First, I will narrate overview of the disease itself and then I discuss points on which experts and governments differ. I will present both sides of the story and quote many studies, some of which are not peer reviewed and randomized controlled trials. My job is to save lives, from the disease itself and also from hardships faced by poor people due to draconian measures taken by governments.
Some points to ponder:
Is it from animal to human or lab to human?
Are there different viral strains? Is virus mutating fast?
Are RAAS inhibitors harmful or helpful in patients with Covid-19?
Is there high/low viral load and viral shedding?
Is it highly contagious? Transmission from asymptomatic/pre-symptomatic?
Is it droplet or airborne transmission?
How long is the viability of virus in environment?
Are we testing enough?
Are antibodies tests helpful or misleading?
Is statistics reliable on CFR and R0?
Does HCQ work?
Are masks useful?
Is lockdown helpful or harmful?
Are we neglecting herd immunity?
Does weather modify spread of virus?
Are children immune to Covid-19?
Is it relapse or reinfection?
What is better, ventilators or nasal oxygen?
_____
_____
Abbreviations and synonyms:
SARS-CoV-2 = severe acute respiratory syndrome coronavirus 2
COVID-19 = Corona Virus Disease-2019
MERS = Middle East Respiratory Syndrome
SARS-CoV = SARS-CoV-1 = SARS-classic corona virus
ACE2 = angiotensin-converting enzyme 2.
HCoV = human coronavirus
RBD = receptor binding domains
S = spike protein
ORF = open reading frame
RT-PCR = reverse transcription-polymerase chain reaction
PPE = personal protective equipment
RAAS = renin angiotensin aldosterone system
R0 = reproduction number
CFR = case fatality rate
IFR = infection fatality rate
CQ = chloroquine
HCQ = hydroxychloroquine
_____
Glossary and Terminology:
_
Social distancing: Social distancing means any measures taken to increase physical space between people to slow or prevent the spread of the virus. This involves avoiding public gatherings, limiting the number of visitors to your home, staying at home more often, keeping a safe distance from other people and catching up with friends and family virtually instead of in person. If you have to be around people, maintain a distance of 2 meters or 6 feet from others around you as much as possible. Not just mass gatherings, but even shopping malls, stadiums, and movie theatres can make you a target.
_
COVID-19: CoronaVirus Disease of 2019. This acronym was created by the World Health Organisation. It stands for the respiratory illness caused by the coronavirus SARS-CoV-2.
_
SARS-CoV-2: Severe Acute Respiratory Syndrome Corona Virus 2; final official name for the coronavirus that causes COVID-19. (This virus was previously known as 2019-nCoV.) SARS-CoV-2 is the name of the virus and COVID-19 is the name of the disease.
_
Flattening the curve: Slowing a virus’s spread to lower the peak number of cases, hence reducing the burden on the infrastructure and the demands on hospitals. Flatten the curve means change the steep upward curve on a graph of new disease cases to a flatter, shallower upward curve over a longer time period through measures such as social distancing. Authorities hope that by introducing social distancing they will be able to flatten the curve and avoid hospitals being rapidly overwhelmed with new cases.
_
Incubation period: The time taken by the symptoms to first appear on an infected individual. The incubation time for COVID-19 ranges from 2-14 days, most commonly being around 5 days.
_
“Medium-risk” individuals: People are considered “medium risk” individuals if they have recently traveled to a country with the widespread sustained transmission of COVID-19 or have had close contact or traveled in a plane with individuals showing symptoms of COVID-19. Self-isolation is advised for people in the “medium risk” category.
_
PPE: PPE or personal protective equipment includes face masks, goggles, protective gowns, aprons, overalls, and respirators. Hospitals need to be adequately equipped with these items to protect healthcare workers and frontline workers.
_
Underlying condition: A chronic health issue such as high blood pressure, diabetes, heart failure, HIV, cancer or chronic lung diseases. These health issues when present in an individual, make them more susceptible to the complications of COVID-19, when infected.
_
Isolation and Quarantine: Isolation and quarantine help protect the public by preventing exposure to people who have or may have a contagious disease. Isolation separates sick people with a contagious disease from people who are not sick. Quarantine separates and restricts the movement of people who were exposed to a contagious disease to see if they become sick. For centuries it’s been common for ships arriving from infected areas to be kept in quarantine at the docks, originally for 40 days which is where the term comes from.
_
Screening: testing of people for the presence of a disease. For COVID-19 the first step in screening is usually taking a person’s temperature.
_____
_____
Quantification of viral load:
Viral load is typically reported as copies of virions in a milliliter (ml) of blood. Changes in viral load are usually reported as a log change (in powers of 10). For example, a three log increase in viral load (3 log10) is an increase of 103 or 1,000 times the previously reported level, while a drop from 500,000 to 500 copies would be a three-log-drop (also 3 log10).
In a real time PCR assay a positive reaction is detected by accumulation of a fluorescent signal. The Ct (cycle threshold) is defined as the number of cycles required for the fluorescent signal to cross the threshold (i.e. exceeds background level). Ct levels are inversely proportional to the amount of target nucleic acid in the sample (i.e. the lower the Ct level the greater the amount of target nucleic acid in the sample). So Ct values are inversely proportional to the virus copy number.
Cts < 29 are strong positive reactions indicative of abundant target nucleic acid in the sample
Cts of 30-37 are positive reactions indicative of moderate amounts of target nucleic acid
Cts of 38-40 are weak reactions indicative of minimal amounts of target nucleic acid which could represent an infection state or environmental contamination.
_______
_______
Introduction to Covid-19:
_
Viruses:
Viruses are the most abundant biological entities on the planet. There are an estimated 1031 viruses on earth, most of which are bacteriophages (Breitbart and Rohwer 2005). Humans have been infected by viruses throughout their evolutionary history and it seems likely that viruses have played a role in human evolution (Van Blerkom 2003). Viruses are a significant cause of morbidity and mortality around the world and can be transmitted via air, food, water, or by direct contact with contaminated body fluids. Viruses can enter the body through various sites including the respiratory and enteric tracts by aerosolized droplets, droplet nuclei, or the fecal–oral route. Understanding the epidemiology and pathogenesis of viral infections, and the hosts’ immune response to such infections are key to the control and prevention of viral diseases and to the development of vaccines. Determining the minimum dose of virus particles that can initiate infection, termed the minimum infective dose (MID), and the factors influencing this dose are important for the development of risk assessment models in the fields of food and water treatment and the implementation of appropriate infection control strategies to prevent viral transmission in healthcare settings.
As obligate intracellular parasites, viruses must invade host cells to initiate infection whether in cultured tissues or in the body of the host. Infections in humans normally require extensive viral replication in order to be detected due to the limited sensitivity of diagnostic methods. Typically direct detection of infectious progeny viruses in body products such as nasal secretions, blood and faeces, or host responses such as antibody production have been used to monitor viral infections in experimentally infected humans. The doses of virus administered are usually determined from cell culture infectivity assays where the presence of the infectious virus is detected by its ability to cause changes in cell appearance or even cell destruction throughout a monolayer of cells (cytopathic effect) or in restricted regions of the monolayer (plaque formation). These viral doses are then expressed either as the dilution of virus sufficient to cause cytopathic effect in 50% of the inoculated culture (TCID50) or as plaque-forming units (pfu) (Ward et al. 1984a). The TCID50 (Median Tissue Culture Infectious Dose) is one of the methods used when verifying viral titer. TCID50 signifies the concentration at which 50% of the cells are infected when a test tube or well plate upon which cells have been cultured is inoculated with a diluted solution of viral fluid.
_
General Explanation of the Disease:
The World Health Organization (WHO) originally called this illness “novel coronavirus-infected pneumonia (NCIP), and the virus itself had been provisionally named “2019 novel coronavirus (2019-nCoV). On 11 February 2020, the WHO officially renamed the clinical condition COVID-19 (a shortening of COronaVIrus Disease-19). Coincidentally, on the same day, the Coronavirus Study Group of the International Committee on Taxonomy of Viruses renamed the virus “severe acute respiratory syndrome coronavirus 2” (SARS-CoV-2). The names of both the disease and the virus should be fully capitalized, except for the ‘o’ in the viral name, which is in lowercase. In this article, covid-19, Covid-19 and COVID-19 are used interchangeably. The official virus name is similar to SARS-CoV, the virus strain that caused epidemic severe acute respiratory syndrome (SARS) in 2002-2004, potentially causing confusion. The WHO has stated it will use “COVID-19 virus” or the “virus that causes COVID-19” instead of its official name, SARS-CoV-2, when communicating with the public. In this article SARS-CoV-2 is the name of virus causing Covid-19, while SARS-CoV and SARS-CoV-1 are synonymous with SARS-classic.
_
COVID-19 is the respiratory disease caused by the SARS-CoV-2 virus that has caused outbreaks worldwide. The SARS-CoV-2 is a new variant in the beta coronavirus family (Fisher 2020). It transmits by direct contact or contact with fomites and can be suspended in air as well, as are the related beta coronaviruses SARS, MERS, and the four known Human coronaviruses – OC43, 229E, NL63, and HKU1. The majority of infection transmissions are believed to be by droplet spray from coughing and sneezing and by direct contact or contact with fomites.
A novel β-coronavirus (SARS-CoV-2) caused severe and even fetal pneumonia explored in a seafood market of Wuhan city, Hubei province, China, and rapidly spread to other provinces of China and other countries. The SARS-CoV-2 was different from SARS-CoV, but shared the same host receptor the human angiotensin-converting enzyme 2 (ACE2). The natural host of SARS-CoV-2 may be the bat Rhinolophus affinis as SARS-CoV-2 showed 96.2% of whole-genome identity to Bat CoV RaTG13. The person-to-person transmission routes of SARS-CoV-2 included direct transmission, such as cough, sneeze, droplet inhalation transmission, and contact transmission, such as the contact with oral, nasal, and eye mucous membranes. SARS-CoV-2 can also be transmitted through the saliva, and the fetal–oral routes may also be a potential person-to-person transmission route.
__
Coronaviruses (CoVs) belong to the family of Coronaviridae, the order Nidovirales, and the genus Coronavirus. They are the largest group of viruses causing respiratory and gastrointestinal infections. Morphologically, CoVs are enveloped viruses containing a non-segmented positive-sense, single-stranded ribonucleic acid (RNA) viruses. CoVs are categorized into four important genera that include Alphacoronavirus, Betacoronavirus, Gammacoronavirus, and Deltacoronavirus. A novel member of human CoV that has recently emerged in Wuhan, China, is now formally named as SARS-CoV-2. This is a unique strain of RNA viruses that have not been previously observed in humans. The virus has wide host adaptability and is capable of causing severe diseases in humans, masked palm civets, mice, dogs, cats, camels, pigs, chickens, and bats. The SARS-CoV-2 typically causes respiratory and gastrointestinal sickness in both humans and animals. It can be transmitted through droplets, aerosols and direct/indirect contact, as well as during medical cases and laboratory sample handling. Specific structural proteins, which might be found on the surface of the virus, play an important role in the pathogenesis and development of the complications. The disease is characterized by distinct medical signs and symptoms that include high fever, chills, cough, and shortness of breath or difficulty in breathing. The infected people may also present with other symptoms such as diarrhea, myalgia, fatigue, expectoration, and hemoptysis. It is important from the public health and economic point of view as it affects the growth of the country, which is majorly attributed to the restriction in the movement of the people and the cost associated with the control and prevention of the disease. Since there is no specific therapeutic intervention nor a vaccine available against the virus, supportive management and treatment with non-specific therapeutic agents (repurposed drugs) may provide relief to the patients. Some preventive strategies of the disease include blocking the routes of transmission of the infections, disinfection of instruments used during medical case handling, using personal protective equipment, proper and early diagnosis of the disease, avoiding contact with the sick patients, and quarantine of the infected/exposed people.
____
People infected with the novel coronavirus can have markedly different experiences. Some report having nothing more than symptoms of a mild cold; others are hospitalized and even die as their lungs become inflamed and fill up with fluid. How can the same virus result in such different outcomes? In the worst cases of Covid-19, the virus not only attacks and destroys tissue in the lungs but also triggers an overreaction of the immune system, creating dangerous levels of inflammation. Many of these patients are left unable to breathe on their own, and some die in hospital intensive care units, or at home. For others with milder Covid cases, a hospital stay might end without the need for artificial ventilation, and they go home after being treated for pneumonia. Many more are riding out this illness at home, in bed with fevers, striving to isolate themselves from the rest of their household. Still more people — perhaps between 25 and 50 percent of all infected — feel no Covid-19 symptoms at all. This huge range of severity of Covid-19 cases is part of what makes it such a horrific health crisis. The mild or asymptomatic cases can spread the disease to the most vulnerable, who may suffer greatly and, in some cases, even die.
____
In any crisis, leaders have two equally important responsibilities: solve the immediate problem and keep it from happening again. The COVID-19 pandemic is an excellent case in point. The world needs to save lives now while also improving the way we respond to outbreaks in general. The first point is more pressing, but the second has crucial long-term consequences. The long-term challenge—improving our ability to respond to outbreaks—isn’t new. Global health experts have been saying for years that another pandemic rivalling the speed and severity of the 1918 influenza epidemic wasn’t a matter of if but when.
There are two reasons that COVID-19 is such a threat. First, it can kill healthy adults in addition to elderly people with existing health problems. The data so far suggests that the virus has a case fatality risk around 1%; this rate would make it several times more severe than typical seasonal influenza and would put it somewhere between the 1957 influenza pandemic (0.6%) and the 1918 influenza pandemic (2%).
Second, COVID-19 is transmitted quite efficiently. The average infected person spreads the disease to two or three others. That’s an exponential rate of increase. There is also strong evidence that it can be transmitted by people who are just mildly ill or not even showing symptoms yet. This means COVID-19 will be much harder to contain than Middle East Respiratory Syndrome (MERS) or Severe Acute Respiratory Syndrome (SARS), which were only spread by those showing symptoms and were much less efficiently transmitted. In fact, COVID-19 has already caused 10 times as many cases as SARS in just a quarter of the time.
_____
Before the 2002-to-2003 severe acute respiratory syndrome (SARS) epidemic, coronaviruses were somewhat neglected in human medicine, but they have always been of considerable importance in animal health. Coronaviruses infect a variety of livestock, poultry, and companion animals, in whom they can cause serious and often fatal respiratory, enteric, cardiovascular, and neurologic diseases. Most of our understanding about the molecular pathogenic properties of coronaviruses has been achieved by the veterinary virology community. Coronaviruses are well equipped to adapt rapidly to changing ecological niches by the high mutation rate of their RNA genome (about 10−4 nucleotide substitution/site/year) compared to host cell and high recombination frequencies. Many animal coronaviruses cause long-term or persistent enzootic infections. Long periods of coronavirus infection combined with a high mutation and recombination rate increase the probability that a virus mutant with an extended host range might arise. The current emergence of the SARS-CoV-2 is an example of a crossing of the animal-human species barrier. It is likely that the SARS-CoV-2 was enzootic in an unknown animal or bird species before suddenly emerging as a virulent virus for humans.
Over the past few decades, a large number of people have been affected with the 3 epidemics caused by coronavirus family (SARS-2002, MERS-2012, and COVID-2019) in the world. Nevertheless, there is substantial genetic dissimilarity between pathogens of the three previous epidemics, in particular MERS with COVID-19. In the previous epidemics, initial hotspots of diseases were Middle East, Saudi Arabia (MERS) and China and animal to human, and then human to human transmissions of pathogens were reported in other countries.
The 2019–20 coronavirus pandemic is an ongoing pandemic of coronavirus disease 2019 (COVID-19) caused by severe acute respiratory syndrome coronavirus 2 (SARS-CoV-2). The outbreak was identified in Wuhan, China, in December 2019, declared to be a Public Health Emergency of International Concern on 30 January 2020, and recognized as a pandemic by the World Health Organization on 11 March 2020. As of June 5, 2020, more than 6.42 million cases of COVID-19 have been reported in 210 countries and territories, resulting in more than 383,000 deaths. The case fatality rate was initially estimated to be 4 per cent in China, but varies significantly between countries, and now < 1% worldwide.
The virus is primarily spread between people during close contact, often via droplets produced by coughing, sneezing, or talking. While these droplets are projected into the air upon exhalation, they usually fall to the ground or onto surfaces rather than being infectious over long distances. People may also become infected by touching a contaminated surface and then their face. The virus can survive on surfaces for up to 72 hours. It is most contagious during the first three days after the onset of symptoms, although spread may be possible before symptoms appear and in later stages of the disease. Common symptoms include fever, cough and shortness of breath. Complications may include pneumonia and acute respiratory distress syndrome. The time from exposure to onset of symptoms is typically around five days, but may range from two to fourteen days. There is no known vaccine or specific antiviral treatment. Primary treatment is symptomatic and supportive therapy.
Recommended preventive measures include hand washing, covering one’s mouth when coughing, maintaining distance from other people, and monitoring and self-isolation for people who suspect they are infected. Authorities worldwide have responded by implementing travel restrictions, quarantines, curfews and stay-at-home orders, workplace hazard controls, and facility closures.
The pandemic has led to severe global socioeconomic disruption, the postponement or cancellation of sporting, religious, political and cultural events, and widespread shortages of supplies exacerbated by panic buying. Schools, universities and colleges have closed either on a nationwide or local basis in 197 countries, affecting approximately 99.9 per cent of the world’s student population.
_____
COVID-19 patients can show an array of symptoms ranging from mild to moderate respiratory issues, such as dry coughing, to very serious infections leading to respiratory distress accompanied by pneumonia. Additionally, viral loads detected in asymptomatic patients were similar to symptomatic patients, suggesting transmission of the virus is possible regardless of the presence of symptoms. These findings not only confirm the contagious nature of asymptomatic patients but help to explain SARS-CoV-2 high rates of transmissibility. Furthermore, these findings are aligned with other reports of early-stage transmission of infection and have helped direct public health policy to follow social distancing initiatives.
In another study, performed by Kelvin To and colleagues, researchers investigated the viral load and antibody profiles for 23 COVID-19 positive patients. Their findings showed the following:
At ~1 week, viral loads peaked
At ~2 weeks, viral loads gradually declined
There was a correlation between age and viral load
IgG and IgM antibodies began increasing at ~ day 10
IgG and IgM antibody level against the SARS-CoV-2 internal nucleoprotein and the surface spike receptor-binding domain correlated with neutralizing activity
_
The number of deaths from COVID-19 exceeded 383,000 globally on 5 June 2020. The case fatality rate is < 1%. It is speculated that the true case fatality rate is lower than this because many mild cases are not being tested, which thus skews the apparent death rate upwards. A paper published by the Chinese Center for Disease Control and Prevention (CCDC) analyzed all 44,672 cases diagnosed up to 11 February 2020. Of these, ~1% were asymptomatic, and ~80% were classed as “mild”. Another study looked at clinical characteristics in COVID-19 positively tested close contacts of COVID-19 patients. Approximately 30% of those COVID-19 positive close contacts never developed any symptoms or changes on chest CT scans. The remainder showed changes on CT, but ~20% reportedly developed symptoms during their hospital course, none of them developed severe disease. This suggests that a high percentage of COVID-19 carriers are asymptomatic. In the Chinese population, 55-60%% of COVID-19 patients were male; the median age has been reported between 47 and 59 years.
Children seem to be relatively unaffected by this virus, or indeed other closely-related coronaviruses with large cohort studies reporting that 1-2% of COVID-19 patients are children. However, there have been cases of critically-ill children with infants under 12 months likely to be more seriously affected. A very low number of pediatric deaths has been reported. In children, male gender does not seem to be a risk factor. The incubation period has been reported to be shorter than in adults, at about two days.
Note:
It is important to appreciate that the known epidemiological parameters of any new disease are likely to change as larger cohorts of infected people are studied, although this will only to some extent reflect a true change in the underlying reality of disease activity (as a disease is studied and understood humans will be simultaneously changing their behaviors to alter transmission or prevalence patterns).
_____
Experience from China, Italy, and the United States demonstrates that COVID-19 can overwhelm even the healthcare capacities of well-resourced nations. With no pharmaceutical treatments available, interventions have focused on contact tracing, quarantine, and social distancing. The required intensity, duration, and urgency of these responses will depend both on how the initial pandemic wave unfolds and on the subsequent transmission dynamics of SARS-CoV-2. During the initial pandemic wave, many countries have adopted social distancing measures, and some, like China, are gradually lifting them after achieving adequate control of transmission. However, to mitigate the possibility of resurgences of infection, prolonged or intermittent periods of social distancing may be required. After the initial pandemic wave, SARS-CoV-2 might follow its closest genetic relative, SARS-CoV-1, and be eradicated by intensive public health measures after causing a brief but intense epidemic. Increasingly, public health authorities consider this scenario unlikely. Alternatively, the transmission of SARS-CoV-2 could resemble that of pandemic influenza by circulating seasonally after causing an initial global wave of infection. Such a scenario could reflect the previous emergence of known human coronaviruses from zoonotic origins e.g. human coronavirus (HCoV) OC43. Distinguishing between these scenarios is key for formulating an effective, sustained public health response to SARS-CoV-2.
_
The pandemic and post-pandemic transmission dynamics of SARS-CoV-2 will depend on factors including the degree of seasonal variation in transmission, the duration of immunity, and the degree of cross-immunity between SARS-CoV-2 and other coronaviruses, as well as the intensity and timing of control measures. SARS-CoV-2 belongs to the betacoronavirus genus, which includes the SARS-CoV-1 coronavirus, MERS coronavirus, and two other human coronaviruses, HCoV-OC43 and HCoV-HKU1. The SARS-CoV-1 and MERS coronaviruses cause severe illness with approximate case fatality rates of 9 and 36% respectively, but the transmission of both has remained limited. HCoV-OC43 and HCoV-HKU1 infections may be asymptomatic or associated with mild to moderate upper respiratory tract illness; these HCoVs are considered the second most common cause of the common cold. HCoV-OC43 and HCoV-HKU1 cause annual wintertime outbreaks of respiratory illness in temperate regions, suggesting that wintertime climate and host behaviors may facilitate transmission, as is true for influenza. Immunity to HCoV-OC43 and HCoV-HKU1 appears to wane appreciably within one year, while SARS-CoV-1 infection can induce longer-lasting immunity. The betacoronaviruses can induce immune responses against one another: SARS-CoV-1 infection can generate neutralizing antibodies against HCoV-OC43 and HCoV-OC43 infection can generate cross-reactive antibodies against SARS-CoV-1. While investigations into the spectrum of illness caused by SARS-CoV-2 are ongoing, recent evidence indicates the majority of cases experience mild to moderate illness with more limited occurrence of severe lower respiratory infection. Current COVID-19 case fatality rates are estimated to lie between 0.6% and 3.5%, suggesting lower severity than SARS-CoV-1 and MERS but higher severity than HCoV-OC43 and HCoV-HKU1. The high infectiousness near the start of often mild symptoms makes SARS-CoV-2 considerably harder to control with case-based interventions such as intensive testing, isolation and tracing, compared to SARS-CoV-1 and MERS coronaviruses.
_
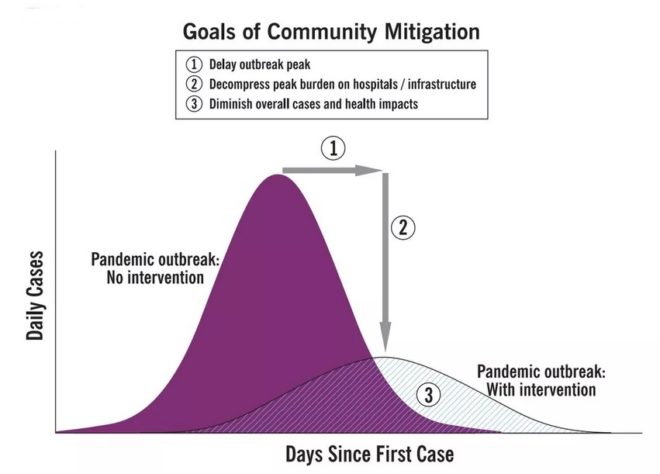
Intensive testing and case-based interventions have so far formed the centerpiece of control efforts in some places, such as Singapore and Hong Kong. Many other countries are adopting measures termed “social distancing” or “physical distancing,” closing schools and workplaces and limiting the sizes of gatherings. The goal of these strategies is to reduce the peak intensity of the epidemic (“flatten the curve”), reducing the risk of overwhelming health systems and buying time to develop treatments and vaccines. For social distancing to have reversed the epidemic in China, the effective reproduction number must have declined by at least 50-60%, assuming a baseline R0 between 2 and 2.5. Through intensive control measures, Shenzhen was able to reduce the effective reproduction number by an estimated 85%. However, it is unclear how well these declines in R0 might generalize to other settings: recent data from Seattle suggests that the basic reproduction number has only declined to about 1.4, or by about 30-45% assuming a baseline R0 between 2 and 2.5. Furthermore, social distancing measures may need to last for months to effectively control transmission and mitigate the possibility of resurgence.
A key metric for the success of social distancing interventions is whether critical care capacities are exceeded. Modeling studies and experience from the Wuhan outbreak indicate that critical care capacities even in high-income countries can be exceeded many times over if distancing measures are not implemented quickly or strongly enough. To alleviate these problems, approaches to increase critical care capacity have included rapid construction or repurposing of hospital facilities and consideration of increased manufacturing and distribution of ventilators. Treatments that reduce the proportion of infections that lead to severe illness could have a similar effect of reducing burden on healthcare systems.
_
Stages of transmission:
Speaking about a spread of disease among humans, the term transmission refers to the transmission of microorganisms from one infected individual to another uninfected person, either through direct contact, through droplets, or through indirect contact such as surface contamination.
The novel coronavirus has four stages of transmission — in line with other infectious diseases.
Stage 1 is the first appearance of the disease through people with a travel history, with everyone contained, their sources traced, and no local spread from those affected. The number of those infected would be quite low at this stage.
Stage 2 is local transmission, when those who were infected and have a travel history spread the virus to close friends or family. At this stage, every person who came in contact with the infected can be traced and isolated.
Stage 3 is community transmission, when infections happen in public and a source for the virus cannot be traced. At this stage, large geographical lockdowns become important as random members of the community start developing the disease.
Stage 4 is when the disease actually becomes an epidemic in a country, such as it was in China, with large numbers of infections and a growing number of deaths with no end in sight.
_____
Figure below shows how covid-19 travels from population A to population B.
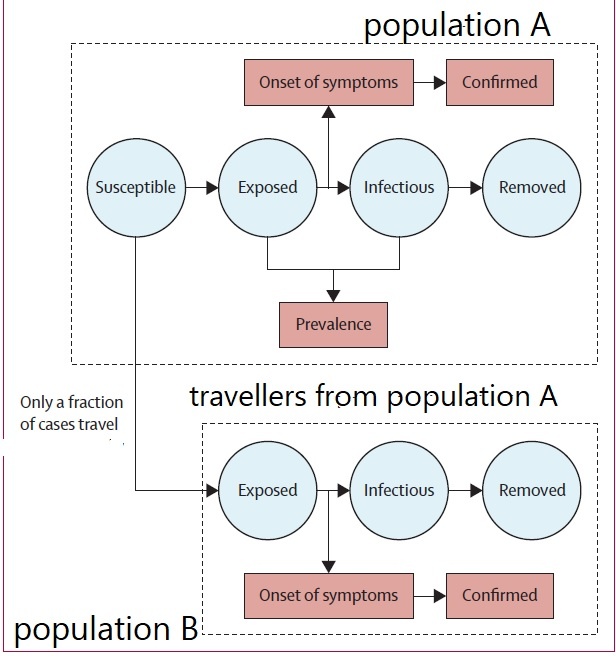
The population is divided into the following four classes: susceptible, exposed, infectious (presymptomatic, asymptomatic and symptomatic), and removed (i.e., isolated, quarantined, recovered, or otherwise non-infectious including dead). A fraction of exposed individuals subsequently travels and are eventually detected in their destination country/location/area.
____
Framework for the initial assessment of the effects of a pandemic:
During the initial assessment, a combination of the dichotomous scale for indicators of transmissibility and the dichotomous scale for indicators of severity results in a framework with 4 profiles (A, B, C, D) (Figure below). An initial assessment can be made as soon as data on some measures become available and would continue to be reviewed and revised as the data warrant.
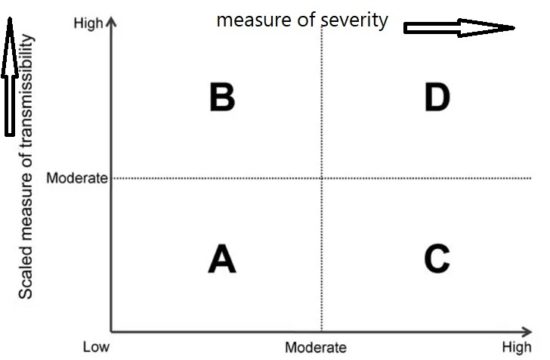
Early measures of transmissibility were scaled along a y-axis, and early measures of clinical severity were scaled along an x-axis. From the combination of these 2 dichotomous scales, the initial framework results in 4 quadrants (Figure above). In quadrant A, for example, available indicators appear similar to the range seen in annual seasonal epidemics. For quadrant B, although clinical severity is in the range of that seen in seasonal epidemics, the transmissibility is greater and thus overall rates of severe outcomes may be greater. Conversely, in quadrant C, transmissibility is similar to that of seasonal epidemics, but severity is expected to be higher, again leading to increased expected rates of severe outcomes, but for a different reason. Finally, in quadrant D, both indicators are greater than expected during annual seasonal epidemics. Consequently, recommended guidance and interventions during the pandemic response may be different between the quadrants. Initial assessment of corona virus pandemic showed that it belongs to quadrant D having high transmissibility and high severity, and later on it was found that high severity is in very small segment of infected population especially in elderly and with comorbidities.
______
The pandemic’s future:
Researchers with the Center for Infectious Disease Research and Policy (CIDRAP) used data from influenza pandemics to predict the future course of the COVID-19 outbreak. Because of a longer incubation period, more asymptomatic spread, and a higher reproductive number, COVID-19 appears to spread more easily than flu, highlighted the CIDRAP report. A higher reproductive number means more people will need to get infected and become immune before the pandemic would end, the report explained. They estimate that the outbreak will likely last 18 to 24 months, and 60%–70% of the population may need to be immune for the pandemic to end. They offer three potential scenarios for future waves of the outbreak and advise leaders to prepare for the worst-case scenario — that is, the current wave is followed by a larger wave in the fall or winter of 2020, with at least one smaller wave in 2021. The course of the pandemic also could be influenced by a vaccine; however, a vaccine will likely not be available until at least sometime in 2021. And we don’t know what kinds of challenges could arise during vaccine development that could delay the timeline, CIDRAP said.
______
______
SARS-CoV-2 structure:
_
_
CoVs are positive-stranded RNA viruses with a crown-like appearance under an electron microscope (coronam is the Latin term for crown) due to the presence of spike glycoproteins on the envelope. The subfamily Orthocoronavirinae of the Coronaviridae family (order Nidovirales) classifies into four genera of CoVs: Alphacoronavirus (alphaCoV), Betacoronavirus (betaCoV), Deltacoronavirus (deltaCoV), and Gammacoronavirus (gammaCoV). Furthermore, the betaCoV genus divides into five sub-genera or lineages. Genomic characterization has shown that probably bats and rodents are the hosts of alphaCoVs and betaCoVs. And avian species seem to represent hosts of deltaCoVs and gammaCoVs. Members of this large family of viruses can cause respiratory, enteric, hepatic, and neurological diseases in different animal species, including camels, cattle, cats, and bats. To date, seven human CoVs (HCoVs) — capable of infecting humans — have been identified. Some of HCoVs were identified in the mid-1960s, while others were only detected in the new millennium. In general, estimates suggest that 2% of the population are healthy carriers of a CoV and that these viruses are responsible for about 5% to 10% of acute respiratory infections.
- Common human CoVs:
HCoV-OC43, and HCoV-HKU1 (betaCoVs of the A lineage); HCoV-229E, and HCoV-NL63 (alphaCoVs). They can cause common colds and self-limiting upper respiratory infections in immunocompetent individuals. In immunocompromised subjects and the elderly, lower respiratory tract infections can occur.
- Other human CoVs:
SARS-CoV, SARS-CoV-2, and MERS-CoV (betaCoVs of the B and C lineage, respectively). These cause epidemics with variable clinical severity featuring respiratory and extra-respiratory manifestations. Concerning SARS-CoV, MERS-CoV, the mortality rates are up to 10% and 35%, respectively.
Thus, SARS-CoV-2 belongs to the betaCoVs category. It has round or elliptic and often pleomorphic form, and a diameter of approximately 60–140 nm. Like other CoVs, it is sensitive to ultraviolet rays and heat. Furthermore, these viruses can be effectively inactivated by lipid solvents including ether (75%), ethanol, chlorine-containing disinfectant, peroxyacetic acid and chloroform except for chlorhexidine.
In genetic terms, Chan et al. have proven that the genome of the new HCoV, isolated from a cluster-patient with atypical pneumonia after visiting Wuhan, had 89% nucleotide identity with bat SARS-like-CoVZXC21 and 82% with that of human SARS-CoV. For this reason, the new virus was called SARS-CoV-2. Its single-stranded RNA genome contains 29891 nucleotides, encoding for 9860 amino acids. Although its origins are not entirely understood, these genomic analyses suggest that SARS-CoV-2 probably evolved from a strain found in bats. The potential amplifying mammalian host, intermediate between bats and humans, is, however, not known. Since the mutation in the original strain could have directly triggered virulence towards humans, it is not certain that this intermediary exists.
_____
Figure below shows Phylogeny of coronaviruses:
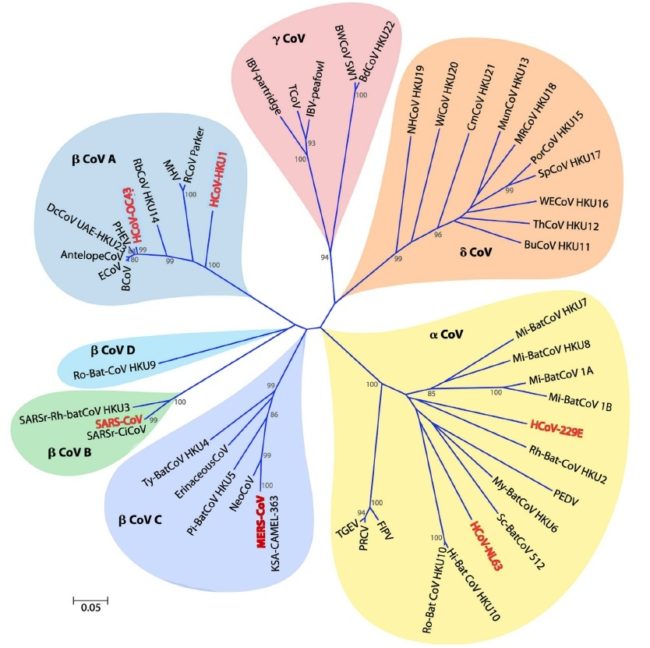
Phylogenetic tree of 50 coronaviruses is constructed by the neighbor-joining method using MEGA 5.0 using partial nucleotide sequences of RNA-dependent RNA polymerase. The scale bar indicates the estimated number of substitutions per 20 nucleotides. Space does not permit providing full virus names, except for the human viruses, which are scattered among the viruses isolated from many other species (major pathogens shown in red): HCoV-229E, human coronavirus 229E; HCoV-HKU1, human coronavirus HKU1; HCoV-NL63, human coronavirus NL63; HCoV-OC43, human coronavirus OC43; KSA-CAMEL-363, KSA-CAMEL-363 isolate of Middle East respiratory syndrome coronavirus; MERS-CoV, Middle East respiratory syndrome coronavirus; MHV, murine hepatitis virus, the prototypic virus of the family; SARS-CoV, SARS coronavirus; SARSrCiCoV, SARS-related palm civet coronavirus. A remarkable number of the viruses represented here are from bats, many different species of bats, and quite a few of these are rather closely related to SARS-CoV.
____
Cross-sectional model of a coronavirus is depicted in figure below:
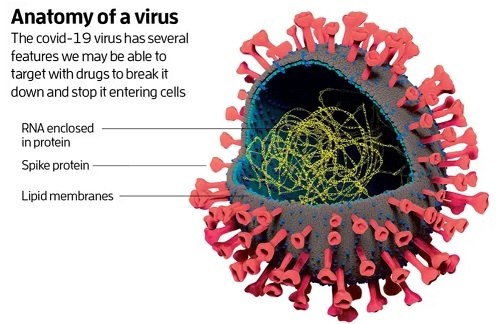
Coronaviruses are large pleomorphic spherical particles with bulbous surface projections. The average diameter of the virus particles is around 120 nm (0.12 μm). The diameter of the envelope is ~80 nm (0.08 μm) and the spikes are ~20 nm (0.02 μm) long. The envelope of the virus in electron micrographs appears as a distinct pair of electron dense shells. The viral envelope consists of a lipid bilayer where the membrane (M), envelope (E) and spike (S) structural proteins are anchored. A subset of coronaviruses (specifically the members of betacoronavirus subgroup A) also have a shorter spike-like surface protein called hemagglutinin esterase (HE). Inside the envelope, there is the nucleocapsid, which is formed from multiple copies of the nucleocapsid (N) protein, which are bound to the positive-sense single-stranded RNA genome in a continuous beads-on-a-string type conformation. The lipid bilayer envelope, membrane proteins, and nucleocapsid protect the virus when it is outside the host cell.
_
Attachment and Entry:
The initial attachment of the virion to the host cell is initiated by interactions between the S protein and its receptor. The sites of receptor binding domains (RBD) within the S1 region of a coronavirus S protein vary depending on the virus, with some having the RBD at the N-terminus of S1 (MHV), while others (SARS-CoV) have the RBD at the C-terminus of S1. The S-protein–receptor interaction is the primary determinant for a coronavirus to infect a host species and also governs the tissue tropism of the virus. Many coronaviruses utilize peptidases as their cellular receptor. It is unclear why peptidases are used, as entry occurs even in the absence of the enzymatic domain of these proteins. Many α-coronaviruses utilize aminopeptidase N (APN) as their receptor, SARS-CoV and HCoV-NL63 use angiotensin-converting enzyme 2 (ACE2) as their receptor, MHV enters through CEACAM1, and MERS-CoV binds to dipeptidyl-peptidase 4 (DPP4) to gain entry into human cells.
Following receptor binding, the virus must next gain access to the host cell cytosol. This is generally accomplished by acid-dependent proteolytic cleavage of S protein by a cathepsin, TMPRRS2 or another protease, followed by fusion of the viral and cellular membranes. S protein cleavage occurs at two sites within the S2 portion of the protein, with the first cleavage important for separating the RBD and fusion domains of the S protein and the second for exposing the fusion peptide (cleavage at S2′). Fusion generally occurs within acidified endosomes, but some coronaviruses, such as MHV, can fuse at the plasma membrane. Cleavage at S2′ exposes a fusion peptide that inserts into the membrane, which is followed by joining of two heptad repeats in S2 forming an antiparallel six-helix bundle. The formation of this bundle allows for the mixing of viral and cellular membranes, resulting in fusion and ultimately release of the viral genome into the cytoplasm.
____
Spike Protein (S Protein):
The spike protein (S protein) is a large type I transmembrane protein ranging from 1,160 amino acids for avian infectious bronchitis virus (IBV) and up to 1,400 amino acids for feline coronavirus (FCoV). In addition, this protein is highly glycosylated as it contains 21 to 35 N-glycosylation sites. Spike proteins assemble into trimers on the virion surface to form the distinctive “corona”, or crown-like appearance. The ectodomain of all CoV spike proteins share the same organization in two domains: a N-terminal domain named S1 that is responsible for receptor binding and a C-terminal S2 domain responsible for fusion. CoV diversity is reflected in the variable spike proteins (S proteins), which have evolved into forms differing in their receptor interactions and their response to various environmental triggers of virus-cell membrane fusion. It’s been reported that SARS-CoV-2 can infect the human respiratory epithelial cells through interaction with the human ACE2 receptor. Indeed, the recombinant Spike protein can bind with recombinant ACE2 protein.
A notable distinction between the spike proteins of different coronaviruses is whether it is cleaved or not during assembly and exocytosis of virions. With some exceptions, in most alphacoronaviruses and the betacoronavirus SARS-CoV, the virions harbor a spike protein that is uncleaved, whereas in some beta- and all gammacoronaviruses the protein is found cleaved between the S1 and S2 domains, typically by furin, a Golgi-resident host protease. Interestingly, within the betacoronavirus mouse hepatitis virus (MHV) species, different strains, such as MHV-2 and MHV-A59 display different cleavage requirements. This has important consequences on their fusogenicity.
_
Spike protein in coronavirus virion structure:
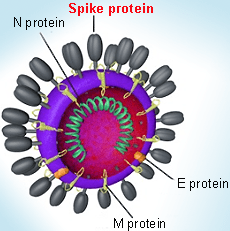
_
Spike Protein Structure:
The coronavirus spike protein is a class I fusion protein. The formation of an α-helical coiled-coil structure is characteristic of this class of fusion protein, which contain in their C-terminal part regions predicted to have an α-helical secondary structure and to form coiled-coils. The S2 subunit is the most conserved region of the protein, whereas the S1 subunit diverges in sequence even among species of a single coronavirus. The S1 contains two subdomains, a N-terminal domain (NTD) and a C-terminal domain (CTD). Both are able to function as receptor binding domains (RBDs) and bind variety of proteins and sugars.
Coronavirus spike proteins contain two heptad repeats in their S2 domain, a feature typical of a class I viral fusion proteins. The heptad repeat is an example of a structural motif that consists of a repeating pattern of seven amino acids. Heptad repeats comprise a repetitive heptapeptide abcdefg with a and d being hydrophobic residues characteristic of the formation of coiled-coil that participate in the fusion process. For SARS-CoV and MHV, the post-fusion structures of the heptad repeat (HR) have been solved; they form the characteristic six-helix bundle. The functional role of MHV and SARS-CoV HR was confirmed by mutating key residues and by inhibition experiments using HR2 peptides.
_
Figure below shows SARS-CoV spike protein schematic:
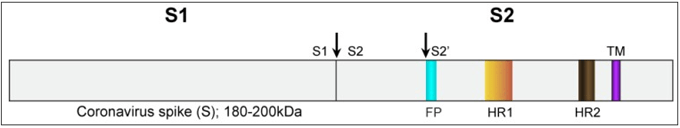
The spike protein ectodomain consists of the S1 and S2 domains. The S1 domain contains the receptor binding domain and is responsible for recognition and binding to the host cell receptor. The S2 domain, responsible for fusion, contains the putative fusion peptide (blue) and the heptad repeat HR1 (orange) and HR2 (brown). The transmembrane domain is represented in purple. Cleavage sites are indicated with arrows.
_
Spike Protein Function:
The CoVs are widely distributed in nature and their zoonotic transmissions into human populations can cause epidemic disease. After entering into respiratory or gastrointestinal tracts, these viruses establish themselves by entering and infecting lumenal macrophages and epithelial cells. The cell entry programs for these viruses are orchestrated by the viral spike (S) proteins that bind cellular receptors and also mediate virus-cell membrane fusions. Take SARS-CoV for example. The spike protein (S protein) of SARS-CoV has pivotal roles in viral infection and pathogenesis. S1 recognizes and binds to host receptors, and subsequent conformational changes in S2 facilitate fusion between the viral envelope and the host cell membrane.
_____
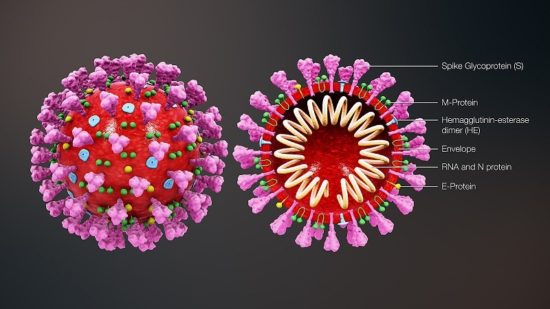
Figure below shows Coronavirus morphology and structure:
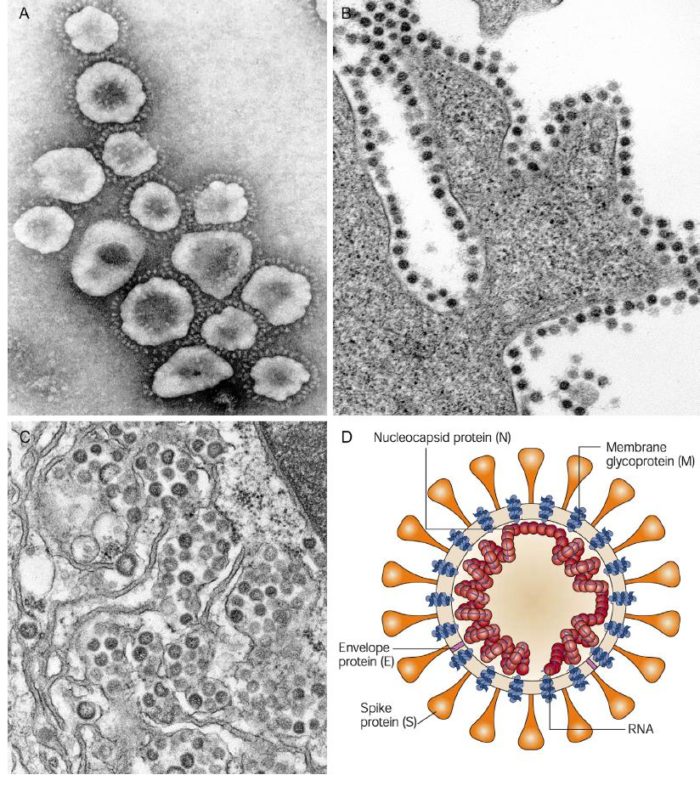
(A) Negative contrast electron microscopy of SARS coronavirus (SARS-CoV), showing the large petal-shaped surface projections (spikes, peplomers). (B) Thin-section electron microscopy of SARS-CoV in cell culture, showing typical adherence of virions to the plasma membrane of a cell—virions adhere to infected and uninfected cells. (C) Thin-section electron microscopy of Middle Eastern respiratory syndrome virus (MERS-CoV) in cell culture, showing typical virion assembly in the lumen of the Golgi membrane system. (D) Model of coronavirus virion structure, showing the supercoiling of the viral nucleocapsid under the envelope.
_____
Corona virus Genome:
The 30 kb positive sense, single-stranded RNA genome is the largest RNA viral genome known. It is capped at the 5′-end and polyadenylated at the 3′-terminus, and is infectious. Due to its size the expression of individual genes occurs through a complex process whereby sets of nested mRNAs are produced, all sharing the same 5′-end sequence. Extensive rearrangements may occur as a result of heterologous RNA recombination. At the 5′-end of the genome is an untranslated (UTR) sequence of 65 to 98 nucleotides, termed the leader RNA, which is also present at the 5′-ends of all subgenomic mRNAs. At the 3′-end of the RNA genome is another untranslated sequence of 200 to 500 nucleotides, followed by a poly(A) tail. Both untranslated regions are important for regulating RNA replication and transcription.
The coronavirus genome contains 7 to 14 open reading frames (ORFs). Starting from the 5′-end, Gene 1, which comprises two-thirds of the genome, is about 20 to 22 kb in length. It consists of two overlapping ORFs (1a and 1b), collectively functioning as the viral RNA polymerase (Pol). The order of the other four genes of structural proteins are 5′- S (spike)–E (envelope)–M (membrane)–N (nucleocapsid) -3′. These genes are interspersed with several ORFs encoding non-structural proteins and the HE glycoprotein, when present. Each gene differs markedly among coronaviruses in number, nucleotide sequence, gene order, and method of expression, although these are conserved within the same serogroup. The SARS-CoV genome encodes several smaller ORFs located in the 3′ region of the genome not present in other coronaviruses. These ORFs are predicted to express eight novel proteins termed accessory proteins. Antibodies reactive against all of the SARS-CoV proteins have been detected in sera isolated from SARS patients, indicating that these proteins are expressed by the virus in vivo.
_
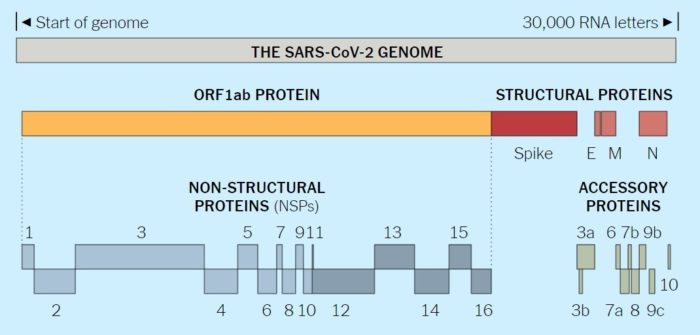
Viruses must hijack living cells to replicate and spread. When the coronavirus finds a suitable cell, it injects a strand of RNA that contains the entire coronavirus genome. The genome of the novel coronavirus is less than 30,000 “letters” long. (The human genome is over 3 billion.) Scientists have identified genes for as many as 29 proteins, which carry out a range of jobs from making copies of the coronavirus to suppressing the body’s immune responses.
The full novel coronavirus genome and the proteins it encodes are shown below:
_
Coronaviruses (CoVs) are found in various animals including aves and mammals. They can be divided into four genera named Alphacoronavirus, Betacoronavirus, Gammacoronavirus, and Deltacoronavirus. The 2019 novel CoV (SARS-CoV-2) is the newest addition to human CoVs (HCoVs) that also include 229E, OC43, HKU1, NL63, severe acute respiratory syndrome (SARS) CoV, and Middle East respiratory syndrome (MERS) CoV. Whereas 229E and NL63 belong to Alphacoronavirus, others are members in the genus of Betacoronavirus. All of them are positive-stranded RNA viruses containing a polycistronic genome of ∼30 kb in size, coding for multiple non-structural proteins (ORF1a and ORF1b, processed into multiple nsp proteins) at the 5′-end plus multiple structural (S, E, M, and N) and lineage-specific accessory proteins (such as ORF3a, ORF3b, ORF6, ORF7a, ORF7b, ORF8a, ORF8b, and ORF9b in SARS-CoV) at the 3′-end (see figure below). SARS-CoV and MERS-CoV are highly pathogenic and can cause severe diseases presented as acute respiratory distress syndrome (ARDS). Although the other four community-acquired HCoVs are a common cause of common cold only, they are thought to cause pandemics and major outbreaks of probably more severe respiratory diseases when they initially crossed species barriers to infect humans decades and centuries ago. All seven HCoVs have a zoonotic origin from bats, rodents, or domestic animals. Their reservoir hosts are selected through evolution. As a result of this selection and mutual adaptation for a long period of time, they usually become non-pathogenic or cause very mild diseases in their native reservoir hosts. However, when an animal CoV such as SARS-CoV-2 enters a new host such as humans, the severity of the disease is significantly increased at the start of a new round of adaptation. The outcome of infection is governed largely by the interplay between virus and host antiviral defense. Through years of co-evolution, this tug-of-war ultimately reaches a tie or a balance under which virus and host co-exist peacefully or even in mutual benefit. Understanding the host restriction factors and the viral countermeasures will shed significant new light on viral pathogenesis and antiviral development. Although it remains to be elucidated how SARS-CoV-2 interacts with host antiviral immunity, lessons can be learned from other HCoVs and human pathogenic viruses in other families including the human immunodeficiency viruses (HIVs).
_
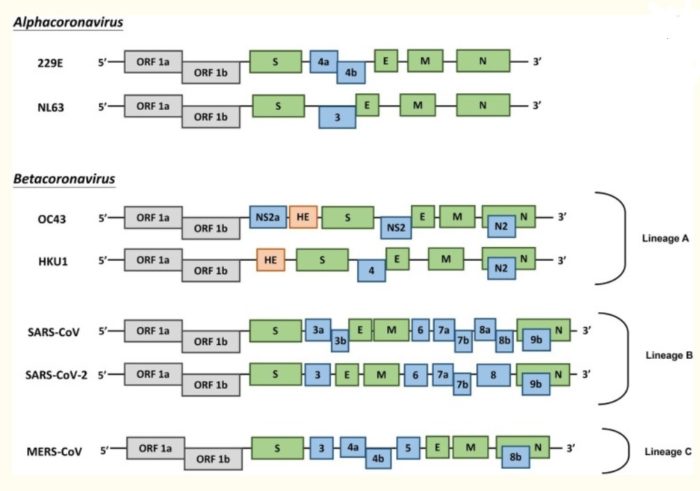
Figure above shows genome organization of HCoVs. Schematic diagram of seven known HCoVs is shown (not in scale). The genes encoding structural proteins spike (S), envelope (E), membrane (M), and nucleocapsid (N) are in green. The gene encoding haemagglutinin-esterase (HE) in lineage A of betacoronaviruses is in orange. The genes encoding accessory proteins are in blue.
______
Notable features of the SARS-CoV-2 genome:
Our comparison of alpha- and betacoronaviruses identifies two notable genomic features of SARS-CoV-2:
(i) on the basis of structural studies and biochemical experiments, SARS-CoV-2 appears to be optimized for binding to the human receptor ACE2; and
(ii) the spike protein of SARS-CoV-2 has a functional polybasic (furin) cleavage site at the S1–S2 boundary through the insertion of 12 nucleotides, which additionally led to the predicted acquisition of three O-linked glycans around the site.
_
Figure below shows features of the spike protein in human SARS-CoV-2 and related coronaviruses.
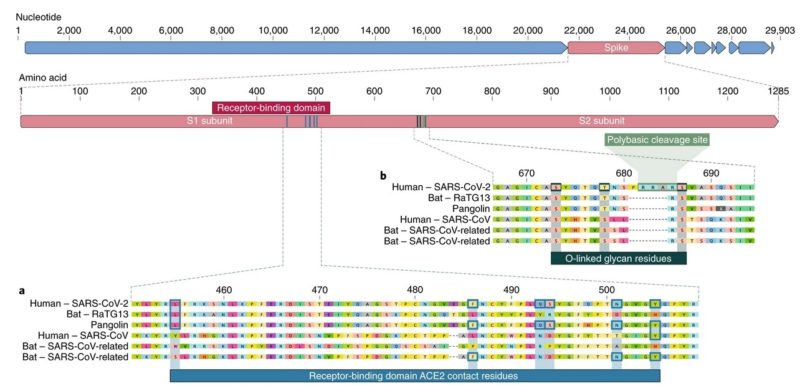
a, Mutations in contact residues of the SARS-CoV-2 spike protein. The spike protein of SARS-CoV-2 (red bar at top) was aligned against the most closely related SARS-CoV-like coronaviruses and SARS-CoV itself. Key residues in the spike protein that make contact to the ACE2 receptor are marked with blue boxes in both SARS-CoV-2 and related viruses, including SARS-CoV (Urbani strain).
b, Acquisition of polybasic cleavage site and O-linked glycans. Both the polybasic cleavage site and the three adjacent predicted O-linked glycans are unique to SARS-CoV-2 and were not previously seen in lineage B betacoronaviruses.
_
- Mutations in the receptor-binding domain of SARS-CoV-2
The receptor-binding domain (RBD) in the spike protein is the most variable part of the coronavirus genome. Six RBD amino acids have been shown to be critical for binding to ACE2 receptors and for determining the host range of SARS-CoV-like viruses. With coordinates based on SARS-CoV, they are Y442, L472, N479, D480, T487 and Y4911, which correspond to L455, F486, Q493, S494, N501 and Y505 in SARS-CoV-27. Five of these six residues differ between SARS-CoV-2 and SARS-CoV. On the basis of structural studies and biochemical experiments, SARS-CoV-2 seems to have an RBD that binds with high affinity to ACE2 from humans, ferrets, cats and other species with high receptor homology.
While the analyses above suggest that SARS-CoV-2 may bind human ACE2 with high affinity, computational analyses predict that the interaction is not ideal and that the RBD sequence is different from those shown in SARS-CoV to be optimal for receptor binding. Thus, the high-affinity binding of the SARS-CoV-2 spike protein to human ACE2 is most likely the result of natural selection on a human or human-like ACE2 that permits another optimal binding solution to arise. This is strong evidence that SARS-CoV-2 is not the product of purposeful manipulation.
- Polybasic furin cleavage site and O-linked glycans
The second notable feature of SARS-CoV-2 is a polybasic cleavage site (RRAR) at the junction of S1 and S2, the two subunits of the spike. This allows effective cleavage by furin and other proteases and has a role in determining viral infectivity and host range. In addition, a leading proline is also inserted at this site in SARS-CoV-2; thus, the inserted sequence is PRRA. The turn created by the proline is predicted to result in the addition of O-linked glycans to S673, T678 and S686, which flank the cleavage site and are unique to SARS-CoV-2. Polybasic cleavage sites have not been observed in related ‘lineage B’ betacoronaviruses, although other human betacoronaviruses, including HKU1 (lineage A), have those sites and predicted O-linked glycans. Given the level of genetic variation in the spike, it is likely that SARS-CoV-2-like viruses with partial or full polybasic cleavage sites will be discovered in other species.
The functional consequence of the polybasic cleavage site in SARS-CoV-2 is unknown, and it will be important to determine its impact on transmissibility and pathogenesis in animal models. Experiments with SARS-CoV have shown that insertion of a furin cleavage site at the S1–S2 junction enhances cell–cell fusion without affecting viral entry. In addition, efficient cleavage of the MERS-CoV spike enables MERS-like coronaviruses from bats to infect human cells. In avian influenza viruses, rapid replication and transmission in highly dense chicken populations selects for the acquisition of polybasic cleavage sites in the hemagglutinin (HA) protein, which serves a function similar to that of the coronavirus spike protein. Acquisition of polybasic cleavage sites in HA, by insertion or recombination, converts low-pathogenicity avian influenza viruses into highly pathogenic forms. The acquisition of polybasic cleavage sites by HA has also been observed after repeated passage in cell culture or through animals.
The function of the predicted O-linked glycans is unclear, but they could create a ‘mucin-like domain’ that shields epitopes or key residues on the SARS-CoV-2 spike protein. Several viruses utilize mucin-like domains as glycan shields involved immunoevasion. Although prediction of O-linked glycosylation is robust, experimental studies are needed to determine if these sites are used in SARS-CoV-2.
_____
The Establishment of Reference Sequence for SARS-CoV-2 and Variation Analysis: March 2020:
In this study, authors retrieved 95 full-length genomic sequences of SARAS-CoV-2 strains from the National Center for Biotechnology Information and GISAID databases, established the reference sequence by conducting multiple sequence alignment and phylogenetic analyses, and analyzed sequence variations along the SARS-CoV-2 genome. The homology among all viral strains was generally high, among them, 99.99% (99.91%-100%) at the nucleotide level and 99.99% (99.79%-100%) at the amino acid level. Although overall variation in open-reading frame (ORF) regions is low, 13 variation sites in 1a, 1b, S, 3a, M, 8, and N regions were identified, among which positions nt28144 in ORF 8 and nt8782 in ORF 1a showed mutation rate of 30.53% (29/95) and 29.47% (28/95), respectively. These findings suggested that there may be selective mutations in SARS-COV-2, and it is necessary to avoid certain regions when designing primers and probes. Establishment of the reference sequence for SARS-CoV-2 could benefit not only biological study of this virus but also diagnosis, clinical monitoring and intervention of SARS-CoV-2 infection in the future.
________
Life cycle of corona virus:
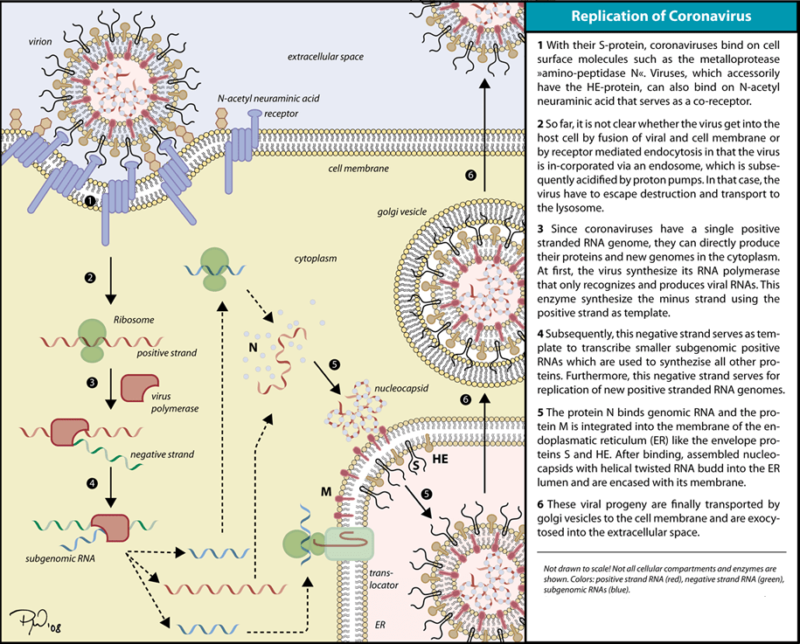
SARS-CoV2, like other human coronaviruses, harbours three envelope proteins, the spike (S) protein (180–220 kDa), the membrane (M) protein (25–35 kDa) and the envelope (E) protein (10–12 kDa), which are required for entry of infectious virions into target cells. The virion also contains the nucleocapsid (N), capable of binding to viral genomic RNA, and nsp3, a key component of the replicase complex. A subset of betacoronaviruses use a hemagglutinin-esterase (65 kDa) that binds sialic acids at the surface of glycoproteins. The S glycoprotein determines the host tropism. SARS-CoV-2 binds to angiotensin-converting enzyme 2 (ACE2) expressed on pneumocytes. Binding to ACE2 is expected to trigger conformational changes in the S glycoprotein allowing cleavage by the transmembrane protease TMPRSS2 of the S protein and the release of S fragments into the cellular supernatant that inhibit virus neutralisation by antibodies. The virus is then transported into the cell through the early and late endosomes where the host protease cathepsin L further cleaves the S protein at low pH, leading to fusion of the viral envelope and phospholipidic membrane of the endosomes resulting in release of the viral genome into the cell cytoplasm. Replication then starts and the positive-strand viral genomic RNA is transcribed into a negative RNA strand that is used as a template for the synthesis of viral mRNA. Synthesis of the negative RNA strand peaks earlier and falls faster than synthesis of the positive strand. Infected cells contain between 10 and 100 times more positive strands than negative strands. The ribosome machinery of the infected cells is diverted in favour of the virus, which then synthesises its non-structural proteins (NSPs) that assemble into the replicase-transcriptase complex to favour viral subgenomic mRNA synthesis. Following replication, the envelope proteins are translated and inserted into the endoplasmic reticulum and then move to the Golgi compartment. Viral genomic RNA is packaged into the nucleocapsid and then envelope proteins are incorporated during the budding step to form mature virions. The M protein, which localises to the trans-Golgi network, plays an essential role during viral assembly by interacting with the other proteins of the virus. Following assembly, the newly formed viral particles are transported to the cell surface in vesicles and are released by exocytosis.
The interaction of the coronavirus spike protein with its complement host cell receptor is central in determining the tissue tropism, infectivity, and species range of the virus. The SARS coronavirus, for example, infects human cells by attaching to the angiotensin-converting enzyme 2 (ACE2) receptor.
______
Comparison between SARS-CoV and SARS-CoV-2:
As viruses in the same lineage, SARS-CoV and SARS-CoV-2 are very similar (see Table below), sharing 82% nucleotide sequence homology. Known interferon antagonists encoded by SARS-CoV include nsp1, nsp3, nsp16, ORF3b, ORF6, M and N proteins. They, respectively, share 84, 76, 93, 32, 69, 91, and 94% amino acid sequence identity with their counterparts in SARS-CoV-2. Known activators of NLRP3 inflammasome encoded by SARS-CoV include E, ORF3a, and ORF8b. They, respectively, share 95, 72, and 40% amino acid identity with their counterparts in SARS-CoV-2. It is noteworthy that some accessory proteins that modulate interferon response and inflammasome activation in the two viruses varied substantially. It will be of interest to see whether the divergence might have affected the virulence and pathogenicity of SARS-CoV-2.
|
|
SARS-CoV |
SARS-CoV-2 |
|
Virus origin |
|
|
|
Entry receptor |
|
|
|
Human-to-human transmission route |
|
|
|
Superspreading events |
|
|
|
Clinical presentations |
|
|
|
Case fatality |
|
|
|
Transmissibility |
|
|
|
Interferon antagonists |
|
|
|
Inflammasome activators |
|
|
aR0 is <1 for tertiary and quaternary spreading as well as in the later phase.
bIt remains to be seen as to whether R0 will substantially reduce in tertiary and quaternary spreading as well as in the later phase.
_
Comparison of the sequence and genome organization of SARS-CoV and SARS-CoV-2 reveals more similarities than differences. Overemphasizing the differences in the initial stage of the outbreak has turned out to be counterproductive and very costly in disease control. The sequence similarities predict that the patterns and modes of the interaction between SARS-CoV-2 and host antiviral defence would be similar. Indeed, they share many features during the course of infection.
First, they share the same cellular receptor ACE2. However. the spike protein which helps SARS-CoV-2 bind to ACE2 has undergone several mutations that has increased its affinity to the human ACE2 by nearly 10-15 times compared to SARS-CoV S-protein, making it highly infectious.
Second, their transmission routes and patterns are very similar. While both are transmitted through droplets primarily, close contact is a major risk factor. The attack rate of SARS-CoV-2 within the family context is even higher than that of SARS-CoV. The faecal–oral route for transmission of SARS-CoV-2 has been reported as in the case of SARS-CoV. More studies are required to elucidate the exact role of faecal–oral transmission in the spreading of SARS-CoV-2.
Third, superspreading events have been documented for SARS-CoV and are also suspected to have occurred in the transmission of SARS-CoV-2, which could explain the rapid increase in confirmed cases in many places including 691 on the Diamond Princess cruise ship as of 23 February 2020.
Fourth, clinical presentations of SARS-CoV and SARS-CoV-2 infection are similar, although symptoms associated with SARS-CoV-2 infection are generally milder.
Fifth, host antiviral defence plays a critical role in the course of both SARS-CoV and SARS-CoV-2 infection. For severe cases, immunopathogenesis and induction of a proinflammatory cytokine storm are the culprit.
Finally, drugs tested effective for SARS-CoV have been shown to exhibit an anti-SARS-CoV-2 effect; examples include nucleotide analogue Remdesivir, protease inhibitors Lopinavir and Ritonavir, as well as interferon α2a. Particularly, activation of innate antiviral response by interferon α2a should have beneficial effects at least in the initial stage of infection. However, cautions should still be observed and the possibility that interferon α2a might exacerbate inflammation during the late phase of SARS-CoV-2 infection cannot be excluded. Other innate immune stimulators should also be tested for anti-SARS-CoV-2 effects in future in vitro and in vivo experiments.
_______
_______
Epidemiology of covid-19 in brief:
In December 2019, the first case of coronavirus disease 2019 (COVID-19) was reported in Wuhan, China, during an outbreak of viral pneumonia. An initially regional epidemic has since rapidly expanded to a global pandemic affecting at least 124 countries with significant morbidity and mortality. Since the first reports of cases from Wuhan, a city in the Hubei Province of China, at the end of 2019, cases have been reported in all continents, except for Antarctica. As of 16 April 2020, there were 5 countries with >100,000 cases, 19 countries with 1,000 to 10,000 confirmed cases and 51 countries with between 1000 and 10,000 confirmed cases. As of June 5, 2020, more than 6.42 million cases of COVID-19 have been reported in 210 countries and territories, resulting in more than 383,000 deaths. While containment and mitigation measures have intensified and disease-modifying pharmacologic compounds are being developed, COVID-19 continues to spread. Surveillance methods and capacity vary dramatically between countries. Presymptomatic carriers may be present in many communities and presymptomatic transmission has been documented; asymptomatic carriers have been reported and asymptomatic transmission has been documented.
_
COVID-19 detected in France in late December 2019:
COVID-19 has been retrospectively diagnosed in a man treated in an intensive care unit (ICU) near Paris after coughing up blood on Dec 27, 2019—4 days before the novel coronavirus cluster was identified in Wuhan, China. This finding, published in the International Journal of Antimicrobial Agents, suggests that the coronavirus was already circulating undetected in France well before the first cases were reported there on Jan 24 in two returned travelers from Wuhan.
The authors said that the finding suggest that the actual numbers of COVID-19 infections in France may be underestimated and supports the assumption that about 18% to 23% of people infected with SARS-CoV-2, the virus that causes COVID-19, were asymptomatic The findings also support that roughly 55% of infections were caused by unidentified people, “suggesting that many asymptomatic patients were not diagnosed during January 2020 and contributed to the spread of this epidemic.”
The investigators noted that the findings, along with the man’s lack of a link to China or recent travel, upends current beliefs about the epidemiology of the pandemic. “It also means that several models used to predict the evolution and outcomes of the SARS-CoV-2 propagation might be based on biased data and would need to be adjusted to the actual profile of the epidemic,” they said. However, Reuters and other news outlets are reporting that the man’s wife, who did not become ill, works in retail near a Paris airport frequented by international travelers.
_
The R0 (basic reproduction number) of SARS-CoV-2 has been estimated between 2.2 and 3.28, that is each infected individual, on average, causes between 2-3 new infections.
The incubation period for COVID-19 was initially calculated to be ~5 days. Incubation period (the time from infection to the onset of symptoms) for the new pathogen varies from 2 to 14 days in human to human transmission. Furthermore, median incubation period was reported as 5-6 days (ranged from 0-14 days) in WHO report. Studies that were conducted on those who had traveled to Wuhan and Guangdong mean incubation period of 4.8 (±2.6) days was reported. In some other studies the mean incubation period was reported to be 6.4 days, while another study in China reported longer incubation times up to 24 days. An American group performed an epidemiological analysis of 181 cases, for which days of exposure and symptom onset could be estimated accurately. They calculated a median incubation period of 5.1 days, that 97.5% became symptomatic within 11.5 days (CI, 8.2 to 15.6 days) of being infected, and that extending the cohort to the 99th percentile results in almost all cases developing symptoms in 14 days after exposure to SARS-CoV-2.
Comparison with incubation period of other viruses:
|
Virus |
Incubation Period |
|
Novel Coronavirus |
2-14 or 0-24 days |
|
SARS |
2-7 days, |
|
MERS |
5 days (range: 2-14) |
|
Swine Flu |
1-4 days, |
|
Seasonal Flu |
2 days (1-4 range) |
_
Serial Interval of COVID-19:
Among confirmed cases of COVID-19 in China outside of Hubei province, the mean period between symptom onset in an infector and an infectee was 3.96 days, much shorter than that of SARS and MERS.
Determination of the serial interval, the time between the start of symptoms in the primary patient (infector) and onset of symptoms in the patient receiving that infection from the infector (the infectee) is important in calculating the reproduction number (R0), the number of infectees resulting from one infector. Published retrospective data from 468 reports on transmission of confirmed cases of COVID-19 in China occurring outside Hubei province provide probable date of symptom onset for both infector and infectee. Researchers have now used these dates to calculate the mean serial interval of SARS-CoV-2 infection. The mean serial interval was calculated as 3.96 days, considerably shorter than the mean serial interval calculated for SARS (8.4 days) or MERS (14.6 days). Using these numbers, the calculated R0 is 1.32, lower than previous estimates. Of the 468 reports, 59 indicated that the infectee had symptoms earlier than the infector, indicating presymptomatic infection from either the putative infector or another asymptomatic infector.
Note:
Serial interval is related to but somewhat different from incubation period. Incubation period does not account for time of symptom onset in the infector. Despite several confounding issues with these new data, on which the authors elaborate, the good news is the lower estimated R0 indicating more gradual spread and possible easier containment. The bad news is probable confirmation of significant asymptomatic contagion.
____
Transmission and spread:
Epidemiologic investigation in Wuhan at the beginning of the outbreak identified an initial association with a seafood market that sold live animals, where most patients had worked or visited and which was subsequently closed for disinfection. However, as the outbreak progressed, person-to-person spread became the main mode of transmission.
_
The SARS-CoV-2 virus is thought to spread from person-to-person via:
- droplet transmission (large respiratory droplets that people sneeze, cough or drip which fall on ground)
- aerosol transmission (when someone coughs or sneezes in the room releasing small aerosols which float in air)
- contact transmission (touching a contaminated surface then touching your mouth, nose or eyes)
- direct transmission (kissing, shaking hands etc.)
_
Human to human transmission via either respiratory droplets or close contacts was initially proposed as the main routes of transmission of the pathogen based on experience gained in the previous two epidemics caused by coronaviruses (MERS-CoV and SARS-CoV). According to the world Health Organization (WHO) report, 2019-nCoV is a unique virus that causes respiratory disease, which spreads via oral and nasal droplets. Moreover, the pathogen of COVID-19 can float in the air in the form of aerosols and cause infection in healthy people. Evidence of a study in Singapore revealed higher loads of virus in confirmed cases of COVID-19 in early stages of the disease, which decreased dramatically over time.
Droplets typically do not travel more than six feet (about two meters) and do not linger in the air. There is a study in which SARS-CoV-2 remained viable in experimentally generated aerosols for at least three hours, the relevance of this to the epidemiology of COVID-19 and its clinical implications are unclear. Given the current uncertainty regarding transmission mechanisms, airborne precautions are recommended in certain situations. There is a limited number of evidence on oral-fecal transmissibility of the pathogen. However, COVID-19 RNA was found in fecal specimens of 2 to 10% of confirmed patients with gastrointestinal symptoms such as diarrhea, so fecal-oral transmission should be taken into account as a probable route through case investigation but according to a joint WHO-China report, fecal-oral transmission did not appear to be a significant factor in the spread of infection.
_
Period of infectivity — The interval during which an individual with COVID-19 is infectious is uncertain. It appears that SARS-CoV-2 can be transmitted prior to the development of symptoms and throughout the course of illness. However, most data informing this issue are from studies evaluating viral RNA detection from respiratory and other specimens, and detection of viral RNA does not necessarily indicate the presence of infectious virus. Viral RNA levels from upper respiratory specimens appear to be higher soon after symptom onset compared with later in the illness. Additionally, in a study of nine patients with mild COVID-19, infectious virus was isolated from naso/oropharyngeal and sputum specimens during the first week of illness, but not after this interval, despite continued high viral RNA levels at these sites. These findings raise the possibility that patients might be more infectious in the earlier stage of infection, but additional data are needed to confirm this hypothesis.
The duration of viral shedding is also variable; there appears to be a wide range, which may depend on severity of illness. In one study of 21 patients with mild illness (no hypoxia), 90 percent had repeated negative viral RNA tests on nasopharyngeal swabs by 10 days after the onset of symptoms; tests were positive for longer in patients with more severe illness. In another study of 137 patients who survived COVID-19, the median duration of viral RNA shedding from oropharyngeal specimens was 20 days (range of 8 to 37 days). As mentioned above, detectable viral RNA does not always correlate with isolation of infectious virus, and there may be a threshold of viral RNA level below which infectivity is unlikely. In the study of nine patients with mild COVID-19 described above, infectious virus was not detected from respiratory specimens when the viral RNA level was <106 copies/mL
_
Risk of transmission — The risk of transmission from an individual with SARS-CoV-2 infection varies by the type and duration of exposure, use of preventive measures, and likely individual factors (e.g., the amount of virus in respiratory secretions). Most secondary infections have been described among household contacts, in health care settings when personal protective equipment was not used (including hospitals and long-term care facilities), and in closed settings (e.g., cruise ships). However, reported clusters of cases after social or work gatherings also highlight the risk of transmission through close, non-household contact.
_
Figure below shows representation of COVID-19 Clinical and Transmission Periods.
![]()
The virus is most contagious during the first three days after onset of symptoms, although spread may be possible before symptoms appear and in later stages of the disease. People have tested positive for the disease up to three days before onset of symptoms suggesting transmission is possible before developing significant symptoms.
_
Contact tracing in the early stages of epidemics at various locations suggested that most secondary infections were among household contacts, with a secondary attack rate of up to 10 percent. According to a joint WHO-China report, the rate of secondary COVID-19 in various locations ranged from 1 to 5 percent among tens of thousands of close contacts of confirmed patients in China; most of these occurred within households, with an in-household secondary attack rate of 3 to 10 percent. In the United States, the symptomatic secondary attack rate was 0.45 percent among 445 close contacts of 10 confirmed patients; among household members, the rate was 10.5 percent. In a similar study in Korea, the rates were comparable, with secondary infections in 0.55 percent of all contacts and 7.6 percent of family members.
Clusters of cases have also been reported following family, work, or social gatherings where close, personal contact can occur. As an example, epidemiologic analysis of a cluster of cases in the state of Illinois showed probable transmission through two family gatherings at which communal food was consumed, embraces were shared, and extended face-to-face conversations were exchanged with symptomatic individuals who were later confirmed to have COVID-19.
The risk of transmission with more indirect contact (e.g., passing someone with infection on the street, handling items that were previously handled by someone with infection) is not well established and is likely low.
_
Environmental contamination — Virus present on contaminated surfaces may be another source of infection if susceptible individuals touch these surfaces and then transfer infectious virus to mucous membranes in the mouth, eyes, or nose. The frequency and relative importance of this type of transmission remain unclear. It may be more likely to be a potential source of infection in settings where there is heavy viral contamination (e.g., in an infected individual’s household or in health care settings).
Extensive SARS-CoV-2 contamination of environmental surfaces in hospital rooms of patients with COVID-19 has been described. In a study from Singapore, viral RNA was detected on nearly all surfaces tested (handles, light switches, bed and handrails, interior doors and windows, toilet bowl, sink basin) in the airborne infection isolation room of a patient with symptomatic mild COVID-19 prior to routine cleaning. Viral RNA was not detected on similar surfaces in the rooms of two other symptomatic patients following routine cleaning (with sodium dichloroisocyanurate). Of note, viral RNA detection does not necessarily indicate the presence of infectious virus.
It is unknown how long SARS-CoV-2 can persist on surfaces; other coronaviruses have been tested and may survive on inanimate surfaces for up to six to nine days without disinfection. In a study evaluating the survival of viruses dried on a plastic surface at room temperature, a specimen containing SARS-CoV (a virus closely related to SARS-CoV-2) had detectable infectivity at six but not nine days. However, in a systematic review of similar studies, various disinfectants (including ethanol at concentrations between 62 and 71%) inactivated a number of coronaviruses related to SARS-CoV-2 within one minute. Based on data concerning other coronaviruses, duration of viral persistence on surfaces also likely depends on the ambient temperature, relative humidity, and the size of the initial inoculum.
_____
Vertical transmission:
A recently published cohort study (26 March 2020) could not rule out the possibility of vertical transmission with 9% of neonates (n=3/33) developing an early onset SARS-CoV-2 infection despite strict infection control measures during delivery. However, a retrospective study of nine pregnant patients infected by SARS-CoV-2 did not show any evidence of vertical/intrauterine infection. In another study, among 6 mothers with confirmed COVID-19, SARS-CoV-19 was not detected in the serum or throat swab by RT-PCR in any of their newborns. However, virus-specific antibodies were detected in neonatal blood sera samples. More recent published (20 March 2020) guidance from a joint American-Chinese consensus panel stated that it remains unclear if vertical transmission can occur.
______
COVID-19 Detection in Domestic Animals:
A recent publication in Science investigated the susceptibility of domestic animals, including dogs, cats, chickens, pigs, and ducks. Their findings demonstrated that cats are susceptible to airborne infection while COVID-19 replicates poorly in pigs, chickens and dogs. Pet owners should keep this in mind when interacting with domestic pets.
Transmission between cats:
SARS-CoV-2 can be transmitted between domestic cats, according to an NEJM report. Researchers inoculated three domestic cats with the virus, and a cat with no history of SARS-CoV-2 infection was cohoused with each of the inoculated cats 1 day later. Two days later, one of the cohoused cats tested positive for the virus, and by 5 days, all three cohoused cats had tested positive. All of the cats studied were asymptomatic. The researchers note, “Cats may be a silent intermediate host of SARS-CoV-2, because infected cats may not show any appreciable symptoms that might be recognized by their owners.”
______
______
Pathogenesis:
_
COVID-19 is a single, positive-stranded RNA virus enveloped in a lipid bilayer. The lipid bilayer fuses with the host cell membrane, releasing RNA into the cytoplasm and causing translation of various viral proteins. The replicated RNA genome and synthesized viral proteins reassemble into new viruses, which burst out of the cell. The virus enters via binding of two proteins. The viral counterpart is the spike-protein (S-protein), a glycoprotein expressed as a homotrimer on the viral envelope. Each S-protein consists of two subunits. S1 subunit includes a receptor-binding domain that targets receptors on host cells, and S2 regulates the membrane fusion. This viral S-protein binds with the human protein receptor ACE2. ACE2 is abundant in lung, heart, kidney, and adipose tissue. Binding of S-protein with ACE2 allows for membrane fusion and introduction of COVID-19 RNA into the cell. The binding of these two proteins serves as a target for potential treatments and vaccinations.
_
Organ distribution of severe acute respiratory syndrome (SARS) associated coronavirus (SARS-CoV) in SARS patients: 2004 study:
In the present study, authors used a murine monoclonal antibody specific for SARS-CoV nucleoprotein, and probes specific for a SARS-CoV RNA polymerase gene fragment, for immunohistochemistry and in situ hybridization, respectively, to detect SARS-CoV systematically in tissues from patients who died of SARS. SARS-CoV was found in lung, trachea/bronchus, stomach, small intestine, distal convoluted renal tubule, sweat gland, parathyroid, pituitary, pancreas, adrenal gland, liver and cerebrum, but was not detected in oesophagus, spleen, lymph node, bone marrow, heart, aorta, cerebellum, thyroid, testis, ovary, uterus or muscle. These results suggest that, in addition to the respiratory system, the gastrointestinal tract and other organs with detectable SARS-CoV may also be targets of SARS-CoV infection. The pathological changes in these organs may be caused directly by the cytopathic effect mediated by local replication of the SARS-CoV; or indirectly as a result of systemic responses to respiratory failure or the harmful immune response induced by viral infection.
_
Post-mortem Examination of Patients with COVID-19, May 2020 study:
In this post-mortem evaluation of 10 patients with COVID-19, acute and organizing diffuse alveolar damage and SARS-CoV-2 persistence in the respiratory tract were the predominant histopathologic findings and constituted the leading cause of death in patients with and without invasive ventilation. Periportal liver lymphocyte infiltration was considered unspecific inflammation. Whether myoepicardial alterations represented systemic inflammation or early myocarditis is unclear; criteria for true myocarditis were not met. Central nervous system involvement by COVID-19 could not be detected. This study has limitations, including the small number of cases from a single center and missing proof of direct viral organ infection. The pulmonary histologic characteristics of COVID-19 resembled those observed in diseases caused by other Betacoronavirus infections such as severe acute respiratory syndrome4 and Middle East respiratory syndrome.
_
Comparative replication and immune activation profiles of SARS-CoV-2 and SARS-CoV in human lungs: an ex vivo study with implications for the pathogenesis of COVID-19: 16 April 2020
Summary:
The comparative viral kinetics, cell tropism, and innate immune response profiles of SARSCoV-2 and SARS-CoV in human lungs were characterized in ex-vivo organ cultures. SARSCoV-2 exhibited more efficient replication but induced significantly less host interferon and proinflammatory response than SARS-CoV.
Background:
Although SARS-CoV-2 and SARS-CoV share a number of common clinical manifestations, SARS-CoV-2 appears to be highly efficient in person-to-person transmission and frequently cause asymptomatic infections. However, the underlying mechanism that confers these viral characteristics on high transmissibility and asymptomatic infection remain incompletely understood.
Methods:
Authors comprehensively investigated the replication, cell tropism, and immune activation profile of SARS-CoV-2 infection in human lung tissues with SARS-CoV included as a comparison.
Results:
SARS-CoV-2 infected and replicated in human lung tissues more efficiently than that of SARS-CoV. Within the 48-hour interval, SARS-CoV-2 generated 3.20 folds more infectious virus particles than that of SARS-CoV from the infected lung tissues (P<0.024). SARS-CoV-2 and SARS-CoV were similar in cell tropism, with both targeting types I and II pneumocytes, and alveolar macrophages. Importantly, despite the more efficient virus replication, SARS-CoV-2 did not significantly induce types I, II, or III interferons in the infected human lung tissues. In addition, while SARS-CoV infection upregulated the expression of 11 out of 13 (84.62%) representative pro-inflammatory cytokines/chemokines, SARS-CoV-2 infection only upregulated 5 of these 13 (38.46%) key inflammatory mediators despite replicating more efficiently.
Conclusions:
This study provided the first quantitative data on the comparative replication capacity and immune activation profile of SARS-CoV-2 and SARS-CoV infection in human lung tissues. The results provided important insights on the pathogenesis, high transmissibility, and asymptomatic infection of SARS-CoV-2.
____
Bats are the reservoir of a wide variety of coronaviruses, including severe acute respiratory syndrome coronavirus (SARS-CoV) -like viruses. SARS-CoV-2 may originate from bats or unknown intermediate hosts and cross the species barrier into humans. Virus-host interactions affect viral entry and replication.
Figure below shows viral and host factors that influence the pathogenesis of SARS-CoV-2.
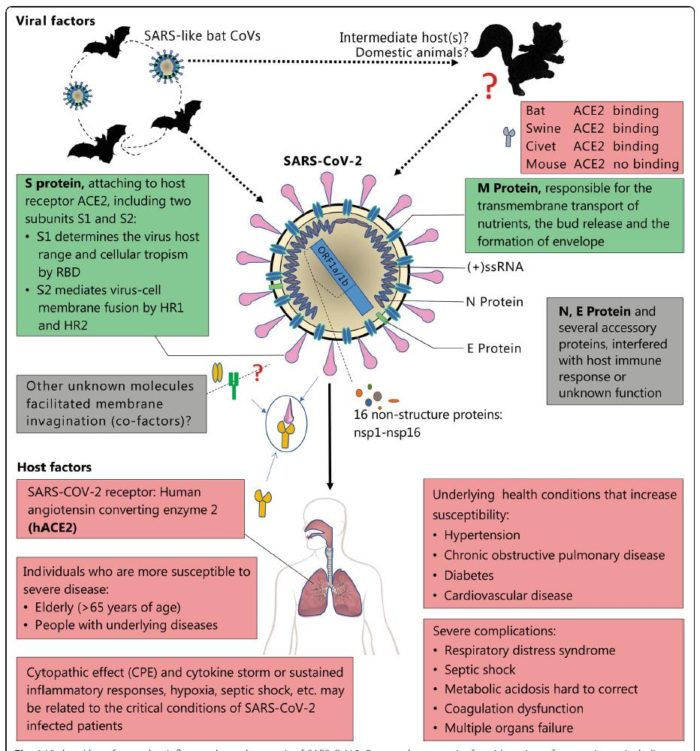
Upper panel: Viral factor. SARS-CoV-2 is an enveloped positive single-stranded RNA (ssRNA) coronavirus. Two-thirds of viral RNA, mainly located in the first open reading frame (ORF 1a/b), encodes 16 non-structure proteins (NSPs). The rest part of the virus genome encodes four essential structural proteins, including spike (S) glycoprotein, small envelope (E) protein, matrix (M) protein, and nucleocapsid (N) protein, and also several accessory proteins. S glycoprotein of SARS CoV-2 binds to host cell receptors, angiotensin-converting enzyme 2 (ACE2), that is a critical step for virus entry. The possible molecules facilitated membrane invagination for SARS-CoV-2 endocytosis are still unclear. Other virus proteins may contribute to pathogenesis.
Host factors (Lower panel) can also influence susceptibility to infection and disease progression. The elderly and people with underlying disease are susceptible to SARS-CoV-2 and tend to develop into critical conditions. RBD, receptor-binding domain; HR1, heptad repeats 1; HR2, heptad repeats 2
______
Do Viral or Host Factors explain the varying Clinical Course of COVID-19? May 2020:
Analysis of 326 cases shows that variations appear linked to age and lymphocytopenia, as opposed to viral factors.
The clinical course of COVID-19 infection varies markedly — from asymptomatic infection to mild pneumonia to overwhelming acute respiratory distress syndrome with concurrent fulminant sepsis. Is this variation caused by genomic changes in the virus or by host factors? Preliminary data addressing this question come from an analysis of 326 patients in Shanghai who had COVID-19 in January and February 2020; viral sequence data were available from 94 patients.
Most had mild disease with fever and radiologic findings, but 12 had more-severe disease, and 16 were critically ill and required mechanical ventilation or extracorporeal membrane oxygenation. Viral genomic analysis that included both the patients’ viral sequences and 221 additional genomes from the Global Initiative on Sharing All Influenza Data international database identified two major clades, with multiple subclades. The patients’ isolates were scattered throughout both clades, and no differences in clinical outcomes were apparent between the clades. In contrast, there was marked variation in the clinical outcome associated with the degree of lymphocytopenia and the number of CD3, CD4, and CD8 T cells. Multivariate analysis showed that the two independent clinical factors were patient age and lymphocytopenia.
There was readily demonstrable evolution of SARS-CoV-2 during this early period in the pandemic, but these findings suggest that this evolution did not contribute to the variation in clinical findings. The course association with age and lymphocytopenia is in keeping with other studies, and the authors note that the degree of lymphocytopenia may be secondary to disease progression rather than being a primary contributor to progression. Lower CD4, and CD8 T cells count suggest dysfunctional immune response.
_____
_____
Immunity:
_
Innate Immune Responses to SARS-CoV-2 Infection:
Currently, only limited information is available on the host innate immune status of SARS-CoV-2 infected patients. In one report where 99 cases in Wuhan were investigated, increased total neutrophils (38%), reduced total lymphocytes (35%), increased serum IL-6 (52%) and increased c-reactive protein (84%) were observed. In a separate report also from Wuhan, it revealed that in 41 patients, increased total neutrophils, decreased total lymphocytes in patients of ICU vs. non-ICU care were found to be statistically different. Increased neutrophils and decreased lymphocytes also correlate with disease severity and death. Furthermore, patients needing ICU care had higher plasma levels of many innate cytokines, IP-10, MCP-1, MIP-1A, and TNFα.2 These clinical features suggested the likelihood of involvement of highly pro-inflammatory condition in the disease progression and severity. This early high rise in the serum levels of pro-inflammatory cytokines were also observed in SARS-CoV and MERS-CoV infection, suggesting a potential similar cytokine storm-mediated disease severity.
Effective innate immune response against viral infection relies heavily on the interferon (IFN) type I responses and its downstream cascade that culminates in controlling viral replication and induction of effective adaptive immune response. While SARS-CoV and SARS-CoV-2 seem to share the entry receptor of ACE2, MERS-CoV uses dipeptidyl peptidase (DPP)-4 as a specific receptor. The putative receptor of SARS-CoV-2, ACE2, is mainly expressed in a small subset of cells in the lung called type 2 alveolar cells. It has been reported that SARS-Co-V directly infects macrophages and T cells, a key feature in SARS-CoV-mediated pathogenesis. Whether SARS-CoV-2 infects any immune cells are still unknown. Only minimal percentages of monocytes/macrophages in the lung expressed ACE2. If ACE2 is minimally expressed in the potential target immune cells, it is possible that other receptors may exist, or other cellular entry mode is utilized such as antibody-dependent enhancement.
_
Role of interferons:
COVID-19, though a new virus, seems to have a similar pattern to SARS and MERS. Despite the differences in the mortality and epidemiological rates of these three diseases, the pattern of age-specific mortality is similar; and the mortality rates get higher as the age increases with very low fatality rate in children under nine years old and the highest mortality rates among the elderly.
It has been shown that the potential first lines of defense against SARS are mediated through mannose-binding lectin as a pattern recognition molecule (PRM) of innate immunity. Additionally, interleukin (IL)-12 seems to play a vital role in SARS. IL-12 activation would lead to the induction of interferons (IFNs). IFN-γ is a key moderator in linking the innate immunity to adaptive immune responses.
IFNs are a group of cytokines, which communicate between cells against pathogens and have a critical role in the immune system, such as activating natural killer (NK) cells and macrophages, in addition to the flu-like symptoms of various diseases. There are three classes of IFNs: I (such as IFN-α and –β), II (IFN-γ), and III, all of which play roles against viral infections.
In SARS-CoV and MERS-CoV, the reaction to viral infections by type I IFNs is suppressed. Both CoVs use variant strategies to decrease type I IFN production. This dampening approach is highly associated with the disease severity and increased mortality. On the other hand, in the lethal cases of SARS-CoV or MERS-CoV infection, the increased influx of inflammatory cells is always observed. In a mouse model of SARS- CoV infection, imbalanced type I IFN and inflammatory cells were shown as the main causes of fatal pneumonia.
Understanding the pattern of the immune system induction in adults and children in the CoV associated respiratory syndromes could help to find treatment strategies for these fatal diseases. Considering the lack of available data on COVID-19, SARS can be a helpful model in this regard. Because SARS-CoV-2 has the highest similarity in structure and nucleotide sequence to SARS-CoV among other viruses of this family, showing 96% and 89.6% sequence identity in the proteins of their envelope and nucleocapsid, respectively.
Interferons have shown to play a crucial role in the defense against coronavirus diseases. CoV can impede the interferon induction in humans. Moreover, STAT1, a key protein in the interferon mediated immune response, is antagonized by the virus. This could explain the increased response threshold of immune cells to IFNs during CoV infections.
A vivid correlation between the innate immune response threshold and the fatality rates in COVID- 19 can be found. Differences in the dynamics of the interferon-related innate immune responses in children, adults, and elderly may explain the reported fatality rates. The increased mortality rates in the elderly can be explained by the higher threshold of interferon-mediated immune responses. Earlier induction of interferons in children and their less developed immune system could contribute to their near to zero fatality rate.
_
Adaptive Immune Responses:
In general, the Th1 type immune response plays a dominant role in an adaptive immunity to viral infections. Cytokine microenvironment generated by antigen presenting cells dictate the direction of T cell responses. Helper T cells orchestrate the overall adaptive response, while cytotoxic T cells are essential in killing of viral infected cells. Humoral immune response, especially production of neutralizing antibody, plays a protective role by limiting infection at later phase and prevents re- infection in the future. In SARS-CoV, both T and B cell epitopes were extensively mapped for the structural proteins, S, N, M and E protein.
SARS-CoV infection induces seroconversion as early as day 4 after onset of disease and was found in most patients by 14 days. Long lasting specific IgG and neutralizing antibody are reported as long as 2 years after infection. For MERS-CoV infection, seroconversion is seen at the second or third week of disease onset. For both types of coronavirus infections, delayed and weak antibody response are associated with severe outcome. A limited serology details of SARS-CoV-2 was reported. In a preliminary study, one patient showed peak specific IgM at day 9 after disease onset and the switching to IgG by week. Interestingly, sera from 5 patients of confirmed COVID-19 show some cross-reactivity with SARS-CoV, but not other coronavirus. Furthermore, all sera from patients were able to neutralize SARS-CoV-2 in an in vitro plaque assay, suggesting a possible successful mounting of the humoral responses. Whether the kinetic/titer of specific antibody correlates with disease severity remains to be investigated.
T cell response in SARS-CoV was extensively investigated. In one study using 128 convalescent samples, it was reported that CD8+ T cell responses were more frequent with greater magnitude than CD4+ T cell responses. Furthermore, the virus specific T cells from the severe group tended to be a central memory phenotype with a significantly higher frequency of polyfunctional CD4+ T cells (IFNγ, TNFα, and IL-2) and CD8+ T cells (IFNγ, TNFα and degranulated state), as compared with the mild-moderate group. Strong T cell responses correlated significantly with higher neutralizing antibody while more serum Th2 cytokines (IL-4, IL-5, IL-10) were detected in the fatal group. For the epitope mapping, most responses (70%) were found against the structural proteins (spike, envelope, membrane, and nucleocapsid). In MERS-CoV infection, early rise of CD8+ T cells correlates with disease severity and at the convalescent phase, dominant Th1 type helper T cells are observed. In an animal model, airway memory CD4+ T cells specific for conserved epitope are protective against lethal challenge and can cross react with SARS-CoV and MERS-CoV. As neutrophils play a destructive role in all infections, the protective or destructive role of Th17 in human coronavirus infection remains unanswered. Current evidences strongly indicated that Th1 type response is a key for successful control of SARS-CoV and MERS- CoV and probably true for SARS-CoV-2 as well. CD8+ T cell response, even though crucial, needs to be well controlled in order not to cause lung pathology.
Laboratory evidence of clinical patients showed that specific T‐cell responses against SARS‐CoV‐2 is important for the recognition and killing of infected cells, particularly in the lungs of infected individuals. The results of a study with 128 cases showed that the number and function of CD8+ T cells were greater than CD4+ T cell responses, although whether the memory T‐cell response is sufficient to protect from reinfection needs further study. Furthermore, the virus‐specific T cells from the severe infection tended to have a central memory phenotype with a significantly higher frequency of polyfunctional CD4+ T cells with cytokine secretion, for example, IFNγ, TNFα, and IL‐2, and CD8+ T cells with cytokine secretion, for example, IFNγ, TNFα and degranulated state, as compared with mild infections. Strong T cell responses have a relationship with higher neutralizing antibody, while more serum Th2 cytokine secretion, for example, IL‐4, IL‐5, IL‐10 (which increases the production of antibodies), were diagnosed in the deceased patients. Contrary to the decrease in serum antibody levels in patients, cytotoxic T lymphocyte (CTL) function‐specific N proteins are still detectable from the PBMCs of recovered patients from SARS or MERS more than 10 years post infection.
_____
Protective antibodies:
Antibodies to the virus are induced in those who have become infected. Preliminary evidence suggests that some of these antibodies are protective, but this remains to be definitively established. Moreover, it is unknown whether all infected patients mount a protective immune response and how long any protective effect will last. Data on protective immunity following COVID-19 are emerging. A case series evaluating convalescent plasma for treatment of COVID-19 identified neutralizing activity in plasma of recovered patients that appeared to be transferred to recipients following plasma infusion. Similarly, in another study of 23 patients who recovered from COVID-19, antibodies to the receptor-binding domain of the spike protein and the nucleocapsid protein were detected by enzyme-linked immunosorbent assay (ELISA) in most patients by 14 days following the onset of symptoms; ELISA antibody titers correlated with neutralizing activity. One preliminary study reported that rhesus macaques infected with SARS-CoV-2 did not develop reinfection following recovery and rechallenge; however, this study has not been published in a peer-reviewed journal, and further confirmation of these findings is needed.
______
Figure below shows proposed host immune responses during SARS-CoV-2 infection causing pneumonia:
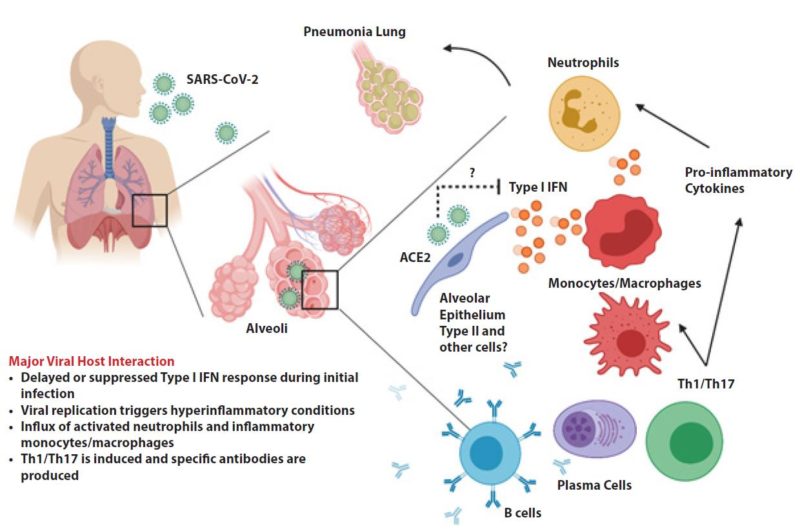
Aerosolized uptake of SARS-CoV-2 leads to infection of ACE2 expressing target cells such as alveolar type 2 cells or other unknown target cells. Virus may dampen anti-viral IFN responses resulting in uncontrolled viral replication. The influx of neutrophils and monocytes/macrophages results in hyperproduction of pro-inflammatory cytokines. The immunopathology of lung may be the result of the “cytokine storms”. Specific Th1/Th17 may be activated and contributes to exacerbate inflammatory responses. B cells/plasma cells produce SARS-CoV-2 specific antibodies that may help neutralize viruses. The question marks indicated events that are still speculative or unknown.
To mount an antiviral response, innate immune cells need to recognize the invasion of the virus, often by pathogen- associated molecular patterns (PAMPs). For RNA virus such as coronavirus, it is known that PAMPs in the form of viral genomic RNA or the intermediates during viral replication including dsRNA, are recognized by either the endosomal RNA receptors, TLR3 and TLR7 and the cytosolic RNA sensor, RIG-I/ MDA5. This recognition event leads to activation of the downstream signaling cascade, i.e. NF-κB and IRF3, accompanied by their nuclear translocation. In the nuclei, these transcription factors induce expression of type I IFN and other pro-inflammatory cytokines and these initial responses comprise the first line defense against viral infection at the entry site. Type I IFN via IFNAR, in turn, activates the JAK-STAT pathway, where JAK1 and TYK2 kinases phosphorylate STAT1 and STAT2. STAT1/2 form a complex with IRF9, and together they move into the nucleus to initiate the transcription of IFN-stimulated genes (ISGs) under the control of IFN-stimulated response element (ISRE) containing promoters. A successful mounting of this type I IFN response should be able to suppress viral replication and dissemination at an early stage.
For SARS-CoV and MERS-CoV, the response to viral infection by type I IFN is suppressed. Both coronaviruses employ multiple strategies to interfere with the signaling leading to type I IFN production and/or the signaling downstream of IFNAR. This dampening strategy is closely associated with the disease severity. At the step of type I IFN induction, SARS-CoV interferes with the signaling downstream of RNA sensors directly or indirectly such as ubiquitination and degradation of RNA sensor adaptor molecules MAVS and TRAF3/6 and inhibiting IRF3 nuclear translocation. MERS-CoV also utilizes some of these strategies with additional mechanism such as repressive histone modification. Once type I IFN is secreted, these two viruses are equipped with mechanism that inhibit IFN signaling such as decreasing STAT1 phosphorylation. The viral proteins involved in the modulation of this host type I IFN response are both structural proteins (such as M, N) and non-structural proteins (ORF proteins). It is speculative that SARS-CoV-2 utilizes similar strategies to modulate the host innate immune response, especially in dampening the type I IFN response but additional novel mechanisms may be uncovered.
Based on the accumulated data for previous coronavirus infection, innate immune response plays crucial role in protective or destructive responses and may open a window for immune intervention. Active viral replication later results in hyperproduction type I IFN and influx of neutrophils and macrophages which are the major sources of pro-inflammatory cytokines. With similar changes in total neutrophils and lymphocytes during COVID19, SARS-CoV-2 probably induces delayed type I IFN and loss of viral control in an early phase of infection. Individuals susceptible to CoVID19 are those with underlying diseases, including diabetes, hypertension, and cardiovascular disease. In addition, few severe cases were reported in young children, when innate immune response is highly effective. These facts strongly indicate that innate immune response is a critical factor for disease outcome.
_____
Inflammatory cytokine storm:
Inflammatory cytokine storm refers to an excessive inflammatory response flaring out of control and the immune system gone awry wherein immune system releases a large number of cytokines, potentially overwhelming the body and possibly leading to fatality. Researchers analyzed peripheral blood samples from patients with severe or critical COVID-19 from The First Affiliated Hospital of University of Science and Technology of China and observed that monocytes and T cells from severe or critical COVID-19 patients decreased significantly compared to normal controls. These aberrant pathogenic T cells from critical ICU care COVID-19 patients showed activated characteristic accompanied with co-expressing IFN-γ and GM-CSF. This phenomenon aroused alarm as GM-CSF has the capability to control diverse pathogenic capabilities of inflammatory myeloid cells, especially monocytes. As expected, inflammatory monocyte with CD14+CD16+ phenotype exists in peripheral blood of COVID-19 patients and has larger population in critical COVID-19 patients from ICU. Note that without any re-stimulation with PMA or incubation with monensin, large amount of IL-6 could be tested from these inflammatory monocytes especially in ICU patients. Therefore, these pathogenic Th1 cells (GM-CSF+IFN-γ+) and inflammatory monocytes (CD14+CD16+ with high expression of IL-6) exist especially in critical ICU COVID-19 patients. Given that large amount of mononuclear inflammatory lymphocytes have been observed in the biopsy samples at autopsy from COVID-19 patients, it is believed that these pathogenic T cells and inflammatory monocytes may enter the pulmonary circulation in large numbers and incite inflammatory storm in severe or critical COVID-19 patients. The pathophysiology of SARS-CoV-2 induced ARDS has similarities to that of severe community-acquired pneumonia caused by other viruses or bacteria. The overproduction of early response proinflammatory cytokines (tumour necrosis factor [TNF], IL-6, and IL-1β) results in what has been described as a cytokine storm, leading to an increased risk of vascular hyperpermeability, multiorgan failure, and eventually death when the high cytokine concentrations are unabated over time.
______
Potential Immune Evasion Mechanisms:
Current observations indicate that coronaviruses are particularly adapted to evade immune detection and dampen human immune responses. This partly explains why they tend to have a longer incubation period, 2-11 days on average compared to influenza, 1-4 days. The longer incubation period is probably due to their immune evasion properties, efficiently escaping host immune detection at the early stage of infection. As a member of the Betacoronavirus genus, immune evasion mechanism is potentially similar to those of SARS-CoV and MERS-CoV. The mechanisms of how SARS-CoV and MERS-CoV modulate host immune responses were extensively reviewed and discussed (see Figure below). In brief, most mechanisms rely on the inhibition of innate immune responses, especially type I interferon recognition and signaling. The viral proteins including membrane (M) or nonstructural (NS) proteins (e.g. NS4a, NS4b, NS15) are the key molecules in host immune modulation. Analysis of two MERS-CoV-infected individuals with different severity found that the type I interferon response in the poor outcome (death) patient was remarkably lower than the recovered patient. For adaptive immune evasion, antigen presentation via MHC class I and MHC class II were downregulated when the macrophages or dendritic cells were infected with MERS-CoV, which would markedly diminish T cells activation.
_
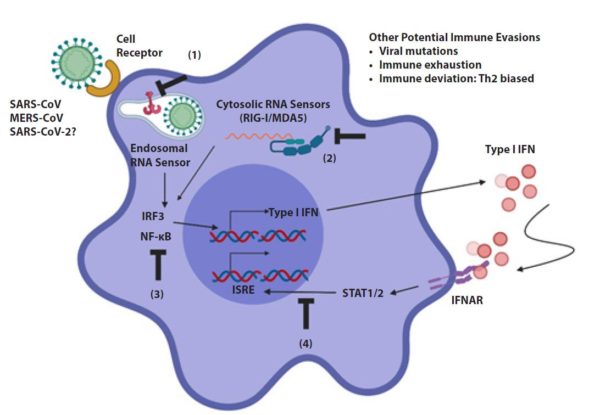
Figure above shows potential immune evasion mechanisms shared by SARS-CoV, MERS-CoV and SARS-CoV-2. Coronaviruses interfere with multiple steps during initial innate immune response, including RNA sensing (1 and 2), signaling pathway of type I IFN production (3), STAT1/2 activation downstream of IFN/IFNAR (4) as indicated by suppressive marks. This delayed or dampening type I IFN responses impinge upon adaptive immune activation. Prolonged viral persistence exacerbates inflammatory responses that may lead to immune exhaustion and immune suppression as a feedback regulatory mechanism. Biased Th2 type response also favors poor outcome of the disease.
_______
Figure below shows schematic representation of the progression of COVID-19 infection and potential adjuvant interventions.
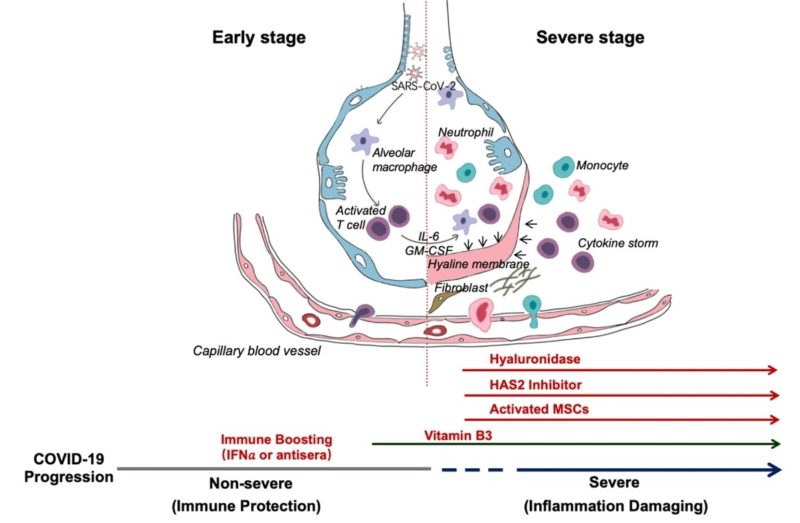
After an incubation period, the invading COVID-19 virus causes non-severe symptoms and elicits protective immune responses. The successful elimination of the infection relies on the health status and the HLA haplotype of the infected individual. In this period, strategies to boost immune response can be applied. If the general health status and the HLA haplotype of the infected individual do not eliminate the virus, the patient then enters the severe stage, when strong damaging inflammatory response occurs, especially in the lungs. At this stage, inhibition of hyaluronan synthase and elimination of hyaluronan can be prescribed. Cytokine activated mesenchymal stem cells can be used to block inflammation and promote tissue reparation. Vitamin B3 can be given to patients starting to have lung CT image abnormalities.
_______
COVID-19 infection: the perspectives on immune responses:
More than 100 years since the outbreak of the 1918 influenza pandemic, we now seem to face another pandemic. The outbreak of the new coronavirus (SARS-CoV-2) infection is spreading to every continent, forcing us to live with this virus for perhaps a long time. Scientists and clinicians have learned much of coronavirus disease 2019, COVID-19, and its pathogenesis: not all people exposed to SARS-CoV-2 are infected and not all infected patients develop severe respiratory illness. Accordingly, SARS-CoV-2 infection can be roughly divided into three stages: stage I, an asymptomatic incubation period with or without detectable virus; stage II, non-severe symptomatic period with the presence of virus; stage III, severe respiratory symptomatic stage with high viral load. From the point of view of prevention, individuals at stage I, the stealth carriers, are the least manageable because, at least on some occasions, they spread the virus unknowingly: indeed, the first asymptomatic transmission has been reported in Germany. The role of asymptomatic SARS-CoV-2 infected individuals in disseminating the infection remains to be defined.
Figure below shows escalating phases of disease progression of Covid-19:
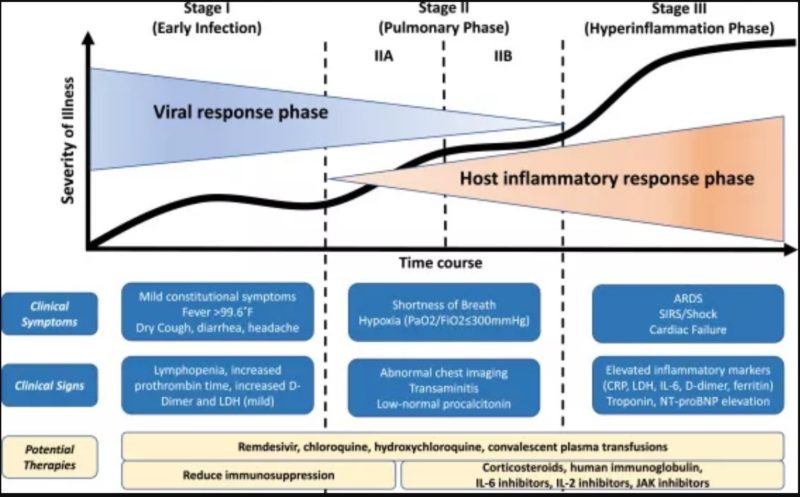
______
Antibody dependent enhancement (ADE) of SARS-CoV-2:
One of the most perplexing questions regarding the current COVID-19 coronavirus epidemic is the discrepancy between the severity of cases observed in the Hubei province of China and those occurring elsewhere in the world. One possible answer is antibody dependent enhancement (ADE) of SARS-CoV-2 due to prior exposure to other coronaviruses. ADE modulates the immune response and can elicit sustained inflammation, lymphopenia, and/or cytokine storm, one or all of which have been documented in severe cases and deaths. ADE also requires prior exposure to similar antigenic epitopes, presumably circulating in local viruses, making it a possible explanation for the observed geographic limitation of severe cases and deaths.
On the other hand, SARS-CoV-1 infection can generate neutralizing antibodies against HCoV-OC43 and HCoV-OC43 infection can generate cross-reactive antibodies against SARS-CoV-1. So prior exposure to corona virus can help or harm in present corona virus infection.
_____
Scientists are still perplexed by the novel coronavirus. But it’s becoming increasingly clear that the immune system plays a critical role in whether you recover from the virus or you die from it. In fact, most coronavirus-related deaths are due to the immune system going haywire in its response, not damage caused by the virus itself. So what exactly is happening in your body when you get the virus, and who is at risk for a more severe infection?
When you first become infected, your body launches its standard innate immune defense like it would for any virus. This involves the release of proteins called interferons that interfere with the virus’s ability to replicate inside the body’s cells. Interferons also recruit other immune cells to come and attack the virus in order to stop it from spreading. Ideally, this initial response enables the body to gain control over the infection quickly, although the virus has its own defenses to blunt or escape the interferon effect.
The innate immune response is behind many of the symptoms you experience when you’re sick. These symptoms typically serve two purposes: One is to alert the body that an attack has occurred — this is thought to be one of the roles of fever, for example. The other purpose is to try and get rid of the virus, such as expelling the microscopic particles through cough or diarrhea.
The novel coronavirus gains entry into a cell by latching onto a specific protein called the ACE2 receptor that sits on the cell’s surface. These receptors are most abundant in the lungs, which is why Covid-19 is considered a respiratory illness. However, the second-highest number of ACE2 receptors are in the intestines, which could explain why many people with the coronavirus experience diarrhea. Because the virus is acquired through droplets, if it comes into your mouth and enters your oropharynx, it has two places where it can go from there. It can transition into the lung from the oropharynx when you breathe in, or if you have a swallow reflex, it’ll go down to your stomach. That’s how it can affect both sites.
The goal of the innate immune defense is to contain the virus and prevent it from replicating too widely so that the second wave of the immune system — the adaptive, or virus-specific response — has enough time to kick in before things get out of hand. The adaptive immune response consists of virus-specific antibodies and T cells that the body develops that can recognize and more quickly destroy the virus. These antibodies are also what provide immunity and protect people from becoming reinfected with the virus after they’ve already had it.
In some people, however, the virus will replicate and spread rapidly before the immune system wrestles it under control. One reason this can happen is if a high quantity of viral particles infect the body — which is why doctors and nurses, who are exposed to huge amounts of the virus multiple times a day caring for patients, can have more severe infections even if they are young and healthy. The more virus there is, the harder it is for the immune system to manage.
Another reason the body can lose control over the virus lies in the immune system itself. The most vulnerable populations during the pandemic are elderly people, whose immune systems naturally start to decline with age, and people who are immunosuppressed because of another illness or medication. A suppressed immune system can result in a weaker initial interferon response or a delayed antibody response, allowing the virus to spread from cell to cell relatively unchecked.
If the virus is able to take up residence in the lungs, the disease can progress to pneumonia as more cells become infected and inflamed. Part of the damage is caused by the virus, but an even greater amount is due to the immune system itself trying to destroy and get rid of those infected cells. At this point, the disease can still go in two directions: The immune response can remain stable and regain control over the virus, eventually clearing it through T cell and antibody activity. Or the immune system can freak out and start to overrespond, churning out more and more inflammatory proteins, called cytokines, in a frantic attempt to wipe out the virus. It’s this second path that causes substantial cell death in the lungs, resulting in the most severe infections, acute respiratory distress syndrome, and even death. The people that do the worst, the ones where it leads to death, almost invariably will have this exaggerated host response — the cytokine storm. The lungs fill up with fluid, and they can’t oxygenate. Or they develop widespread sepsis, can’t support their blood pressure, and die. All of this is either primarily driven by or greatly exacerbated by the host [immune] response.
The elderly and immunocompromised are particularly vulnerable to this type of response as their underactive immune system suddenly kicks into hyperdrive and becomes overactive. Interestingly the people who have the most suppressed immune responses seem to develop the most aberrant immune responses in the later stages of disease.
Most of the clinical trials conducted so far have involved treating these severe cases, which on the surface makes sense — you want to give the potentially effective drugs to the sickest people in case it can help save them. But it might be too late at this point because you no longer only need to quash the infection, you also need to temper the immune system itself. So antiviral drugs be given earlier, when people are just starting to get sick, to help them fight the virus more effectively and prevent them from progressing to the later stages. For people who are already experiencing the cytokine storm, immune-suppressing drugs in combination with antivirals may be most beneficial.
The most important takeaway is that there are different stages of this disease, and how you apply treatment at which phase of the disease will carry a lot of weight in terms of patient outcome.
For now, your best defense against the virus is to support your immune system with sleep, exercise, and good nutrition and, most importantly, to wash your hands, wear masks and practice social distancing so you don’t get infected in the first place.
_____
Could Old Vaccines for other microorganism protect against COVID-19?
Scientists are dusting off some decades-old vaccines against other microorganisms to see if they could provide a little stopgap protection against COVID-19 until a more precise shot arrives. It may sound odd: Vaccines are designed to target a specific disease. But vaccines made using live strains of bacteria or viruses seem to boost the immune system’s first line of defense, a more general way to guard against germs. And history books show that sometimes translates into at least some cross-protection against other, completely different bugs. There’s no evidence yet that the approach would rev up the immune system enough to matter against the new coronavirus. But given that a brand-new vaccine is expected to take 12 to 18 months, some researchers say it’s time to put this approach to a faster test, starting with a tuberculosis vaccine.
BCG is given mostly to newborns in developing countries, and it offers only partial protection against TB, a bacterial infection. But observational studies showed during childhood, the vaccinated toddlers had better overall survival, including from respiratory viruses. In 2018, Netea’s team published a more direct test. They showed BCG stimulates initial immune defenses enough that it at least partly blocked another virus given experimentally a month later. What about oral polio vaccine? Those clues emerged first from the former Soviet Union where published research showed flu cases dropped markedly after oral polio vaccination. In 2015, Danish researchers also found some hints of cross-protection after oral polio vaccinations. The oral drops still are used in developing countries while the U.S. and other areas that have eliminated polio use the inactivated shot for routine childhood vaccines. BCG appears to be reprogramming innate immune cells so they can more readily eliminate the germ up front, said Netea, the Dutch researcher. Scientists not involved in the effort to try these vaccines against COVID-19 say it’s worthwhile to test. “The scientific rationale I think is quite logical,” said Nizet, the UC-San Diego immune specialist. “The unknown is whether coronaviruses are in the spectrum of things that are efficiently protected” by that first-line innate immunity. Some scientists have theorized that countries with large BCG-vaccinated populations might fare better in the pandemic. But given problems with accurately counting the toll, it’s far too early to draw any conclusions, a caution the WHO reiterated recently. The World Health Organization issued a stern warning not to use the TB vaccine against COVD-19, unless and until studies prove it works. Already nearly 1,500 Dutch health care workers have rolled up their sleeves for one study that Netea’s team is leading. It uses that TB vaccine, named BCG, which is made of a live but weakened bacterial cousin of the TB germ. In Australia, researchers hope to enroll 4,000 hospital workers to test BCG, too, and 700 already have received either the TB vaccine or a dummy shot. Similar research is being planned in other countries, including the U.S.
Oral polio vaccine, drops made of live but weakened polio viruses. The Baltimore-based Global Virus Network hopes to begin similar studies with that vaccine and is in talks with health authorities, network co-founder Dr. Robert Gallo told The Associated Press. Rapid studies are needed to tell if there could be “long-ranging effects for any second wave of this,” said Gallo, who directs the Institute of Human Virology at the University of Maryland School of Medicine.
At the U.S. National Institutes of Health, researchers are in early discussions about proposals to study the TB and polio vaccines as a possible COVID-19 defense. There’s a big caution: Live vaccines are risky for people with weakened immune systems, and shouldn’t be tried against COVID-19 outside of a research trial, said Dr. Denise Faustman, immunobiology chief at Massachusetts General Hospital, who is planning a TB vaccine study. “You can’t just roll it out,” she stressed. But, “it’s kind of an amazing opportunity to prove or disprove this off-target effect.”
_____
_____
Clinical manifestation:
COVID-19 typically presents with systemic and/or respiratory manifestations. Some individuals infected with SARS-CoV-2 are asymptomatic and can act as carriers. Some also experience mild gastrointestinal or cardiovascular symptoms, although these are much less common. The full spectrum of clinical manifestation of COVID-19 remains to be determined. Symptoms and signs are non-specific:
Common:
- fever (85-90%)
- cough (65-70%)
- fatigue (35-40%)
- sputum production (30-35%)
- shortness of breath (15-20%)
Less common:
- myalgia/arthralgia (10-15%)
- headaches (10-15%)
- sore throat (10-15%)
- chills (10-12%)
- pleuritic pain
Rare:
- nausea, vomiting, nasal congestion (<10%), diarrhea (<5%)
- palpitations, chest tightness
COVID-19 sufferers have reported high rates of disturbances of smell and taste, including anosmia, hyposmia, ageusia and dysgeusia. Various reports suggest patients with the disease may have symptoms of conjunctivitis, and those affected, may have positive viral PCR in their conjunctival fluid. A recent report suggests that cutaneous lesions may also be seen, similar to many other viral infections. In a cohort of 88 patients, 20% developed skin disease, most commonly an erythematous rash. Most of the skin abnormalities were self-limited, resolving in a few days.
Pediatric:
In the main, the clinical presentation in children with COVID-19 is milder than in adults. Symptoms are similar to any acute respiratory tract infection, encompassing most commonly pyrexia, dry cough, sore throat, sneezing, myalgia and lethargy. Wheezing has also been noted. Other less common (<10%) symptoms in children included diarrhea, lethargy, rhinorrhea and vomiting.
___
While there is no typical case, there are a range of scenarios, illustrated in the graphic below.
At its most brief, the virus might incubate for just two days, and a person might have a mild case of Covid-19 lasting just two weeks, for a total duration of 14 days from infection. In more severe cases, a person might suffer anywhere from three weeks (light orange in the graphic) to six weeks. Among those who die, the final outcome can come as quickly as two weeks after symptoms start, or up to eight weeks later. Add a possible 14-day incubation period, and the longest likely scenario, then, is 10 total weeks from the time of infection to a person’s death.
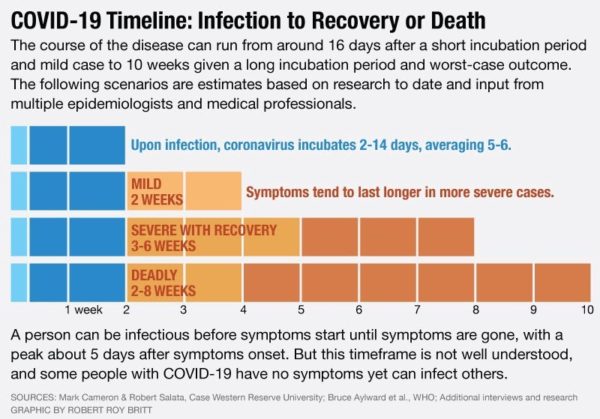
____
Clinical course is predictable. About 2-11 days after exposure (day 5 on average) flu like symptoms start. Common are fever, headache, dry cough, myalgias (back pain), nausea without vomiting, abdominal discomfort with some diarrhea, loss of smell, anorexia, fatigue. On Day 5 of symptoms- increased dyspnoea, and bilateral viral pneumonia result from direct viral damage to lung parenchyma. On Day 10- Cytokine storm leading to acute ARDS and multiorgan failure occur. You can literally watch it happen in a matter of hours.
Patient presentation is varied. Patients are coming in hypoxia (SpO2 75%) without dyspnoea. Covid patients can also present with encephalopathy, renal failure from dehydration, DKA, bilateral interstitial pneumonia, myocarditis, pericarditis, new onset CHF and new onset atrial fibrillation.
_____
Risk stratification and survival rate:
The case-fatality rate (CFR) continues to change as the pandemic continues. Table below presents the CFR in China via age groups. Age greater than 60 years is considered a mortality risk factor.
Case-Fatality Rate Organized by Age Group:
|
Age group (years) |
Case-Fatality Rate |
|
Overall |
1.6 % |
|
0–9 |
0.0094 % |
|
10–19 |
0.022 % |
|
20–29 |
0.091 % |
|
30–39 |
0.18 % |
|
40–49 |
0.4 % |
|
50–59 |
1.3 % |
|
60–69 |
4.6 % |
|
70–79 |
8.0 % |
|
80+ |
14.8 % |
_
Table below presents the risk stratification commonly used in studies. About 81 % are mild cases, 14 % are severe, and 5 % are critical. Laboratory markers including LDH, high-sensitivity CRP, and lymphocyte count estimate the prognosis for these cases.
Risk Stratification of COVID-19 Cases:
|
Severity |
Description |
|
Mild |
COVID-19 positive |
|
Severe |
COVID-19 positive + RR > 30 or SpO2<93 % |
|
Critical |
COVID-19 positive + mechanical ventilation, evidence of multiorgan failure, or shock |
RR-Respiratory Rate; SpO2-Oxygen Saturation.
_____
Complications and clinical outcomes:
Based on the current information, most patients had a good prognosis, while a few patients were in critical condition, especially the elderly and those with chronic underlying diseases. As of 1 March 2020, a total of 79,968 confirmed cases, including 14,475 (18.1%) with severe illness, and 2873 deaths (3.5%) in mainland China had been reported by WHO. Complications included acute respiratory distress syndrome (ARDS), arrhythmia, shock, acute kidney injury, acute cardiac injury, liver dysfunction and secondary infection. The poor clinical outcome was related to disease severity. The disease tends to progress faster in elderly people, with the median number of days from the occurrence of the first symptoms to death shorter among people aged 65 years or more. The elderly male with comorbidities and ARDS showed a higher death risk.
_____
Differential diagnoses:
- viral pneumonia
-influenza pneumonia A and B
-paramyxovirus pneumonia
-cytomegalovirus (CMV) pneumonia
-adenovirus pneumonia
-SARS-CoV pneumonia
-MERS coronavirus
-HSV pneumonia
-respiratory syncytial virus (RSV) pneumonia
- atypical bacterial pneumonia
-mycoplasma pneumonia
-chlamydia pneumonia
- pulmonary edema
- interstitial lung disease
-cryptogenic organizing pneumonia
-chronic eosinophilic pneumonia (CEP)
-acute fibrinous organizing pneumonia
-rheumatoid arthritis-associated pneumonia
- pulmonary alveolar proteinosis
_______
_______
Laboratory Diagnosis:
_
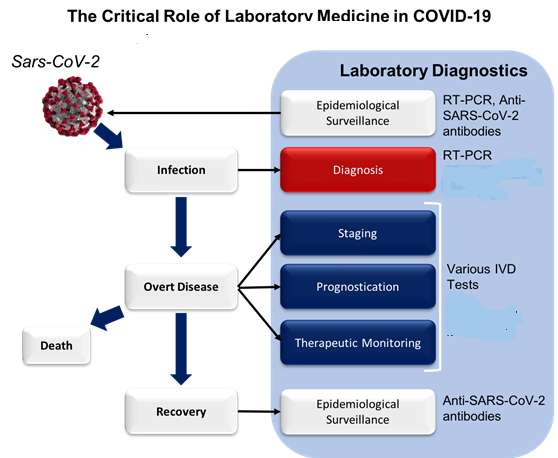
_
The definitive test for SARS-CoV-2 is the real-time reverse transcriptase-polymerase chain reaction (RT-PCR) test. RT-PCR remains the gold standard for diagnosing COVID-19. While its specificity is nearly 100 % from having no reported false positive cases or cross-reactivity with other viruses or estranged oligonucleotides, the sensitivity is low. It is believed to be highly specific, but with sensitivity reported as low as 60-70% and as high as 95-97%. In general, the accuracy of the RT-PCR test is about 70 per cent—that is 30 people will have false negative tests (negative tests in infected patients), for every 100 tested. Thus, false negatives are a real clinical problem, and several negative tests might be required in a single case to be confident about excluding the disease. Studies have started performing two sequential RT-PCRs to ensure true negative cases. RT-PCR tends to present negative-to-positive at a mean of 5.1 days, and positive-to-negative at 6.9 days. It is recommended to acquire a repeat RT-PCR 3 days after an initial negative result. Factors that may contribute to the low sensitivity of one RT-PCR may be from immature technology, variation of detection by manufacturers, low initial viral load, and improper sampling. As expected, the asymptomatic, patients in the incubation period and those in the early stage of the disease have lower viral loads, leading to false negative.
_
SARS-CoV-2 is an RNA virus, so its genetic material is more transient and fragile than DNA. Because of that, samples should ideally be transported to testing laboratories on ice or in special media to prevent them from degrading. Once at the lab, the RNA must first be converted to DNA using an enzyme called reverse transcriptase. Then, specific sequences of DNA (primers) designed to recognize complementary virus sequences are added, so that another enzyme—usually a modified form of Taq polymerase—can make a copy of a short length of viral DNA. This process is repeated for 20-30 cycles, exponentially amplifying the amount of viral DNA so that it can be detected. Having the entire virus genome was crucial for designing primers that would detect only SARS-CoV-2 and not SARS-CoV or any other closely related coronaviruses. Different tests target different parts of the SARS-CoV-2 genome, and the World Health Organization (WHO) has issued their own protocol specifying recommended primers and procedures. Target gene for diagnosis may be different by country. Accordingly, target genes for screening and confirmatory assays by RT-PCR are ORF1ab and N in Chinese laboratory protocol, while RdRP, E and N are checked in Germany. Furthermore, three targets in N gene are considered in the US protocol.
_
While studies recommend two sequential RT-PCRs to ensure true negativity, testing kits are sparse during the pandemic. Some studies suggest employing chest CT scans if the initial RT-PCR is negative. CT scans have a sensitivity of 98 %, despite a lower specificity. The Chinese General Office of National Health Committee initially allowed positive CT scan findings to be diagnostic for COVID-19 without RT-PCR, but this recommendation was removed in a more recent list of recommendations.
_
Specimen collection:
In the United States, the CDC recommends collection of a nasopharyngeal swab specimen to test for SARS-CoV-2. An oropharyngeal swab can be collected but is not essential; if collected, it should be placed in the same container as the nasopharyngeal specimen. Oropharyngeal, nasal mid-turbinate, or nasal swabs (of both nares) are acceptable alternatives for symptomatic patients if nasopharyngeal swabs are unavailable.
Expectorated sputum should be collected from patients with productive cough; induction of sputum is not recommended. A lower respiratory tract aspirate or bronchoalveolar lavage should be collected from patients who are intubated.
Results are generally available within a few hours to 2 days. The RT-PCR test performed with throat swabs is only reliable in the first week of the disease. Later on the virus can disappear in the throat while it continues to multiply in the lungs. For infected people tested in the second week, alternatively sample material can then be taken from the deep airways by suction catheter or coughed up material (sputum) can be used.
Interpretation:
A positive test for SARS-CoV-2 generally confirms the diagnosis of COVID-19. However, false-negative tests from upper respiratory specimens have been well documented. If initial testing is negative but the suspicion for COVID-19 remains and determining the presence of infection is important for management or infection control, repeating the test is suggested. In such cases, the WHO also recommends testing lower respiratory tract specimens, if possible. Infection control precautions for COVID-19 should continue while repeat evaluation is being performed. In many cases, because of the limited availability of testing and concern for false-negative results, the diagnosis of COVID-19 is made presumptively based on a compatible clinical presentation in the setting of an exposure risk (residence in or travel to an area with widespread community transmission or known contact).
The accuracy and predictive values of SARS-CoV-2 testing have not been systematically evaluated, and the sensitivity of testing likely depends on the precise RT-PCR assay, the type of specimen obtained, the quality of the specimen, and duration of illness at the time of testing. In a study of 51 patients who were hospitalized in China with fever or acute respiratory symptoms and ultimately had a positive SARS-CoV-2 RT-PCR test (mainly on throat swabs), 15 patients (29 percent) had a negative initial test and only were diagnosed by serial testing. The likelihood of a positive upper respiratory RT-PCR may be higher early in the course of illness. One study using a combination of RT-PCR and an IgM serologic test to make the diagnosis of COVID-19 suggested that RT-PCR positivity rates were >90 percent on days 1 to 3 of illness, <80 percent at day 6, and <50 percent after day 14; ; however, these results should be interpreted with caution, since the serologic test used was not validated for detection of acute infection and IgM tests are generally prone to false positivity.
Lower respiratory tract specimens may have higher viral loads and be more likely to yield positive tests than upper respiratory tract specimens.
A recent JAMA article investigated biodistribution among different clinical specimens of inpatients with COVID-19. Study findings are summarized below:
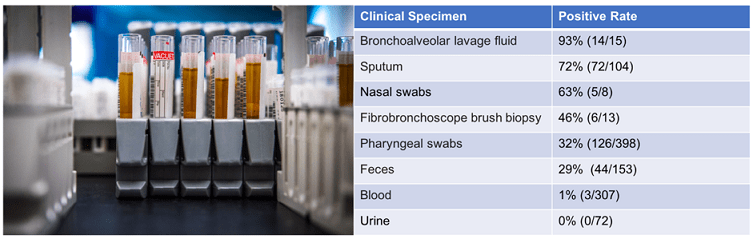
In a study of 205 patients with COVID-19 who were sampled at various sites, the highest rates of positive viral RNA tests were reported from bronchoalveolar lavage (95 percent, 14 of 15 specimens) and sputum (72 percent, 72 of 104 specimens), compared with oropharyngeal swab (32 percent, 126 of 398 specimens). Data from this study suggested that viral RNA levels are higher and more frequently detected in nasal compared with oral specimens, although only eight nasal swabs were tested. While certainly not definitive, this study raises concerns about “ruling out” COVID-19 on the basis of combined pharyngeal and nasal swabs obtained at a single time point. Sensitivity will also depend on the technical characteristics of the test and method of specimen collection. The presence of SARS-CoV-2 in the stool suggests another possible route of transmission. Viremia was uncommon but indicates the possibility of transmission from at least some infected deceased organ donors.
_
Other tests — Serologic tests, as soon as generally available and adequately evaluated, should be able to identify patients who have either current or previous infection but a negative PCR test. In one study that included 58 patients with clinical, radiographic, and epidemiologic features suspicious for COVID-19 but with negative SARS-CoV-2 PCR testing, an IgM enzyme-linked immunosorbent assay (ELISA) was positive in 93 percent (and was negative when tested separately on plasma specimens that predated the COVID-19 outbreak). In the United States, several serologic tests have been granted emergency use authorization by the Food and Drug Administration for use by laboratories certified to perform moderate- and high-complexity tests. Although several manufacturers are selling rapid, point-of-care tests based on antigen testing or antibody detection, the WHO does not recommend these tests because of accuracy concerns in the absence of validation studies.
_
For safety reasons, specimens from a patient with suspected or documented COVID-19 should not be submitted for viral culture.
Testing for other pathogens — If influenza is circulating in the community, it is reasonable to also test for influenza when testing for SARS-CoV-2, as this could have management implications. However, detection of another viral (or bacterial) pathogen does not necessarily rule out SARS-CoV-2 in locations where there is widespread transmission. Coinfection with SARS-CoV-2 and other respiratory viruses, including influenza, has been reported.
_
False-negative results on RT-PCR:
Reverse-transcriptase polymerase chain reaction (RT-PCR) tests provide little diagnostic value immediately after SARS-CoV-2 exposure. The probability of false-negative results is 100% on the day of exposure, falling to 38% when symptoms begin roughly 4 days later and then to 20% at 3 days after symptom onset. Then it begins to increase again. In the Annals of Internal Medicine, the researchers conclude: “Care must be taken in interpreting RT-PCR tests for SARS-CoV-2 infection — particularly early in the course of infection — when using these results as a basis for removing precautions intended to prevent onward transmission. If clinical suspicion is high, infection should not be ruled out on the basis of RT-PCR alone, and the clinical and epidemiologic situation should be carefully considered.”
_____
Rapid diagnostic tests based on antigen detection:
One type of rapid diagnostic test (RDT) detects the presence of viral proteins (antigens) expressed by the COVID-19 virus in a sample from the respiratory tract of a person. If the target antigen is present in sufficient concentrations in the sample, it will bind to specific antibodies fixed to a paper strip enclosed in a plastic casing and generate a visually detectable signal, typically within 30 minutes. The antigen(s) detected are expressed only when the virus is actively replicating; therefore, such tests are best used to identify acute or early infection.
How well the tests work depends on several factors, including the time from onset of illness, the concentration of virus in the specimen, the quality of the specimen collected from a person and how it is processed, and the precise formulation of the reagents in the test kits. Based on experience with antigen-based RDTs for other respiratory diseases such as influenza, in which affected patients have comparable concentrations of influenza virus in respiratory samples as seen in COVID-19, the sensitivity of these tests might be expected to vary from 34% to 80%. Based on this information, half or more of COVID-19 infected patients might be missed by such tests, depending on the group of patients tested. These assumptions urgently require further study to understand whether they are accurate. Additionally, false-positive results – that is, a test showing that a person is infected when they are not – could occur if the antibodies on the test strip also recognize antigens of viruses other than COVID-19, such as from human coronaviruses that cause the common cold. If any of the antigen detection tests that are under development or commercialized demonstrate adequate performance, they could potentially be used as triage tests to rapidly identify patients who are very likely to have COVID-19, reducing or eliminating the need for expensive molecular confirmatory testing.
With the limited data now available, WHO does not currently recommend the use of antigen-detecting rapid diagnostic tests for patient care, although research into their performance and potential diagnostic utility is highly encouraged.
_____
Now I discuss few studies on Covid-19 testing:
_
Study-1
SARS-CoV-2–Positive Sputum and Feces after conversion of Pharyngeal Samples in patients with COVID-19:
Pharyngeal swabs are widely used to determine the appropriateness of a patient’s discharge from the hospital and whether isolation continues to be required. Authors observed 22 patients who had positive RT-PCR results for SARS–CoV-2 in the sputum or feces after pharyngeal swabs became negative. These finding raise concern about whether patients with negative pharyngeal swabs are truly virus-free, or sampling of additional body sites is needed. It is important to emphasize, however, that it is not known whether the positive RT-PCR results for SARS–CoV2 observed here indicate that a patient continues to pose a risk for infection to others. Related, positive throat samples (after negative samples) after hospital discharge have been reported.
_
Study-2
Virological assessment of hospitalized patients with COVID-2019, a study:
The virus replicates in the upper respiratory tract and can persist in sputum after clearance from the throat. To clarify the pathogenesis of COVID-19, researchers in Germany conducted a virologic analysis of serial samples from nine young to middle-aged hospitalized patients with epidemiologically linked, reverse-transcriptase–polymerase chain reaction (RT-PCR)–confirmed SARS-CoV-2 infections (all had known contacts to an index case) and without significant underlying disease. Except for one initially asymptomatic patient, all had mild symptoms, including cough, fever, and diarrhea. Four developed disorders of taste, smell, or both, and one reported dyspnea.
All naso- and oropharyngeal swabs obtained during the first 5 symptomatic days were positive (average viral RNA load, 6.8×10⁵ copies/swab; maximum, 7.1×10⁸). Detection rates dropped to 40% after day 5, with one swab testing positive 28 days after onset. Paired swab and sputum samples taken 2 to 4 days after symptom onset showed higher virus concentrations in swab (2 patients), higher virus concentrations in sputum (2 patients), or similar concentrations in both (5 patients). Virus was readily isolated during the first week (17% of swabs and 83% of sputum samples), but no virus was isolated from samples obtained after day 8 despite continued positivity by RT-PCR. Stool RNA was positive; although no virus was isolated, high levels suggested active replication in the gastrointestinal tract. Stool and sputum remained RNA positive throughout 3 weeks. Seroconversion occurred in 50% of patients by day 7 and 100% by day 14. Sequencing of viral genomes revealed distinct genomes in throat and sputum samples, suggesting independent viral replication in throat and lung.
High viral loads and successful isolation from early throat swabs suggested potential virus replication in upper respiratory tract tissues. To obtain proof of active virus replication in absence of histopathology, authors conducted RT-PCR tests to identify viral subgenomic messenger RNAs (sgRNA) directly in clinical samples. Viral sgRNA is only transcribed in infected cells and is not packaged into virions, therefore indicating the presence of actively infected cells in samples. Viral sgRNA was compared against viral genomic RNA in the same sample. In sputum samples taken on days 4/5, 6/7, and 8/9, a time in which active replication in sputum was obvious in all patients as per longitudinal viral load courses, mean normalized sgRNA per genome ratios were ~0.4%. Swabs taken up to day 5 were in the same range, while no sgRNA was detectable in swabs thereafter. Together, these data indicate active replication of SARS-CoV-2 in the throat during the first 5 days after symptoms onset. No, or only minimal, indication of replication in stool was obtained by the same method.
The clinical courses in subjects under study were mild, all being young- to middle-aged professionals without significant underlying disease. Apart from one patient, all cases were first tested when symptoms were still mild or in the prodromal stage, a period in which most patients would present once there is general awareness of a circulating pandemic disease. Diagnostic testing suggests that simple throat swabs will provide sufficient sensitivity at this stage of infection. This is in stark contrast to SARS. For instance, only 38 of 98 nasal or nasopharyngeal swab samples tested positive by RT-PCR in SARS patients in Hong Kong. Also, viral load differed considerably. In SARS, it took 7 to 10 days after onset until peak RNA concentrations (of up to 5×10⁵ copies per swab) were reached. In the present study, peak concentrations were reached before day 5, and were more than 1000 times higher. Successful live virus isolation from throat swabs is another striking difference from SARS, for which such isolation was rarely successful. Altogether, this suggests active virus replication in upper respiratory tract tissues, where only minimal ACE-2 expression is found and SARS-CoV is therefore not thought to replicate. At the same time, the concurrent use of ACE-2 as a receptor by SARS-CoV and SARS-CoV-2 corresponds to a highly similar excretion kinetic in sputum, with active replication in the lung. SARS-CoV was found in sputum at mean concentrations of 1.2-2.8×10⁶ copies per mL, which corresponds to observations made here.
Whereas proof of replication by histopathology is awaited, extended tissue tropism of SARSCoV-2 with replication in the throat is strongly supported by studies of sgRNAtranscribing cells in throat swab samples, particularly during the first 5 days of symptoms. Striking additional evidence for independent replication in the throat is provided by sequence findings in one patient who consistently showed a distinct virus in her throat as opposed to the lung. Critically, the majority of patients in the present study seemed to be already beyond their shedding peak in upper respiratory tract samples when first tested, while shedding of infectious virus in sputum continued through the first week of symptoms. Together, these findings suggest a more efficient transmission of SARS-CoV-2 than SARS-CoV through active pharyngeal viral shedding at a time when symptoms are still mild and typical of upper respiratory tract infection. Later in the disease, COVID-19 then resembles SARS in terms of replication in the lower respiratory tract. Of note, the two patients who showed some symptoms of lung affection showed a prolonged viral load in sputum. Studies should look at the prognostic value of an increase of viral load beyond the end of week 1, potentially indicating aggravation of symptoms.
One of the most interesting hypotheses to explain a potential extension of tropism to the throat is the presence of a polybasic furin-type cleavage site at the S1-S2 junction in the SARS-CoV-2 spike protein that is not present in SARS-CoV. Insertion of a polybasic cleavage site in the S1-S2 region in SARS-CoV-2 was shown to lead to a moderate but discernible gain of fusion activity that might result in increased viral entry in tissues with low density of ACE2 expression. High viral loads present in the throat during early mild or prodromal stages help to explain the more-efficient transmission of SARS-CoV-2 relative to SARS-CoV.
_
Study-3
Ocular shedding of virus:
Assessing Viral Shedding and Infectivity of Tears in Coronavirus Disease 2019 (COVID-19) Patients, a study:
Seventeen coronavirus disease 2019 (COVID-19) patients were recruited for this prospective study in Singapore after obtaining informed consent. On some days, both tears and nasopharyngeal swab samples were collected at the same time. These samples were delivered to different labs for processing. Samples were used to inoculate Vero-E6 cells (American Type Culture Collection [ATCC] CRL-1586TM). After 4 days of incubation, cells were observed for the presence of cytopathic effect. All tear samples showed negative results, even when nasopharyngeal swab samples continued to show positive results. Furthermore, patients with symptoms of upper respiratory tract infections did not demonstrate any viral shedding in tears, suggesting that the hypothesis of the lacrimal duct as a viral conduit may not be true. Most importantly, only 1 patient showed ocular symptoms during the disease course, and no evidence of SARS-CoV-2 could be found in the tear samples. This suggests that transmission through tears regardless of the phase of infection likely is low.
_
Study-4
Consistent Detection of 2019 Novel Coronavirus in Saliva, a study:
The 2019 novel coronavirus (2019-nCoV) was detected in the self-collected saliva of 91.7% (11/12) of patients. Serial saliva viral load monitoring generally showed a declining trend. Live virus was detected in saliva by viral culture. Saliva is a promising noninvasive specimen for diagnosis, monitoring, and infection control in patients with 2019-nCoV infection.
There are several advantages in using saliva specimens for the diagnosis of 2019-nCoV. First, saliva specimens can be provided by the patient easily without any invasive procedures. Therefore, the use of saliva specimens could reduce the risk of nosocomial 2019-nCoV transmission. Cases of 2019-nCoV infection among healthcare workers have been found, with at least 1 reported death. Second, the use of saliva will allow specimen collection outside the hospitals where airborne-infection isolation rooms are not available, such as in outpatient clinics or in the community. In the setting where a large number of individuals require screening, saliva would represent a practical noninvasive specimen type. Third, since healthcare workers are not required to collect saliva specimens, the use of saliva specimens will eliminate the waiting time for specimen collection, and hence the results would be available much sooner. This is especially important in busy clinical settings where the number of available staff is limited.
A new study out of Yale University has found that saliva samples are better than the deep throat or nasal swabs in testing for the coronavirus. The study, which was led by the Yale School of Public Health at Yale New Haven Hospital, tested 44 inpatients and 98 health care workers. They found that saliva samples collected from just inside the mouth afforded higher detection sensitivity and reliability compared with the recommended deep throat/nasal swab approach. The researchers also found that with a self-sample collection of saliva there was less variability in the results. Furthermore, a swab is not required, the saliva can be directly expelled (spit) into a sterile container.
_
Study-5
Enteric involvement of coronaviruses:
Is faecal–oral transmission of SARS-CoV-2 possible?
Data exist to support the notion that SARS-CoV and MERS-CoV are viable in environmental conditions that could facilitate faecal–oral transmission. SARS-CoV RNA was found in the sewage water of two hospitals in Beijing treating patients with SARS. When SARS-CoV was seeded into sewage water obtained from the hospitals in a separate experiment, the virus was found to remain infectious for 14 days at 4°C, but for only 2 days at 20°C.
SARS-CoV can survive for up to 2 weeks after drying, remaining viable for up to 5 days at temperatures of 22–25°C and 40–50% relative humidity, with a gradual decline in virus infectivity thereafter. Viability of the SARS-CoV virus decreased after 24 h at 38°C and 80–90% relative humidity. MERS-CoV is viable in low temperature, low humidity conditions. The virus was viable on different surfaces for 48 h at 20°C and 40% relative humidity, although viability decreased to 8 h at 30°C and 80% relative humidity conditions. At present, no viability data are available for SARS-CoV-2.
The viability of SARS-CoV and MERS-CoV under various conditions and their prolonged presence in the environment suggest the potential for coronaviruses to be transmitted via contact or fomites. SARS-CoV and MERS-CoV are both viable in conditions with low temperatures and humidity. Although direct droplet transmission is an important route of transmission, faecal excretion, environmental contamination, and fomites might contribute to viral transmission. Considering the evidence of faecal excretion for both SARS-CoV and MERS-CoV, and their ability to remain viable in conditions that could facilitate faecal–oral transmission, it is possible that SARS-CoV-2 could also be transmitted via this route.
COVID-19 is also spread by Fecal-Oral Route:
New research from China indicates that the novel coronavirus is also spread by fecal-oral transmission, not just by respiratory droplets or environmental contact.
Hong Shan, MD, PhD, of Fifth Affiliated Hospital, Sun Yat-sen University, in Zhuhai, Guangdong Province, and colleagues noted that the gastrointestinal tract is a welcoming environment for the virus, also known as severe acute respiratory syndrome (SARS) CoV-2. “Our immunofluorescent data showed that the ACE2 protein, which has been proved to be a cell receptor for SARS-CoV-2, is abundantly expressed in the glandular cells of gastric, duodenal, and rectal epithelia, supporting the entry of SARS-CoV-2 into the host cell,” the team wrote.
The study looked at 73 patients hospitalized for possible COVID-19 and tested from February 1 to 14, 2020. Testing included serum, nasopharyngeal, and oropharyngeal swabs, as well as urine, stool, and tissue samples in accordance with China Disease Control and Prevention guidelines. A total of 39 patients (53.4%; 25 males and 14 females), tested positive for fecal SARS-CoV-2 RNA. The age of patients with positive RNA in stool ranged from 10 months to 78 years, and the duration of stool positivity ranged from 1 to 12 days. Furthermore, the stool of 17 patients (23.3%) remained positive even after respiratory samples tested negative.
Intracellular staining of viral nucleocapsid protein in gastric, duodenal, and rectal epithelia showed that the virus infected glandular epithelial cells in these areas, the researchers reported. “The continuous positive detection of the viral RNA from feces suggests that the infectious virions are secreted from the virus-infected gastrointestinal cells.” “Therefore, we strongly recommend that RT-PCR testing for SARS-CoV-2 from feces should be performed routinely in SARS-CoV-2 patients, and Transmission-Based Precautions for hospitalized SARS-CoV-2 patients should continue if feces tests positive by rRT-PCR testing,” Shan and co-authors advised.
Asked for his perspective, Douglas A. Corley, MD, PhD, of Kaiser Permanente San Francisco Medical Center and the University of California San Francisco, who was not involved with the research said : “A better understanding of how this virus is transmitted is key to preventing its spread. These observations may also help in improving how the disease is diagnosed through testing for the presence of virus in the stool of patients suspected of harboring this virus.”
Also commenting, Peter Hotez, MD, of the National School of Tropical Medicine at Baylor College of Medicine in Houston, said the study adds to scientific discussions about whether gastrointestinal transmissions are relevant to the novel coronavirus infections, “especially in light of clinical descriptions of COVID-19 patients admitted to surgical wards in Wuhan who were thought to have abdominal emergencies.” “It is a potentially important finding of relevance to the emergence of COVID-19 globally, but the exact extent of gastrointestinal transmission of the virus remains unclear,” Hotez said. He added that whether fecal oral transmission is common or uncommon therefore requires additional investigation: “Also unclear is the significance of detection of viral RNA in the feces of patients with pulmonary disease, including those patients who were found to be PCR-negative in their respiratory secretions. The authors speculate that this might suggest that such patients may continue to transmit SARS-CoV-2, but this also requires further study,” said Hotez, who was not involved in the study.
______
______
Biochemical Monitoring of COVID-19 Patients:
The essential role of clinical laboratories in this pandemic extends beyond etiological diagnosis of COVID-19. Biochemical monitoring of COVID-19 patients through in vitro diagnostic (IVD) testing is critical for assessing disease severity and progression as well as monitoring therapeutic intervention. Several common in vitro diagnostic tests have been implicated in unfavourable COVID-19 progression, potentially providing important prognostic information. A recommended test list based on current literature is included below along with the major laboratory abnormalities associated with adult COVID-19 patients and their potential clinical indications. In addition to more common laboratory tests, new evidence suggests that patients with severe COVID-19 could be at risk for cytokine storm syndrome. Cytokine tests, particularly IL-6, should be used where possible to assess severe patients suspected of hyperinflammation.
Recommended Test List:
|
Laboratory Test |
Main laboratory abnormalities observed in adult patients with unfavourable COVID-19 progression |
Potential clinical and biological significance |
|
Complete blood count |
Increased white blood cell Increase neutrophil count Decreased lymphocyte count Decreased platelet count |
Bacterial (super)infection Bacterial (super)infection Decreased immunological response to the virus Consumption (disseminated) coagulopathy |
|
Albumin |
Decreased |
Impairment of liver function |
|
Lactate Dehydrogenase |
Increased |
Pulmonary injury and/or widespread organ damage |
|
Alanine Aminotransferase |
Increased |
Liver injury and/or widespread organ damage |
|
Aspartate aminotransferase |
Increased |
Liver injury and/or widespread organ damage |
|
Total bilirubin |
Increased |
Liver injury |
|
Creatinine |
Increased |
Kidney injury |
|
Cardiac troponin |
Increased |
Cardiac injury |
|
D-Dimer |
Increased |
Activation of blood coagulation and/or disseminated coagulopathy |
|
Prothrombin Time |
Increased |
Activation of blood coagulation and/or disseminated coagulopathy |
|
Procalcitonin |
Increased |
Bacterial (super)infection |
|
C-reactive protein |
Increased |
Severe viral infection/viremia/viral sepsis |
|
Ferritin |
Increased |
Severe inflammation |
|
Cytokines (IL-6) |
Increased |
Cytokine storm syndrome |
____
In laboratory examination results, most patients had normal or decreased white blood cell counts, and lymphocytopenia. But in the severe patients, the neutrophil count, D-dimer, blood urea, and creatinine levels were higher significantly, and the lymphocyte counts continued to decrease. Additionally, inflammatory factors interleukin (IL)-6, IL-10, tumor necrosis factor-α (TNF-α) increase, indicating the immune status of patients. The data showed that ICU patients had higher plasma levels of IL-2, IL-7, IL-10, granulocyte colony-stimulating factor (GCSF), 10 kD interferongamma-induced protein (IP-10), monocyte chemoattractant protein-1 (MCP-1), macrophage inflammatory protein 1-α (MIP-1α), and TNF-α.
Basically, if you have a bilateral pneumonia with normal to low WBC, lymphopenia, normal procalcitonin, elevated CRP and ferritin- you have covid-19 and do not need a nasal swab to tell you that. A ratio of absolute neutrophil count to absolute lymphocyte count greater than 3.5 may be the highest predictor of poor outcome. An elevated Interleukin-6 (IL6) is an indicator of their cytokine storm. If this is elevated watch these patients closely with both eyes. Other factors that appear to be predictive of poor outcomes are thrombocytopenia and LFTs 5x upper limit of normal.
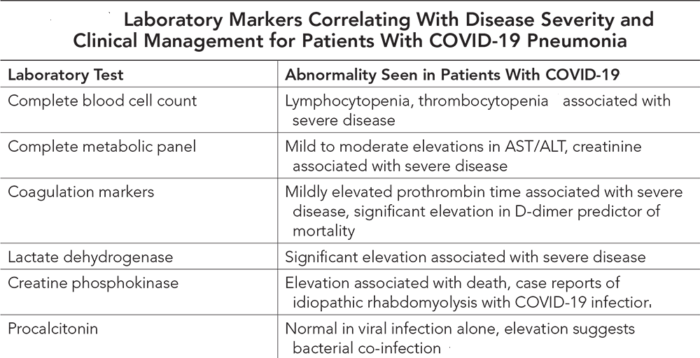
_____
_____
Medical imaging:
Radiographic features:
The primary findings of COVID-19 on chest radiograph and CT are those of atypical pneumonia or organizing pneumonia. Imaging has limited sensitivity for COVID-19, as up to 18% demonstrate normal chest radiographs or CT when mild or early in the disease course, but this decreases to 3% in severe disease. Bilateral and/or multilobar involvement is common.
Plain chest radiograph:
Although less sensitive than chest CT, chest radiography is typically the first-line imaging modality used for patients with suspected COVID-19. For ease of decontamination, use of portable radiography units is preferred. Chest radiographs may be normal in early or mild disease. Of patients with COVID-19 requiring hospitalization, 69% had an abnormal chest radiograph at the initial time of admission, and 80% had radiographic abnormalities sometime during hospitalization. Findings are most extensive about 10-12 days after symptom onset. The most frequent findings are airspace opacities, whether described as consolidation or, less commonly, GGO. The distribution is most often bilateral, peripheral, and lower zone predominant. In contrast to parenchymal abnormalities, pleural effusion is rare (3%).
Chest CT:
The primary findings on CT in adults have been reported:
- ground-glass opacities (GGO): bilateral, subpleural, peripheral
- crazy paving appearance (GGOs and inter-/intra-lobular septal thickening)
- air space consolidation
- bronchovascular thickening in the lesion
- traction bronchiectasis
The ground-glass and/or consolidative opacities are usually bilateral, peripheral, and basal in distribution. A retrospective study of 112 patients found 54% of asymptomatic patients had pneumonic changes on CT. Some papers suggest that CT has a sensitivity that could justify its use in the early imaging in the acute setting in select cases. Yet its use as a primary screening tool is currently discouraged, not least because these studies tended to suffer from selection bias.
In a recent investigation, these chest CT findings had the highest discriminatory value (p<0.001):
- peripheral distribution
- ground-glass opacity
- bronchovascular thickening (in lesions)
Atypical CT findings:
These findings only seen in a small minority of patients should raise concern for superadded bacterial pneumonia or other diagnoses:
- mediastinal lymphadenopathy
- pleural effusions: may occur as a complication of COVID-19
- multiple tiny pulmonary nodules (unlike many other types of viral pneumonia)
- tree-in-bud
- pneumothorax
- cavitation
Temporal CT changes:
Four stages on CT have been described:
- early/initial stage (0-4 days): normal CT or GGO only up to half of patients have normal CT scans within two days of symptom onset
- progressive stage (5-8 days): increased GGO and crazy paving appearance
- peak stage (9-13 days): consolidation
- absorption stage (>14 days): with an improvement in the disease course, “fibrous stripes” appear and the abnormalities resolve at one month and beyond
Pediatric CT:
In a small study of five children that had been admitted to hospital with positive COVID-19 RT-PCR tests and who had CT chest performed, only three children had abnormalities. The main abnormality was bilateral patchy ground-glass opacities, similar to the appearances in adults, but less florid, and in all three cases the opacities resolved as they clinically recovered. On 18 March 2020, the details of a much larger cohort of 171 children with confirmed COVID-19, and evaluated in a hospital setting was published as a letter in the New England Journal of Medicine. Ground-glass opacities were seen in one-third of the total, whereas almost 16% of children had no imaging features of pneumonia.
Ultrasound:
Initial work on patients in China suggests that lung ultrasound may be useful in the evaluation of critically ill COVID-19 patients. The following patterns have been observed, tending to have a bilateral and posterobasal predominance:
- multiple B-lines
-ranging from focal to diffuse with spared areas
-representing thickened subpleural interlobular septa
- irregular, thickened pleural line with scattered discontinuities
- subpleural consolidations
-can be associated with a discrete, localized pleural effusion
-relatively avascular with color flow Doppler interrogation
-pneumonic consolidation typically associated with preservation of flow or hyperemia
- alveolar consolidation
-tissue-like appearance with dynamic and static air bronchograms
-associated with severe, progressive disease
- restitution of aeration during recovery
-reappearance of bilateral A-lines
Nuclear medicine:
PET-CT:
An initial small case series published on 22 February 2020 demonstrated that FDG uptake is increased in ground-glass opacities in those with presumed COVID-19. A commentary in the same issue of the journal as this paper suggested that those with higher standardized uptake value (SUVs) in lung lesions take longer to heal. A further single case detailed in a letter to Radiology corroborated the FDG avidity of COVID lung lesions.
_
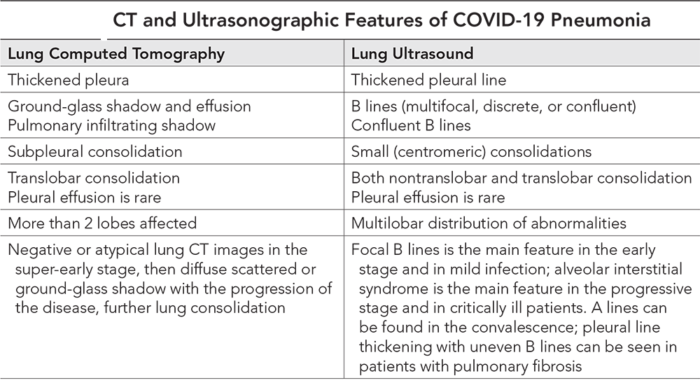
_
Radiology report:
The Radiological Society of North America (RSNA) has released a consensus statement endorsed by the Society of Thoracic Radiology and the American College of Radiology (ACR) that classifies the CT appearance of COVID-19 into four categories for standardized reporting language:
- typical appearance
-peripheral, bilateral, GGO +/- consolidation or visible intralobular lines (“crazy paving” pattern)
-multifocal GGO of rounded morphology +/- consolidation or visible intralobular lines (“crazy paving” pattern)
-reverse halo sign or other findings of organizing pneumonia
- indeterminate appearance
absence of typical CT findings and the presence of
-multifocal, diffuse, perihilar, or unilateral GGO +/- consolidation lacking a specific distribution and are non-rounded or non-peripheral
-few very small GGO with a non-rounded and non-peripheral distribution
- atypical appearance
absence of typical or indeterminate features and the presence of
-isolated lobar or segmental consolidation without GGO
-discrete small nodules (e.g. centrilobular, tree-in-bud)
-lung cavitation
-smoother interlobular septal thickening with pleural effusion
- negative for pneumonia: no CT features to suggest pneumonia, in particular, absent GGO and consolidation
_____
Correlation of Chest CT and RT-PCR Testing in Coronavirus Disease 2019 (COVID-19) in China: A Report of 1014 Cases:
Key Points:
- The positive rates of RT-PCR assay and chest CT imaging in this cohort were 59% (601/1014), and 88% (888/1014) for the diagnosis of suspected patients with COVID-19, respectively.
- With RT-PCR as a reference, the sensitivity of chest CT imaging for COVID-19 was 97% (580/601). In patients with negative RT-PCR results but positive chest CT scans (n=308 patients), 48% (147/308) of patients were re-considered as highly likely cases, with 33% (103/308) as probable cases by a comprehensive evaluation.
- With analysis of serial RT-PCR assays and CT scans, 60% to 93% of patients had initial positive chest CT consistent with COVID-19 before the initial positive RT-PCR results. 42% of patients showed improvement of follow-up chest CT scans before the RT-PCR results turning negative.
Conclusion: Chest CT has a high sensitivity for diagnosis of COVID-19. Chest CT may be considered as a primary tool for the current COVID-19 detection in epidemic areas.
______
______
Risk factors for covid-19:
_
Risk factors for severe illness or poor outcome:
- general
-old age
-people in a long-term care facility or nursing home
-male gender
- comorbidities
-cardiovascular disease
-diabetes mellitus
-hypertension
-chronic respiratory disease, e.g. COPD
-cancer
-immunosuppression
- patient condition and laboratory values at hospital admission
-high sequential organ failure assessment (SOFA) score on admission
-D-dimer levels greater than 1µg/mL on hospital admission
-elevated levels of IL-6, troponin I, lactate dehydrogenase
-lymphopenia
____
An interpretable mortality prediction model for COVID-19 patients, a May 2020 study:
The sudden increase in COVID-19 cases is putting high pressure on healthcare services worldwide. At this stage, fast, accurate and early clinical assessment of the disease severity is vital. To support decision making and logistical planning in healthcare systems, this study leverages a database of blood samples from 485 infected patients in the region of Wuhan, China, to identify crucial predictive biomarkers of disease mortality. For this purpose, machine learning tools selected three biomarkers that predict the mortality of individual patients more than 10 days in advance with more than 90% accuracy: lactic dehydrogenase (LDH), lymphocyte and high-sensitivity C-reactive protein (hs-CRP). In particular, relatively high levels of LDH alone seem to play a crucial role in distinguishing the vast majority of cases that require immediate medical attention. This finding is consistent with current medical knowledge that high LDH levels are associated with tissue breakdown occurring in various diseases, including pulmonary disorders such as pneumonia. Overall, this Article suggests a simple and operable decision rule to quickly predict patients at the highest risk, allowing them to be prioritized and potentially reducing the mortality rate.
_____
Age is a risk factor for severe disease and death:
Scientists may not yet understand the genetics, and exposure factors that lead someone to severe illness, but they’re not completely in the dark when it comes to risk factors. We know Covid-19 is an illness that disproportionately impacts some groups more than others. Namely, older people are most clearly at risk. Data from the initial outbreak in China and then Italy show that infected people under the age of 60 are at low – but not no – risk of dying from COVID-19. Curiously, young children do not appear to be at increased risk of serious COVID-19 complications, in contrast to what happens with other viruses, like the seasonal flu. However, the statistics get grimmer as the patients get older. Whereas people in their 60s have a 0.4 percent chance of dying, people in their 70s have a 1.3 percent chance of dying, and people over 80 have a 3.6 percent chance of dying. While this may not sound like a high chance of death, during the current outbreak in Italy, 83 percent of those who succumbed to COVID-19 infection were over the age of 60.
The journal Lancet Infectious Diseases published estimates of the death rate of Covid-19. The paper found that globally, the case fatality rate for those under age 60 was 1.4 percent. For those over age 60, the fatality rate jumps to 4.5 percent. The older the population, the higher the fatality rate. For those 80 and over, Covid-19 appears to have a 13.4 percent fatality rate.
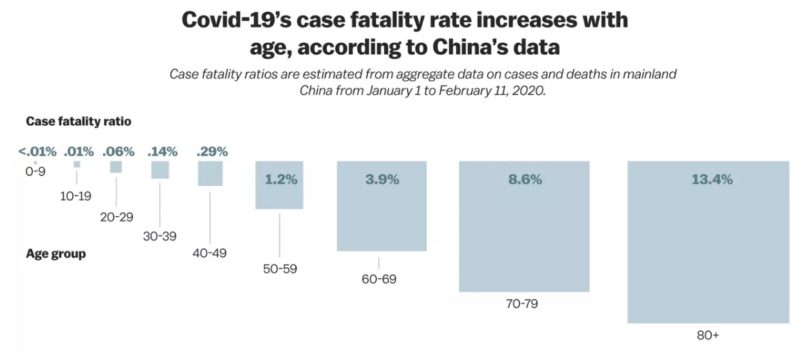
In the US, the CDC reports, “overall, 31% of cases, 45% of hospitalizations, 53% of ICU admissions, and 80% of deaths associated with COVID-19” are among adults older than 65. “With the highest percentage of severe outcomes among persons aged ≥85 years.” This CDC data is compiled from February 12 to March 16, when there were just 4,226 confirmed cases in the United States. One recent analysis of Chinese data estimated the chance of death in confirmed COVID-19 cases at more than 13% for patients 80 and older, compared to about 0.15% for patients in their 30s, and virtually 0% for patients under 20.
Why are older people more at risk?
There’s no one reason. It’s believed immune function declines with age, and older people have more of the underlying conditions that also appear to be risk factors for severe Covid-19.
- Monocytes from older individuals produce less interferon in response to viral infection. They have a harder time killing infected cells and signaling the adaptive immune response to get going.
- Low-grade chronic inflammation in individuals that commonly occurs during aging can also dull the ability of the innate and adaptive immune responses to react to pathogens.
- As you age, the reduced “attention span” of your innate and adaptive immune responses make it harder for the body to respond to viral infection, giving the virus the upper hand. Viruses can take advantage of your immune system’s slow start and quickly overwhelm you, resulting in serious disease and death.
- Underlying conditions like diabetes, hypertension and heart disease appear to be risk factors and these are more common with elderly.
Severe COVID-19 is driven not just by viral damage to cells but by a reactive “storm” of inflammation that harms the lungs and other organs. There may be changes in different parts of the immune system from aging that make the aged more vulnerable to this storm than younger patients, even if they are healthy and have no underlying medical conditions.
_____
Men vs. women:
Men and women appear to get COVID-19 at roughly equal rates, but in most countries, men are much more likely to die of it. Italy was the worst nationwide outbreak after China, and recorded an even more dramatic gender difference. The average age of those who have died from COVID-19 in Italy is 80.3 years old, and only 25.8% are women. There is no shortage of hypotheses for this difference. One is that there are sex differences in the immune response – studies of influenza, for example, have found that older men tend to have worse outcomes than older women. Men also are more likely to drink alcohol, which weakens the immune system and increases susceptibility to pneumonia. Men are much more likely to smoke tobacco, which weakens immunity and overall lung function, primes the lungs and other vital organs for greater inflammation, and leads to greater susceptibility to respiratory infections and pneumonia. Chinese clinicians treating COVID-19 cases early this year found that a history of cigarette smoking was a very strong risk factor in predicting worse disease outcomes.
______
Underlying medical conditions:
Patients who develop serious or fatal COVID-19 are disproportionately likely to have at least one major underlying health condition, such as diabetes, hypertension, obesity, cardiovascular disease, asthma, kidney disease or chronic obstructive pulmonary disorder.
In some cases, the possible explanations for these links are obvious. Diabetes and obesity are associated with a weaker resistance to infections; a letter from Weill Cornell Medicine physicians published on April 17 in the New England Journal of Medicine suggested that obesity, particularly in men, was associated with treatment requiring mechanical ventilation. Asthma and chronic obstructive pulmonary disorder involve reduced lung function, and a greater susceptibility to lung inflammation; moreover, patients with these disorders often use corticosteroid immune-suppressing drugs, which reduce immunity to respiratory infections. In general, any serious underlying medical condition can make a vital organ less able to withstand the biological stresses caused by an infection and resulting inflammation.
Having an unusually weakened immune system, for example due to cancer treatments, organ transplants, or other conditions requiring patients to take immune-suppressing drugs, is another factor that may greatly increase the susceptibility to serious COVID-19 infection – and make people more contagious during infection. Doctors have been advising those with suppressed immune systems to be extra careful to avoid potential exposure to the virus, for example by staying home, and washing hands frequently.
- Association of Comorbidities with COVID-19 Outcomes, March 2020 study:
Risk for unfavorable outcome varies with type and increases with number of comorbidities.
Reported proportions with comorbidities included 17% hypertension, 8% diabetes, 4% cardiovascular disease, 2% cerebrovascular disease, 2% chronic obstructive pulmonary disease (COPD), 1% chronic kidney disease, and 1% malignancy. At least one comorbidity was significantly more common in severe than in nonsevere cases (33% vs. 10%). Patients with ≥1 comorbidity were older (61 vs. 45 years), and more often had shortness of breath (41% vs. 18%), nausea or vomiting (10% vs. 4%), and an abnormal chest x-ray (29% vs. 15%), whereas abnormal CT scans were similarly frequent (71%).
- Meta-Analyses Outcomes:
Odds ratio (OR) of 1 means neutral — wherein the occurrence of an event is neither increased nor decreased. OR >1 means an increased occurrence of an event. OR <1 means a decreased occurrence of an event. COVID-19 patients with cerebrovascular diseases (OR: 3.89), cardiovascular diseases (OR: 2.93), hypertension (OR: 2.29), diabetes (OR: 2.47), and COPD (OR: 5.97) had an increased risk of disease exacerbation/progression, the researchers reported. The meta-analysis identified hypertension, diabetes, COPD, cardiovascular disease, and cerebrovascular disease as significant risk factors for COVID-19 patients. The knowledge of these factors can better define those COVID-19 patients at higher risk, and thus allow a more targeted and specific approach to prevent those deaths.
_____
Genes and susceptibility to COVID-19:
Individual differences in genetic makeup may explain our susceptibility to the new coronavirus and the severity of the disease it causes. Since the start of the COVID-19 pandemic several months ago, scientists have been puzzling over the different ways the disease manifests itself. They range from cases with no symptoms at all to severe ones that involve acute respiratory distress syndrome, which can be fatal. What accounts for this variability? Might the answer lie in our genes?
- Coronaviruses have raised such questions for more than 15 years. In researching the 2003 outbreak of severe acute respiratory syndrome (SARS), Ralph Baric and his colleagues at the University of North Carolina at Chapel Hill identified a gene that, when silenced by a mutation, makes mice highly susceptible to SARS-CoV, the coronavirus that causes the disease. Called TICAM2, the gene codes for a protein that helps activate a family of receptors, called toll-like receptors (TLRs), that are involved in innate immunity, the first line of defense against pathogens. Attention has now shifted to SARS-CoV-2, the new coronavirus that causes COVID-19. And TLRs have once again drawn researchers’ interest—this time to help explain the excess number of men who suffer from severe infections. Men made up 73 percent of severe cases of COVID-19 in intensive care in France, according to a national survey published April 23. Behavioral and hormonal differences may be partially responsible. But genes may also factor into the mix. Unlike men, women have two X chromosomes and so carry double the copies of the gene TLR7, a key detector of viral activity that helps boost immunity.
- The genetics of blood groups may offer some insight into whether you are liable to be infected with the virus. In late March Peng George Wang of the Southern University of Science and Technology in China and his colleagues released the results of a preprint study—not yet peer-reviewed—that compared the distribution of blood types among 2,173 COVID-19 patients in three hospitals in the Chinese cities of Wuhan and Shenzhen with that of uninfected people in the same areas. Blood type A appears to be associated with a higher risk of contracting the virus, whereas type O offers the most protection for reasons that have yet to be determined. In the ABO blood group system, type O blood is the richest in antibodies—possessing both anti-A and anti-B—whereas type AB blood does not have either of them. In 2008 Jacques Le Pendu of the University of Nantes in France and his colleagues investigated an in vitro model of SARS-CoV. The researchers showed that the binding of the virus’s protein S to a cell’s ACE2 (angiotensin-converting enzyme 2) receptor, which is necessary for infection to take place, is inhibited by the anti-A antibody, though data on the anti-B antibody are still lacking.
- A close relative of ACE2 in blood pressure control is angiotensin-converting enzyme 1 (ACE1). The ACE1 D gene, one of several genetic variants of the enzyme, is associated with low levels of expression of the ACE2 gene. As a result, cells contain fewer of the receptors that allow infection by SARS-CoV. The frequency of ACE1 D differs from one country to another, particularly in Europe, which raises the question of whether the geographical distribution of this variant correlates with COVID-19 prevalence. Might it reflect the epidemiology of the disease on a global scale? Marc De Buyzere and his colleagues at Ghent University in Belgium found that to be the case. Using data from 25 countries (spanning a region from Portugal to Estonia and from Turkey to Finland), the researchers showed that 38 percent of the variability in disease prevalence is explained by the frequency of the ACE1 D gene. A similar correlation turned up for mortality statistics. The researchers also noted that the ACE1 D gene is less frequent in two Asian countries severely hit by SARS-CoV-2.
- Researchers from MedGenome Inc and SciGenom Research Foundation (SGRF) jointly anlaysed the DNA sequence and variation data from over 300,000 individuals belonging to 400 different populations to predict susceptibility to the Covid-19 disease caused by the SARS-CoV-2 virus. Nearly 1 per cent of the samples are from people of Indian origin. The team led by Sekhar Seshagiri, President of Chennai-based SGRF India, identified variations in the angiotensin-converting enzyme 2 (ACE-2) protein gene that are predicted to make individuals more susceptible to the virus. Their findings are published online on the Biorxiv.org portal. However, the study is yet to be peer-reviewed. The study found that individuals carrying certain variants of the ACE2 gene would be protected against the Covid-19 infection. The converse is also true; in this data set, they found ACE2 variants that will render individuals more susceptible to the virus.
- A further genetic component of susceptibility to the new coronavirus may lie in the genes that encode human leukocyte antigens (HLAs), a set of proteins that keep the human immune system from attacking the body itself. These proteins make up the major histocompatibility complex (MHC), which marks “self” and distinguishes it from “nonself.” Reid Thompson and his colleagues at the Oregon Health & Science University discovered a link between specific HLA genes and the severity of COVID-19. Carriers of a variant called HLA-B*46:01 appear to be particularly susceptible to SARS-CoV-2, as was previously shown to be the case with SARS-CoV. In contrast, the HLA-B*15:03 variant may provide some protection. According to the researchers, identification of a person’s HLA genes, which can be done quickly and inexpensively, may help to better predict the severity of disease—and even to identify those who would benefit most from vaccination.
______
Different countries and different susceptibility to covid-19:
-The coronavirus has killed so many people in Iran that the country has resorted to mass burials, but in neighboring Iraq, the body count is fewer than 100.
-The Dominican Republic has reported nearly 7,600 cases of the virus. Just across the border, Haiti has recorded about 85.
-In Indonesia, thousands are believed to have died of the coronavirus. In nearby Malaysia, a strict lockdown has kept fatalities to about 100.
The coronavirus has touched almost every country on earth, but its impact has seemed capricious. Global metropolises like New York, Paris and London have been devastated, while teeming cities like Bangkok, Baghdad, New Delhi and Lagos have, so far, comparatively less affected.
The question of why the virus has overwhelmed some places and left others relatively untouched is a puzzle that has spawned numerous theories and speculations but no definitive answers. That knowledge could have profound implications for how countries respond to the virus, for determining who is at risk and for knowing when it’s safe to go out again.
Many developing nations with hot climates and young populations have escaped the worst, suggesting that temperature and demographics could be factors. But countries like Peru, Indonesia and Brazil, tropical countries in the throes of growing epidemics, throw cold water on that idea. Draconian social-distancing and early lockdown measures have clearly been effective, but Myanmar and Cambodia did neither and have reported few cases. One theory that is unproven but impossible to refute: maybe the virus just hasn’t gotten to those countries yet. Russia and Turkey appeared to be fine until, suddenly, they were not. Time may still prove the greatest equalizer: The Spanish flu that broke out in the United States in 1918 seemed to die down during the summer only to come roaring back with a deadlier strain in the fall, and a third wave the following year. It eventually reached far-flung places like islands in Alaska and the South Pacific and infected a third of the world’s population.
Doctors who study infectious diseases around the world say they do not have enough data yet to get a full epidemiological picture, and that gaps in information in many countries make it dangerous to draw conclusions. Testing is woeful in many places, leading to vast underestimates of the virus’s progress, and deaths are almost certainly undercounted.
Still, the broad patterns are clear. Even in places with abysmal record-keeping and broken health systems, mass burials or hospitals turning away sick people by the thousands would be hard to miss, and a number of places are just not seeing them — at least not yet.
Interviews with more than two dozen infectious disease experts, health officials, epidemiologists and academics around the globe suggest four main factors that could help explain where the virus thrives and where it doesn’t: demographics, culture, environment and the speed of government responses. Each possible explanation comes with considerable caveats and confounding counter-evidence. If an aging population is the most vulnerable, for instance, Japan should be at the top of the list. It is far from it. Nonetheless these are the factors that experts find the most persuasive.
- The Power of Youth
Many countries that have escaped mass epidemics have relatively younger populations. Young people are more likely to contract mild or asymptomatic cases that are less transmissible to others, said Robert Bollinger, a professor of infectious diseases at the Johns Hopkins School of Medicine. And they are less likely to have certain health problems that can make Covid-19, the disease caused by the coronavirus, particularly deadly, according to the World Health Organization. In Africa — with about 158,030 cases; 4,505 deaths; a tiny fraction of its 1.3 billion people — is the world’s youngest continent, with more than 60 percent of its population under age 25. Despite over 100 000 confirmed cases and infections in every country, the passage of COVID-19 through the African continent remains somewhat enigmatic. High numbers of deaths were expected in the region due to fragile health systems, lack of access to preventive measures, barriers to testing, and potentially vulnerable populations. But, according to WHO, Africa is the least affected region globally, with 1·5% of the world’s reported COVID-19 cases and 0·1% of the world’s deaths. Although comparisons are inaccurate, mortality rates have been lower compared with outbreaks of similar size elsewhere. Many hypotheses have been suggested for this paradox, including sensitivity of the virus to ambient temperature, Africa’s comparatively young population, lower rates of obesity, and familiarity with infectious disease outbreaks. Low levels of testing might be artificially lowering apparent infection rates.
In Thailand and Najaf, Iraq, local health officials found that the 20-to-29 age group had the highest rate of infection but often showed few symptoms. By contrast, the national median age in Italy, one of the hardest hit countries, is more than 45. The average age of those who died of Covid-19 there was around 80. Younger people tend to have stronger immune systems, which can result in milder symptoms, said Josip Car, an expert in population and global health at Nanyang Technological University in Singapore. In Singapore and Saudi Arabia, for instance, most of the infections are among foreign migrant workers, many of them living in cramped dormitories. However, many of those workers are young and fit, and have not required hospitalization. Along with youth, relative good health can lessen the impact of the virus among those who are infected, while certain pre-existing conditions — notably hypertension, diabetes and obesity — can worsen the severity, researchers in the United States say. There are notable exceptions to the demographic theory. Japan, with the world’s oldest average population, has recorded fewer than 800 deaths, although its caseload has risen with increased testing.
- Cultural Distance
Cultural factors, like the social distancing that is built into certain societies, may give some countries more protection, epidemiologists said. In Thailand and India, where virus numbers are relatively low, people greet each other at a distance, with palms joined together as in prayer. In Japan and South Korea, people bow, and long before the coronavirus arrived, they tended to wear face masks when feeling unwell. In much of the developing world, the custom of caring for the elderly at home leads to fewer nursing homes, which have been tinder for tragic outbreaks in the West. However, there are notable exceptions to the cultural distancing theory. In many parts of the Middle East, such as Iraq and the Persian Gulf countries, men often embrace or shake hands on meeting, yet most are not getting sick.
What might be called “national distancing” has also proven advantageous. Countries that are relatively isolated have reaped health benefits from their seclusion. Far-flung nations, such as some in the South Pacific and parts of sub-Saharan Africa, have not been as inundated with visitors bringing the virus with them. Health experts in Africa cite limited travel from abroad as perhaps the main reason for the continent’s relatively low infection rate. Countries that are less accessible for political reasons, like Venezuela, or because of conflict, like Syria and Libya, have also been somewhat shielded by the lack of travelers, as have countries like Lebanon and Iraq, which have endured widespread protests in recent months. The lack of public transportation in developing countries may have also reduced the spread of the virus there.
- Heat and Light
The geography of the outbreak — which spread rapidly during the winter in temperate zone countries like Italy and the United States and was virtually unseen in warmer countries such as Chad or Guyana — seemed to suggest that the virus did not take well to heat. Other coronaviruses, such as ones that cause the common cold, are less contagious in warmer, moist climate.
But some researchers say the idea that hot weather alone can repel the virus is wishful thinking. Some of the worst outbreaks in the developing world have been in places like the Amazonas region of Brazil, as tropical a place as any. “The best guess is that summer conditions will help but are unlikely by themselves to lead to significant slowing of growth or to a decline in cases,” said Marc Lipsitch, the director of the Center for Communicable Disease Dynamics at Harvard University. The virus that causes Covid-19 appears to be so contagious as to mitigate any beneficial effect of heat and humidity, said Dr. Raul Rabadan, a computational biologist at Columbia University.
But other aspects of warm climates, like people spending more time outside, could help. The ultraviolet rays of direct sunlight inhibit this coronavirus, according to a study by ecological modelers at the University of Connecticut. So surfaces in sunny places may be less likely to remain contaminated, but transmission usually occurs through contact with an infected person, not by touching a surface.
- Early and Strict Lockdowns
Countries that locked down early, like Vietnam and Greece, have been able to avoid out-of-control contagions, evidence of the power of strict social distancing and quarantines to contain the virus. In Africa, countries with bitter experience with killers like HIV, drug-resistant tuberculosis and Ebola knew the drill and reacted quickly. Airport staff from Sierra Leone to Uganda were taking temperatures (since found to be a less effective measure) and contact details and wearing masks long before their counterparts in the United States and Europe took such precautions. Senegal and Rwanda closed their borders and announced curfews when they still had very few cases. Health ministries began contact tracing early.
Lockdowns, with bans on religious conclaves and spectator sporting events, clearly work, the World Health Organization says. More than a month after closing national borders, schools and most businesses, countries from Thailand to Jordan have seen new infections drop. In the Middle East, the widespread shuttering of mosques, shrines and churches happened relatively early and probably helped stem the spread in many countries. A notable exception was Iran, which did not close some of its largest shrines until March 18, a full month after it registered its first case in the pilgrimage city of Qum. The epidemic spread quickly from there, killing thousands in the country and spreading the virus across borders as pilgrims returned home.
As effective as lockdowns are, in countries lacking a strong social safety net and those where most people work in the informal economy, orders closing businesses and requiring people to shelter in place will be difficult to maintain for long. When people are forced to choose between social distancing and feeding their families, they are choosing the latter.
Counter-intuitively, some countries where authorities reacted late and with spotty enforcement of lockdowns appear to have been spared. Cambodia and Laos both had brief spates of infections when few social distancing measures were in place but neither has recorded a new case for weeks. Lebanon, whose Muslim and Christian citizens often go on pilgrimages respectively to Iran and Italy, places rife with the virus, should have had high numbers of infections. It has not.
- Sheer luck
Finally, most experts agree that there may be no single reason for some countries to be hit and others missed. The answer is likely to be some combination of the above factors, as well as one other mentioned by researchers: sheer luck. Countries with the same culture and climate could have vastly different outcomes if one infected person attends a crowded social occasion, turning it into what researchers call a super-spreader event. That happened when a passenger infected 634 people on the Diamond Princess cruise ship off the coast of Japan, when an infected guest attended a large funeral in Albany, Ga., and when a 61-year-old woman went to church in Daegu, South Korea, spreading the disease to hundreds of congregants and then to thousands of other Koreans. Because an infected person may not experience symptoms for a week or more, if at all, the disease spreads under the radar, exponentially and seemingly at random. Had the woman in Daegu stayed home that Sunday in February, the outbreak in South Korea might have been less than half of what it is.
Some countries that should have been inundated are not, leaving researchers scratching their heads.
Thailand reported the first confirmed case of coronavirus outside of China in mid-January, from a traveler from Wuhan, the Chinese city where the pandemic is thought to have begun. In those critical weeks, Thailand continued to welcome an influx of Chinese visitors. For some reason, these tourists did not set off exponential local transmission.
And when countries do all the wrong things and still end up seemingly not as battered by the virus as one would expect, you have to find the explanation. “In Indonesia, we have a health minister who believes you can pray away Covid, and we have too little testing,” said Dr. Pandu Riono, an infectious disease specialist at the University of Indonesia. “But we are lucky we have so many islands in our country that limit travel and maybe infection.” “There’s nothing else we’re doing right,” he added.
______
______
Treatment:
We have to differentiate the population into five groups and treat accordingly. We first need to know who is infected; second, who is presumed to be infected (i.e., persons with signs and symptoms consistent with infection who initially test negative); third, who has been exposed; fourth, who is not known to have been exposed or infected; and fifth, who has recovered from infection and is adequately immune. We should act on the basis of symptoms, examinations, tests (currently, polymerase-chain-reaction assays to detect viral RNA), and exposures to identify those who belong in each of the first four groups. Hospitalize those with severe disease or at high risk. Establish infirmaries by utilizing empty convention centers, for example, to care for those with mild or moderate disease and at low risk; an isolation infirmary for all patients will decrease transmission to family members. Convert now-empty hotels into quarantine centers to house those who have been exposed, and separate them from the general population for 2 weeks. Being able to identify the fifth group — those who were previously infected, have recovered, and are adequately immune — requires development, validation, and deployment of antibody-based tests. This would be a game-changer in restarting parts of the economy more quickly and safely.
_
No specific treatment or vaccine exists for COVID-19 (April 2020). Therefore resources have been concentrated on public health measures to prevent further interhuman transmission of the virus. This has required a multipronged approach and for individuals includes meticulous personal hygiene, the avoidance of large crowds/crowded environments and where necessary, self-isolation. In healthcare facilities, concerted efforts are required to effect rapid diagnosis, quarantine infected cases and provide effective supportive therapies. This will encompass empirical treatments with antibiotics, antivirals, and supportive measures. Mechanical ventilation and extracorporeal membrane oxygenation (ECMO) have also been used where clinically necessary.
_
Current therapies:
Given the lack of effective antiviral therapy against COVID-19, current treatments mainly focused on symptomatic and respiratory support according to the Diagnosis and Treatment of Pneumonia Caused by COVID-19 (updated to version 6) issued by National Health Commission of the People’s Republic of China. Nearly all patients accepted oxygen therapy, and WHO recommended extracorporeal membrane oxygenation (ECMO) to patients with refractory hypoxemia. Rescue treatment with convalescent plasma and immunoglobulin G are delivered to some critical cases according to their conditions.
Antiviral treatments:
Based on the experience of fighting the epidemic SARS-CoV and MERS-CoV previously, we may learn some lessons for some treatment strategies against coronavirus. Antiviral drugs and systemic corticosteroid treatment commonly used in clinical practice previously, including neuraminidase inhibitors (oseltamivir, peramivir, zanamivir, etc.), ganciclovir, acyclovir, and ribavirin, as well as methylprednisolone for influenza virus, are invalid for COVID-19 and not recommended.
Remdesivir (GS-5734) is a 1′-cyano-substituted adenosine nucleotide analog prodrug and shows broad spectrum antiviral activity against several RNA viruses. Based on the data collected from in vitro cell line and mouse model, remdesivir could interfere with the NSP12 polymerase even in the setting of intact ExoN proofreading activity. Remdesivir has been reported to treat the first US case of COVID-19 successfully. Chloroquine is a repurposed drug with great potential to treat COVID-19. Chloroquine has been used to treat malaria for many years, with a mechanism that is not well understood against some viral infections. Several possible mechanisms are investigated: Chloroquine can inhibit pH-dependent steps of the replication of several viruses, with a potent effect on SARS-CoV infection and spread. Moreover, chloroquine has immunomodulatory effects, suppressing the production/release of TNF-α and IL-6. It also works as a novel class of autophagy inhibitor, which may interfere with viral infection and replication. Several studies have found that chloroquine interfered with the glycosylation of cellular receptors of SARS-CoV and functioned at both entry and at post-entry stages of the COVID-19 infection in Vero E6 cells. A combination of remdesivir and chloroquine was proven to effectively inhibit the recently emerged SARS-CoV-2 in vitro.
Scientists previously confirmed that the protease inhibitors lopinavir and ritonavir, used to treat infection with human immunodeficiency virus (HIV), could improve the outcome of MERS-CoV and SARS-CoV patients. It has reported that β-coronavirus viral loads of a COVID-19 patient in Korea significantly decreased after lopinavir/ritonavir (Kaletra®, AbbVie, North Chicago, IL, USA) treatment. Additionally, clinicians combined Chinese and Western medicine treatment including lopinavir/ritonavir (Kaletra®), arbidol, and Shufeng Jiedu Capsule (SFJDC, a traditional Chinese medicine) and gained significant improvement in pneumonia associated symptoms in Shanghai Public Health Clinical Center, China. Common antiviral drugs are depicted in the Table below.
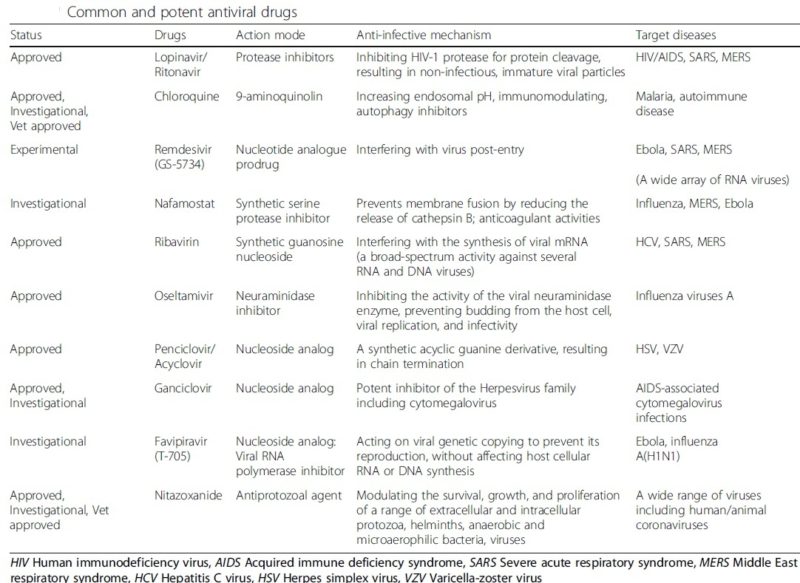
As on 13 march 2020.
_
Recently in Shanghai, doctors isolated the blood plasma from clinically recovered patients of COVID-19 and injected it in the infected patients who showed positive results with rapid recovery. Treatment with convalescent plasma has shown some success in some critically ill patients. Reports are still preliminary and about a small number of patients. In a recent study, it was identified that monoclonal antibody (CR3022) binds with the spike RBD of SARS-CoV-2. This is likely due to the antibody’s epitope not overlapping with the divergent ACE2 receptor-binding motif. CR3022 has the potential to be developed as a therapeutic candidate, alone or in combination with other neutralizing antibodies for the prevention and treatment of COVID-19 infection.
_
NSAIDs:
Emerging expert opinion is that non-steroidal anti-inflammatory drugs (NSAIDs) are relatively contraindicated in those with COVID-19. This is based upon several strands of “evidence”:
- since 2019 the French government National Agency for the Safety of Medicines and Health Products has advised against the routine use of NSAIDs as antipyretic
- previous research has shown that NSAIDs may suppress the immune system
- anecdotal reports from France suggest that young patients on NSAIDs, otherwise previously fit and well, developed more severe COVID-19 symptoms
However, it is important to note that there is currently (March 2020) no published scientific evidence showing that NSAIDs increase the risk of developing COVID-19 or worsen established disease. Also, at least one report shows antiviral activity by indomethacin (an NSAID) against SARS-CoV (cause of SARS).
_
Investigational treatment:
- Bevacizumab: A VEGF inhibitor called bevacizumab (marketed under the brand name Avastin for certain types of cancer) being studied as a treatment for acute lung injury (ALI) and acute respiratory distress syndrome (ARDS) in critically ill patients with COVID-19 pneumonia at the Qilu Hospital of Shandong University in Jinan, China.
- Leronlimab: A CCR5 antagonist called leronlimab has shown promise in calming the ‘cytokine storm’ in a small number of critically ill COVID-19 patients hospitalized in the New York area.
- Ivermectin: An anti-parasitic drug called ivermectin has been shown to be effective against the SARS-CoV-2 virus in an in-vitro laboratory study by researchers at Monash University in Melbourne, Australia. Further clinical trials need to be completed to confirm the effectiveness of the drug in humans with COVID-19.
- Sarilumab: An interleukin-6 (IL-6) receptor antagonist called sarilumab (marketed under the brand name Kevzara for the treatment of rheumatoid arthritis) is being studied as a potential treatment for acute respiratory distress syndrome (ARDS) in patients critically ill from COVID-19.
- EIDD-2801: A team of researchers at UNC-Chapel Hill is hopeful that a broad spectrum oral antiviral called EIDD-2801 could be used as a potential prophylactic or treatment for COVID-19 and other coronaviruses. Ridgeback Biotherapeutics has licensed EIDD-2801 and has received permission from the FDA to begin patient trials.
_
Tocilizumab treatment is effective to reduce the mortality of severe COVID-19:
Tocilizumab is the first marketed IL-6 blocking antibody through targeting IL-6 receptors and has proved its safety and effectiveness in therapy for rheumatoid arthritis. In order to verify whether targeted IL-6, may potentially be the effective and safe way to reduce mortality of COVID-19, 21 patients diagnosed as severe or critical COVID-19 from The First Affiliated Hospital of University of Science and Technology of China and Anhui Fuyang Second People’s Hospital were recruited and given tocilizumab therapy. Patients received standard treatment according to the Diagnosis and Treatment Protocol for COVID-19 (7th edition), including lopinavir, methylprednisolone, other symptom relievers and oxygen therapy. The results of tocilizumab treatment are inspiring. The temperature of all the patients returned to normal very quickly. The respiratory function and all other symptoms improved remarkably. Among these 21 patients, 20 patients have been recovered and discharged within 2 weeks after the tocilizumab therapy. One left patient is recovering and out of ICU care. No adverse drug reactions were reported during the treatment with tocilizumab.
______
Discharge from hospital:
When deciding on criteria for hospital discharge of COVID-19 patients, health authorities should take into account several factors such as the existing capacity of the healthcare system, laboratory diagnostic resources, and the current epidemiological situation.
In the early stages of SARS-CoV-2 spread and with no pressure on healthcare facilities and optimal laboratory testing capacity, COVID-19 patients may be discharged from hospital and moved to home care (or other types of non-hospital care and isolation) based on:
- clinical criteria (e.g. no fever for > 3 days, improved respiratory symptoms, pulmonary imaging showing obvious absorption of inflammation, no hospital care needed for other pathology, clinician assessment)
- laboratory evidence of SARS-CoV-2 clearance in respiratory samples; 2 to 4 negative RT-PCR tests for respiratory tract samples (nasopharynx and throat swabs with sampling interval ≥ 24 hours). Testing at a minimum of 7 days after the first positive RT-PCR test is recommended for patients that clinically improve earlier.
- Serology: appearance of specific IgG when an appropriate serological test is available.
In the context of sustained widespread transmission with increasing pressure on healthcare systems or when healthcare facilities are already overwhelmed and laboratory capacity is restrained, alternative algorithms for hospital discharge of COVID-19 patients are warranted.
The discharge from hospital of mild cases – if clinically appropriate – may be considered, provided that they are placed into home care or another type of community care. After discharge, 14 days of further isolation with regular health monitoring (e.g. follow-up visits, phone calls) can be considered, provided the patient’s home is equipped for patient isolation and the patients takes all necessary precautions (e.g. single room with good ventilation, face-mask wear, reduced close contact with family members, separate meals, good hand sanitation, no outdoor activities) in order to protect family members and the community from infection and further spread of SARS-CoV-2.
Due to increasing evidence of virus shedding through faeces by convalescent patients, particularly children, recommendations for careful personal hygiene precautions after de-isolation are warranted.
An overview of recommendations for the de-isolation of COVID-19 patients from national bodies in countries that have experienced local transmissions of SARS-CoV-2 is presented below.
- Despite of some differences in practice, a consensus exists to combine a) the evidence for viral RNA clearance from the upper respiratory tract with b) the clinical resolution of symptoms.
- At least two upper respiratory tract samples negative for SARS-CoV-2, collected at ≥ 24-hour intervals are recommended to document SARS-CoV-2 clearance.
- For symptomatic patients after the resolution of symptoms, samples should be collected at least seven days after the onset or after > 3 days without fever.
- For asymptomatic SARS-CoV-2-infected persons, the tests to document virus clearance should be taken at a minimum of 14 days after the initial positive test.
- Italy indicates that serology tests to document IgG antibody specific to SARS-CoV-2 will be of value.
_____
_____
Why this novel Coronavirus is so successful?
This family, the coronaviruses, includes just six other members that infect humans. Four of them—OC43, HKU1, NL63, and 229E—have been gently annoying humans for more than a century, causing a third of common colds. The other two—MERS and SARS—both cause far more severe disease. Why was this seventh coronavirus the one to go pandemic?
The structure of the virus provides some clues about its success. In shape, it’s essentially a spiky ball. Those spikes recognize and stick to a protein called ACE2, which is found on the surface of our cells: This is the first step to an infection. The exact contours of SARS-CoV-2’s spikes allow it to stick far more strongly to ACE2 than SARS-classic did, and it’s likely that this is really crucial for person-to-person transmission.
There’s another important feature. Coronavirus spikes consist of two connected halves, and the spike activates when those halves are separated; only then can the virus enter a host cell. In SARS-classic, this separation happens with some difficulty. But in SARS-CoV-2, the bridge that connects the two halves can be easily cut by an enzyme called furin, which is made by human cells and—crucially—is found across many tissues. This is probably important for some of the really unusual things we see in this virus. For example, most respiratory viruses tend to infect either the upper or lower airways. In general, an upper-respiratory infection spreads more easily, but tends to be milder, while a lower-respiratory infection is harder to transmit, but is more severe. SARS-CoV-2 seems to infect both upper and lower airways, perhaps because it can exploit the ubiquitous furin. This double whammy could also conceivably explain why the virus can spread between people before symptoms show up—a trait that has made it so difficult to control. Perhaps it transmits while still confined to the upper airways, before making its way deeper and causing severe symptoms.
Since furin is highly expressed in lungs, an enveloped virus that infects the respiratory tract may successfully exploit this convertase to activate its surface glycoprotein. Before the emergence of SARS-CoV-2, this important feature was not observed in the lineage B of betacoronaviruses. However, it is shared by other CoV (HCoV-OC43, MERS-CoV, MHV-A59) harbouring furin-like cleavage sites in their S-protein, which were shown to be processed by furin experimentally. Strikingly, SARS-CoV-2 S-protein sequence contains 12 additional nucleotides upstream of the single Arg↓ cleavage site 1leading to a predictively solvent-exposed PRRAR↓SV sequence, which corresponds to a canonical furin-like cleavage site. This furin-like cleavage site, is supposed to be cleaved during virus egress for S-protein “priming” and may provide a gain-of-function to SARS-CoV-2 for efficient spreading in the human population compared to other lineage B betacoronaviruses. This possibly illustrates a convergent evolution pathway between unrelated CoVs. Interestingly, if this site is not processed, the S-protein is expected to be cleaved at site 2 during virus endocytosis, as observed for the SARS-CoV.
The new virus certainly seems to be effective at infecting humans, despite its animal origins. The closest wild relative of SARS-CoV-2 is found in bats, which suggests it originated in a bat, then jumped to humans either directly or through another species. (Another coronavirus found in wild pangolins also resembles SARS-CoV-2, but only in the small part of the spike that recognizes ACE2; the two viruses are otherwise dissimilar, and pangolins are unlikely to be the original reservoir of the new virus.) When SARS-classic first made this leap, a brief period of mutation was necessary for it to recognize ACE2 well. But SARS-CoV-2 could do that from day one. “It had already found its best way of being a [human] virus,” says Matthew Frieman of the University of Maryland School of Medicine.
Since the start of the pandemic, the virus hasn’t changed in any obviously important ways. It’s mutating in the way that all viruses do. But of the 100-plus mutations that have been documented, none has risen to dominance, which suggests that none is especially important. The virus has been remarkably stable given how much transmission we’ve seen. That makes sense, because there’s no evolutionary pressure on the virus to transmit better. It’s doing a great job of spreading around the world right now.
Researchers offer a preliminary account of what the new coronavirus does to the people it infects. Once in the body, it likely attacks the ACE2-bearing cells that line our airways. Dying cells slough away, filling the airways with junk and carrying the virus deeper into the body, down toward the lungs. As the infection progresses, the lungs clog with dead cells and fluid, making breathing more difficult. (The virus might also be able to infect ACE2-bearing cells in other organs, including the gut and blood vessels.)
The immune system fights back and attacks the virus; this is what causes inflammation and fever. But in extreme cases, the immune system goes berserk, causing more damage than the actual virus. For example, blood vessels might open up to allow defensive cells to reach the site of an infection; that’s great, but if the vessels become too leaky, the lungs fill even more with fluid. These damaging overreactions are called cytokine storms. They were historically responsible for many deaths during the 1918 flu pandemic, H5N1 bird flu outbreaks, and the 2003 SARS outbreak. And they’re probably behind the most severe cases of COVID-19. During a cytokine storm, the immune system isn’t just going berserk but is also generally off its game, attacking at will without hitting the right targets. When this happens, people become more susceptible to infectious bacteria. The storms can also affect other organs besides the lungs, especially if people already have chronic diseases. This might explain why some COVID-19 patients end up with complications such as heart problems and secondary infections.
_______
_______
Prevention:
The best way to prevent infection is to avoid exposure to the virus.
To prevent infection and to slow transmission of COVID-19, do the following:
- Wash your hands regularly with soap and water, or clean them with alcohol-based hand rub.
- Maintain at least 2-meter distance between you and people coughing or sneezing.
- Cover your mouth and nose when coughing or sneezing.
- Stay home if you feel unwell.
- avoid contact with others who are sick
- avoid touching your mouth, nose, eyes or face
- clean and disinfect surfaces (alcohol or bleach based cleaning solutions work best for coronaviruses)
- if everyone wears a surgical mask outside the home, those who are asymptomatic, presymptomatic and infected will be less likely to spread the infection to others. And if everyone wears a mask, no stigma is attached.
- social distancing
- self-isolation
_
What to do if you come into contact with someone who is sick:
If you have been exposed to someone who has tested positive for COVID-19, or someone who is showing symptoms of COVID-19, it may take up to two weeks for your symptoms to present. To keep yourself and others safe, you should isolate yourself from other people for 14 days.
_
Surveillance:
The outbreak surveillance is the anticipation, early warning, prompt detection and response to unusual increase in the number of cases. Establishing a surveillance system for a new epidemic is believed to be a core intervention in controlling the disease. Surveillance system data provides reliable information for epidemiologists to identify weak chains of transmission and facilitates evidence-based decisions by policymakers both inside and outside the healthcare service. Moreover, updating and sharing interpretations of data with media, especially in earlier phase of an epidemic, will aid community engagement and participation in control activities and prevention of spreading rumors. Highly effective surveillance system ensures timely detection, recording, tracking, updating and sharing information on media for an outbreak with unknown origin and high burden of cases.
In a large number of countries, the initial focus of the surveillance system for CIVID-19 is examination of all suspected cases with symptoms of the disease (mostly fever) and all people with a travel history to China or visiting Chinese travelers or citizens it the previous two weeks. However, this type of screening program mainly relies on fever cases and those with direct flights from China, so it misses pre-symptomatic cases as well as infected travelers who are arriving from regions with high burden of disease via indirect flights, which could be a source of infection in COVID-19-free countries.
In a communicable disease outbreak, essential data are usually collected in parallel from different available information sources in the country including data of weekly outpatient visits to health care centers and hospital referrals with a chief complaint of fever, data of weekly inpatient fever cases and deaths with unknown origin. Furthermore, increase in the number of cases and deaths due to pneumonia may raise an alarm in COVID-19 free areas.
A prerequisite for establishing a surveillance system is to provide basic laboratory facilities, particularly at “point of care”. This system should be constantly monitored and evaluated using sensitive indicators to ensure the quality of case detection, diagnosis and management.
_
Special intervention in community level:
After the rise of an emerging disease, governments have a special responsibility to balance between civil liberties and special measures for protecting susceptible populations. However, three components of scientific, voluntary and civil liberty should be considered as guiding principles for decision-making and operating each special protective measure at the community level. Through their experiences in previous communicable disease epidemics, US public health authorities found that enhanced screening programs, monitoring healthy people and quarantine at the community level were not effective measures against progressive spreading of disease. Therefore, specific regulations and waivers were declared to prevent traveling to mainland china and flights to and from China were temporarily suspended. Passengers and US citizens with a history of traveling to China during the previous month were encouraged to stay home and self-quarantine for up to 14 days. However, these interventions and recommendations were deemed insufficient, so public health experts warned about expanding transmission throughout the country in the coming weeks as a consequence of population movements and large scale spread of the disease all over the world.
Even though children are important sources of influenza virus transmission in the community, initial data analysis on COVID-19 indicated that children were mainly infected from adults rather than the other way around. However, clinical attack rates are low in children and teenagers (0-19), so this age-group may contribute to continuous transmission in the community. Therefore, countries with high prevalence of the disease, such as China, Iran, Italy, South Korea and Japan, closed or postponed the start of school and extended holidays. Other special measures considered for control of the pandemic at community level include: cancelling mass gatherings, religious services, tourism, cultural and sport events, concerts and other events. In the mentioned countries, healthcare authorities issued travel ban to and from affected areas and allowed non-essential personnel and employees to work from home.
_
Special interventions for healthcare providers:
Healthcare authorities are responsible for predicting and supplying the essential protective equipment for general population as well as healthcare providers. By ensuring their availability through effective supply chain management, they gain public trust. They also have to plan for deploying healthcare personnel from less affected areas to epidemic regions. With this method, a large number of medical staff and nurses were voluntarily deployed to Wuhan, China.
According to primary reports from China and Singapore, working with protective equipment for a long time is cumbersome for healthcare providers and they are under tremendous stress due to probability of being infection and transmitting the disease to their families through close contact. The high rates of hospital infection in the recent pandemic emphasizes the importance of regular examination for symptoms among healthcare providers who are in close contact with confirmed patients in order to isolate them in case of positive laboratory test. Supply health workers with PPE and equip hospitals to care for a surge in severely ill patients. Ample supplies of PPE (personal protective equipment) should be standard issue to every health worker who is in the front lines caring for patients and testing for infection. We wouldn’t send soldiers into battle without ballistic vests; health workers on the front lines of this war deserve no less. Regional distribution centers should rapidly deploy ventilators and other needed equipment from the national stockpile to hospitals with the greatest need. Despite everyone’s best efforts, in areas hardest hit, crisis standards of care will need to be put into effect to make ethically sound, unavoidable decisions about the use of available equipment and supplies.
_
PPE’s effects:
A study in The BMJ highlights the efficacy of personal protective equipment (PPE) in limiting transmission of SARS-CoV-2 to healthcare workers. The study included 420 doctors and nurses who went to Wuhan, China, to treat COVID-19 patients for 6-8 weeks. All received protective suits, masks, gloves, goggles, face shields, and gowns and were trained in their proper use. Participants worked, on average, 16 hours per week in ICUs and were exposed to at least one aerosol-generating procedure. None became symptomatic during their time in Wuhan. Upon returning home, all were tested three times for SARS-CoV-2 and also underwent antibody tests. All test results were negative. The researchers write, “Healthcare systems must give priority to the procurement and distribution of personal protective equipment, and provide adequate training to healthcare professionals in its use.”
_______
_______
Exponential growth of Covid-19 SARS-CoV-2:
In any biological system, if you put a living organism into an environment where it can thrive, with unlimited resources and no predators or competitors, it will always grow in the same fashion: exponentially. As long as those conditions are met, everything from wolves to parasitic wasps to yeast cells will grow exponentially, up until one of those assumptions fails to be true. Only at that point will growth become slower, and that holds the key to understanding how to mitigate the present pandemic.
In the case of the coronavirus COVID-19, exponential growth will occur in the disease rate in humans so long as:
- there is at least one infected person in the population pool,
- regular contact between infected and uninfected members of the population occurs,
- and there are large numbers of uninfected potential hosts among the population.
Whenever you have exponential growth, whatever it is that’s growing will double its presence/population in a given amount of time. Let’s say you start with a population that has just one infected person on January 1st, and the number of infected people doubles every three days. How many people will be infected by January 31? How many people will be infected by this year’s equinox: March 19?
If the exponential nature of the infection transmission isn’t stemmed in any way, there will be 1024 infected people on January 31: about a thousand times as many as you began with. That’s a lot, but remember that this continues to double every three days as long as this growth remains exponential. On February 3, there will be twice as many: 2048 infected. On February 6, that rises to 4096. By the time you get to March 19, which is 78 days after the initial infection, some 67 million people will be infected.
Exponential growth is so powerful not because it’s necessarily fast, but because it’s relentless. Without introducing a factor to suppress it, exponential growth is an infectious disease doctor’s nightmare, particularly as more time goes on. Thankfully, there’s virtually no chance of the world reaching 67 million infections in March of 2020. This alarming thought of exponential growth infecting an enormous number of people in such a short time is not our likely fate with the COVID-19 coronavirus, for a few reasons.
The majority of infections that are going around in the population right now have occurred in the most recent “doubling period” of exponential growth. In addition, the “exponential growth” part can be stemmed, suppressed, or stopped entirely through a number of actions that we have the ability to take, both as individuals and as a collective society. There are a number of actions we can take, and they will have different effects and impacts on how rapidly and extensively this disease will spread. If we practice social distancing, for instance, where we avoid large gatherings and keep a significant distance between ourselves and others’ bodies, we can reduce the transmission rate. Interventions such as this can effectively increase the “doubling time” significantly, slowing the rate of infection in the uninfected population. The more successful an intervention such as this is, the more spread out in time the infection will be among the public: what infectious disease specialists are calling “flattening the curve,” which prevents everyone from getting sick at once. This didn’t happen in countries like Italy and Iran during a critical period, and explains why both infection rates and death rates are so high in those countries.
This also showcases why taking action early — long before the number of infections is unmanageably large — is so vitally important from a public health perspective. For the COVID-19 coronavirus, there are four periods associated with the disease:
-1. Infected, but not contagious and not symptomatic.
-2. Infected and contagious, but not symptomatic.
-3. Infected, contagious, and symptomatic.
-4. Recovering (assuming survival), where you may still have symptoms but are no longer contagious.
Without a widespread test available to us all, particularly to those of us who live in communities, cities, or counties where COVID-19 is known to be present, we cannot know who’s infected and who isn’t. Someone who has COVID-19 and is contagious looks just like someone who’s uninfected, and even one contagious person can infect a great many others. The majority of people with a COVID-19 infection, particularly during the exponential growth phase, don’t know they have it, and don’t know they can infect others.
But even with an ignorance of who’s infectious, who’s contagious, and how widespread the infection actually is, there are still two major actions we can take to stop the infection from growing exponentially in the population: isolation and sheltering-in-place.
Isolation involves taking someone who either is infected or is likely to be infected (perhaps because they had recent contact with someone who later tested positive) and separating them from the larger population. A successfully isolated person (or household) will not spread their infection to others; if we can successfully isolate 50%, 90%, or 99% of the infected population, then only 50%, 10%, or 1% (respectively) of the infected population can continue to transmit the disease to others.
Sheltering-in-place, while more severe, can keep uninfected people from becoming infected by preventing them from coming into contact with (potentially) infected members population.
The biggest problem with these strategies isn’t their effectiveness; they’re extremely effective. It isn’t even that we don’t have a reliable, robust, widespread test to know who’s infected and who’s not; even in the absence of a test, social distancing, isolation, and sheltering-in-place can crush the exponential growth phase of an infectious disease.
The problem is that even a small number of people who participate in large gatherings can infect enormous numbers of other people. The good actions of hundreds of infected individuals can all be undone by one infected individual — whether through malice or ignorance — who goes out in public and has close contact with a large number of others.
_________
_________
Epidemic curve:
Epidemic curve = curve
An epidemic curve, also known as an epi curve or epidemiological curve, is a statistical chart used in epidemiology to visualize the onset of a disease outbreak. An epidemic curve shows progression of illnesses in an outbreak over time. Epi curves depict when people became ill by day, week, or month. Epidemic curves generally show the frequency of new cases compared to the date of disease onset.
_
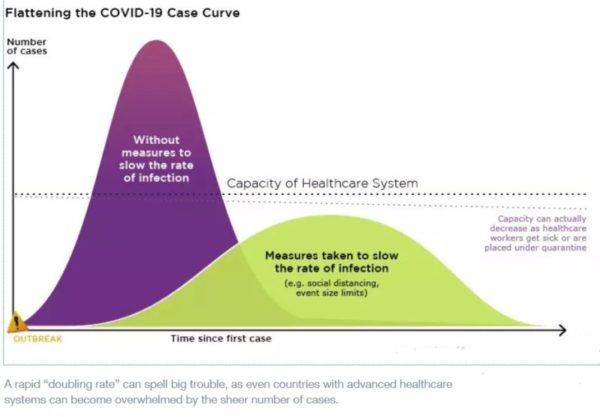
_
Coronavirus ‘Doubling Time’
As coronavirus numbers have ticked steadily upwards in some states and cities, officials have watched one specific figure to see whether they’re facing a flattening curve or runaway outbreak: the doubling rate.
Simply put, it’s how many days it takes for the number of coronavirus cases, hospitalizations or deaths to double. The shorter the time frame, the steeper the curve and the faster the growth.
COVID-19 epidemic doubling time by Chinese province was increasing from January 20 through February 9, 2020. The harmonic mean of the arithmetic mean doubling time estimates ranged from 1.4 (Hunan, 95% CI, 1.2-2.0) to 3.1 (Xinjiang, 95% CI, 2.1-4.8), with an estimate of 2.5 days (95% CI, 2.4-2.6) for Hubei. COVID-19 cases in the U.S. were doubling in nearly four days, faster than the rate in India. Cases in countries like Spain, Germany, France, Brazil, Russia, U.K. and Canada were doubling between four and six days. Cases in India were also doubling at a similar duration. The number of confirmed COVID-19 cases in India are now doubling at a slower rate compared to the first week of the nationwide lockdown which started on March 25. As of April 17, cases in India were doubling between every five and six days, similar to that in Brazil and Russia. Longer doubling times have helped stagger the burden on healthcare facilities and improve recovery.
_
Flatten the curve:
During an outbreak, if we can’t control the spread of the disease, then the number of sick people quickly rises. For Covid-19 we know this: about 15 out of every 100 people will need to be hospitalized for between two and six weeks. About one in 20 people will end up in intensive care, and one in a hundred will need a ventilator to help them breathe. Recent estimate suggest that one in three hundred will need ventilator. But we only have so many hospital and intensive care beds and ventilators. And they aren’t just sitting around waiting for an outbreak. Lots of them are already being used to care for people with things other than Covid-19. If Covid-19 spreads rapidly, our medical staff could find themselves in the awful position of having to decide who gets a bed or a ventilator.
That’s where Flatten the Curve comes in.
It means pulling out all the stops to try to slow the spread of the disease. If we can spread the number of people who contract the disease over a longer period of time, then we’ll have enough beds and ventilators for everyone who needs them.
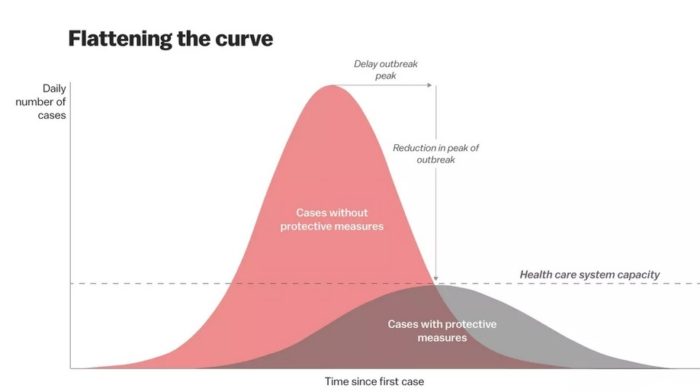
Medical professionals and public health experts are being called on to help flatten the curve in the chart graph to stagger the rate of coronavirus cases, so hospitals will be able to treat everyone who gets it or needs to be tested. Important to remember that Covid-19 epidemic control measures may only delay cases, not prevent. However, this helps limit surge and gives hospitals time to prepare and manage. It’s the difference between finding an ICU bed & ventilator or being treated in the parking lot tent. So flattening the curve will not reduce the number of people who will become infected or even die from COVID-19, it’s designed to keep it to levels that the health care system and society can handle. By most standards in most places – social distancing and other measures have kept our hospitals from being overwhelmed by coronavirus disease patients. While the cases and deaths continue to rise, many communities have avoided a spike.
_
If we reduce the infections as much as possible, our healthcare system will be able to handle cases much better, driving the fatality rate down. And, if we spread this over time, we will reach a point where the rest of society can be vaccinated, eliminating the risk altogether. So our goal is not to eliminate coronavirus contagions. It’s to postpone them.
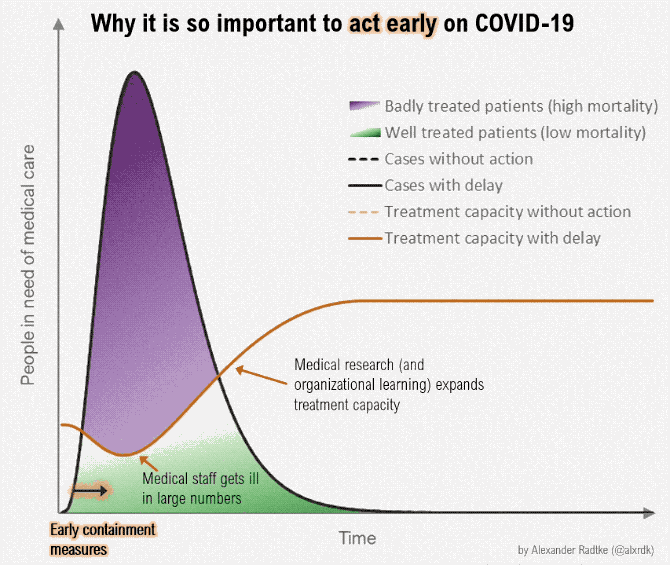
The more we postpone cases, the better the healthcare system can function, the lower the mortality rate, and the higher the share of the population that will be vaccinated before it gets infected.
_
Non-pharmaceutical interventions such as hand washing, social distancing, isolation and disinfection reduce the daily infections, therefor flattening the epidemic curve. A successfully flatten curve spreads health care needs over time and the peak of hospitalizations under the health care capacity line. Doing so, resources, be it material or human, are not exhausted and lacking.
_
Many jurisdictions are implementing some or all of these measures to help flatten the curve:
- Quarantining
- Encouraging social distancing
- Encouraging working from home
- Closing schools and other institutions
- Placing hard limits on the size of crowds at events
The following event risk assessment chart explains why this last measure is critical to limiting the spread of the virus.
In scenario B above, which assumes just 20,000 active cases of COVID-19 in the U.S., there’s nearly a 50% chance an infected person will be attending a 10,000 person conference or sporting event. This is precisely the reason why temporary limits on crowd size are popping up in many jurisdictions around the world. The chance of infected person transmitting infection increases as total number of infected persons rises and the size of the crowd. Since all over world infected people are increasing, the only option we have is to limit the size of crowd at any event.
_
Raising the line:
The goals of community mitigation include delaying and reducing peak burden on healthcare—known as flattening the curve—and lessening overall cases and health impact. Also, increasing healthcare capacity—called raising the line—such as by increasing bed count, personnel, and equipment, can help to meet increased demand. Elective procedures can be cancelled to free equipment and staffs.
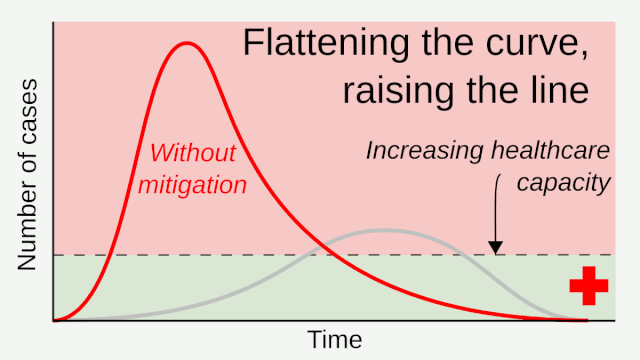
In order to move away from social distancing and return to normal, we need to flatten the curve by isolation and mass testing, and to raise the line. We need to build up health care capability including mass testing, softwares and infrastructures to trace and quarantine infected people, and scale up cares including by resolving shortages in personal protection equipment, face masks. Territories with weak finances and health care capacity face an uphill battle to raise the line, and therefore need more imperative pressure to flatten the curve.
_
If mitigation is inadequate in strictness or duration—such as through premature relaxation of physical distancing rules or stay-at-home orders—there can be a resurgence after the initial surge and mitigation.
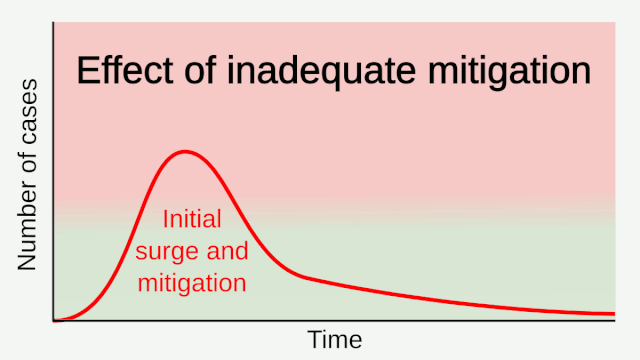
_
If all these measures aren’t able to slow things down enough, then we’ll need to take more drastic action. That could be anything from as many people as possible working from home, and stopping all large gatherings, to a full-on lockdown like China and Italy have had to resort to.
_
This is how South Korea flattened its coronavirus curve:
South Korea’s COVID-19 infection rates have been falling thanks to a rigorous testing regime and clear public information.
Early testing:
Early testing meant early detection of infections in South Korea, where a relatively larger proportion of patients showed either no symptoms or very mild ones.
Extensive tracing and mapping:
South Korean leaders have amped up efficiency for overwhelmed hospitals by digitally monitoring lower-risk patients under quarantine, as well as keeping close tabs on visiting travelers who are required to enter their symptoms into an app. That people are willing to forgo privacy rights and allow the publication of sensitive information underlines the willingness to pay the digital cost of state surveillance in the name of public safety, said professor Ju Youngkee, who teaches health and data journalism at Hallym University. According to a survey conducted by Seoul National University’s Graduate School of Public Health, 78.5 percent of respondents agreed that they would sacrifice the protection of their privacy rights to help prevent a national epidemic.
Public spaces transformed into Public Service Announcement venues:
The refusal by some Britons to follow the government’s social distancing measures in the United Kingdom prompted the closings of thousands of pubs, cafés and restaurants, leaving many to consider layoffs and shutting for good. In South Korea, however, reminders from the government aren’t delivered in the form of blanket lockdowns. Commuters wait at platforms and in subway cars as announcements are played in different languages, including English and Chinese. A female voice lists tips such as “blocking” your mouth when coughing. The broadcasts are one of many upgrades from the 2015 Middle East Respiratory Syndrome outbreak — a failing of the South Korean system that cost 38 lives and amounted to 186 cases, the highest number outside the Middle East. Now, hand sanitizer bottles are placed in front of nearly every entrance and elevator for public use. And of the 1,000 people who took part in a study by Seoul National University, 97.6 percent responded that they at least sometimes wear a mask when they are outside, 63.6 percent of whom said they always wear one. Wearing masks or self-monitoring alone isn’t foolproof to people in Korea, but taking part in these practices as a group is believed to have an impact. This says that your individual choices may not have immediate benefit to you as an individual but will benefit the herd — that it doesn’t work unless everybody is in the game.
______
______
Does quarantine help?
Currently, no effective pharmacological interventions or vaccines are available to treat or prevent COVID‐19. For this reason, nonpharmacological public health measures such as isolation, social distancing, and quarantine are the only effective ways to respond to the outbreak. Isolation refers to the separation of symptomatic patients whereas quarantine is the restriction of asymptomatic healthy people who have had contact with confirmed or suspected cases. Quarantine can be implemented on a voluntary basis or can be legally enforced by authorities and may be applied at an individual, group, or community level (community containment (Cetron 2005)). A recent rapid review reported that quarantine can have negative psychological effects such as post‐traumatic stress symptoms, confusion and anger, which can lead to adverse long‐term psychological effects (Brooks 2020). At this time, WHO and the US Center for Disease Control and Prevention (CDC) recommend 14 days of quarantine for individuals who were in close contact with a confirmed case, based on the estimated incubation period of SARS‐CoV‐2 (Jernigan 2020; WHO 2020e).
According to the International Health Regulations 2005 (WHO 2005), that govern the management of disease outbreaks in 196 countries, any public health measures must be based on scientific evidence and recommendations from WHO (Habibi 2020). At the beginning of February 2020, WHO requested the review authors to conduct a rapid review on the effectiveness of quarantine during serious coronavirus outbreaks to support recommendations on quarantine.
_
How effective is quarantine alone or combined with other public health measures to control coronavirus (COVID‐2019)? March 2020 review:
What did authors want to find out?
Authors wanted to find out whether and how effectively quarantine stops COVID‐19 spreading and if it prevents death. They wanted to know if it was more effective when combined with other measures, such as closing schools. They also wanted to know what it costs.
Authors included 29 studies. Ten studies focused on COVID‐19, 15 on SARS, two on SARS plus other viruses, and two on MERS. Most of the studies combined existing data to create a model (a simulation) for predicting how events might occur over time, for people in different situations (called modelling studies). The COVID‐19 studies simulated outbreaks in China, UK, South Korea, and on the cruise ship Diamond Princess. Four studies looked back on the effect of quarantine on 178,122 people involved in SARS and MERS outbreaks (called ‘cohort’ studies). The remaining studies modelled SARS and MERS outbreaks.
The modelling studies all found that simulated quarantine measures reduce the number of people with the disease by 44% to 81%, and the number of deaths by 31% to 63%. Combining quarantine with other measures, such as closing schools or social distancing, is more effective at reducing the spread of COVID‐19 than quarantine alone. The SARS and MERS studies agreed with the studies on COVID‐19. Two SARS modelling studies assessed costs. They found that the costs were lower when quarantine measures started earlier.
Conclusion:
Despite limited evidence, all the studies found quarantine to be important in reducing the number of people infected and the number of deaths. Results showed that quarantine was most effective, and cost less, when it was started earlier. Combining quarantine with other prevention and control measures had a greater effect than quarantine alone.
________
________
Social distancing:
Social distancing, or physical distancing is a set of non-pharmaceutical interventions or measures taken to prevent the spread of a contagious disease by maintaining a physical distance between people and reducing the number of times people come into close contact with each other. It involves keeping a distance of six feet or two meters from others and avoiding gathering together in large groups.
By reducing the probability that a given uninfected person will come into physical contact with an infected person, the disease transmission can be suppressed, resulting in fewer deaths. The measures are combined with good respiratory hygiene and hand washing. During the 2019–2020 coronavirus pandemic, the World Health Organization (WHO) suggested the reference to “physical” as an alternative to “social”, in keeping with the notion that it is a physical distance which prevents transmission; people can remain socially connected via technology. To slow down the spread of infectious diseases and avoid overburdening healthcare systems, particularly during a pandemic, several social distancing measures are used, including the closing of schools and workplaces, isolation, quarantine, restricting movement of people and the cancellation of mass gatherings.
_
Figure below shows how social distancing reduces the rate of disease transmission and can stop an outbreak.

_
Social distancing measures date back to at least the fifth century BCE. The Bible contains one of the earliest known references to the practice in the Book of Leviticus 13:46: “And the leper in whom the plague is…he shall dwell alone; [outside] the camp shall his habitation be.” During the Plague of Justinian, emperor Justinian enforced an ineffective quarantine on the Byzantine Empire, including dumping bodies into the sea, predominantly blaming the widespread outbreak on “Jews, Samaritans, pagans, heretics, Arians, Montanists, and homosexuals”. In modern times, social distancing measures have been successfully implemented in several previous epidemics. In St. Louis, shortly after the first cases of influenza were detected in the city during the 1918 flu pandemic, authorities implemented school closures, bans on public gatherings and other social distancing interventions. The case fatality rates in St. Louis were much less than in Philadelphia, which despite having cases of influenza, allowed a mass parade to continue and did not introduce social distancing until more than two weeks after its first cases.
_
Social distancing measures are more effective when the infectious disease spreads via droplet contact (coughing or sneezing); direct physical contact, including sexual contact; indirect physical contact (e.g., by touching a contaminated surface); or airborne transmission (if the microorganism can survive in the air for long periods). The measures are less effective when an infection is transmitted primarily via contaminated water or food or by vectors such as mosquitoes or other insects. Drawbacks of social distancing can include loneliness, reduced productivity and the loss of other benefits associated with human interaction.
_
Social distancing measures are steps you can take to reduce social interaction between people. This will help reduce the transmission of coronavirus (COVID-19).
They are to:
- Avoid contact with someone who is displaying symptoms of coronavirus (COVID-19). These symptoms include high temperature and/or new and continuous cough
- Avoid non-essential use of public transport when possible
- Work from home, where possible.
- Avoid large and small gatherings in public spaces, noting that pubs, restaurants, leisure centers and similar venues are currently shut as infections spread easily in closed spaces where people gather together.
- Avoid gatherings with friends and family. Keep in touch using remote technology such as phone, internet, and social media.
- Use telephone or online services to contact your GP or other essential services
- Everyone should be trying to follow these measures as much as is practicable.
Social distancing measure should be strictly followed particularly if you:
-are over 70
-have an underlying health condition
-are pregnant
This advice is likely to be in place for many weeks.
_
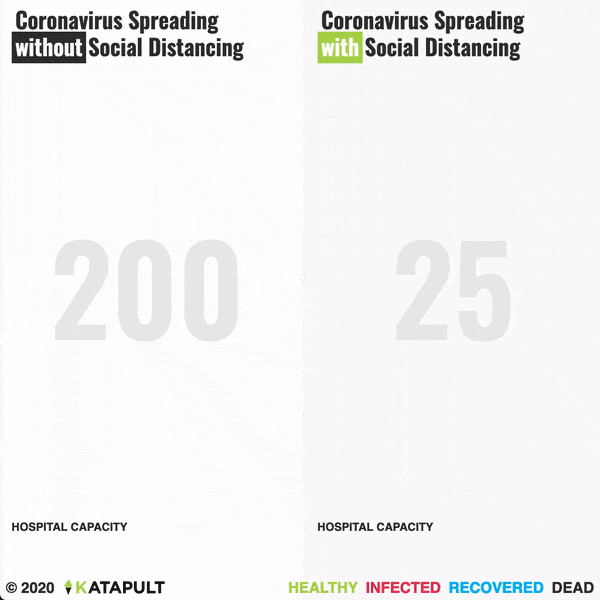
Above Simulations compare rate of spread of infection, and number of deaths due to overrun of hospital capacity, when social interactions are “normal” (left, 200 people moving freely) and “distanced” (right, 25 people moving freely).
Green = Healthy, uninfected individuals
Red = Infected individuals
Blue = Recovered individual
Black = Dead individuals
_
Theoretical basis of social distancing:
From the perspective of epidemiology, the basic goal behind social distancing is to decrease the basic reproduction number,
{\displaystyle R_{0}}R0, which is the average number of secondary infected individuals generated from one primary infected individual in a population where all individuals are equally susceptible to a disease. In a basic model of social distancing, where a proportion ‘f’ of the population engages in social distancing to decrease their interpersonal contacts to a fraction ‘a’ of their normal contacts, the new effective reproduction number R is given by formula below:
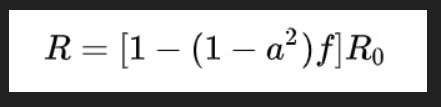
For example, 25% of the population reducing their social contacts to 50% of their normal level gives an effective reproduction number about 81% of the basic reproduction number. A seemingly small reduction has a profound effect in delaying the exponential growth and spread of a disease. Where the value of R can be brought below 1 for sufficiently long, containment is achieved, and the number infected should decrease.
_
From the beginning, the Centers for Disease Control and Prevention (CDC) have said that SARS-CoV-2 is a respiratory virus, and as such, it is mainly transmitted between people through “respiratory droplets” when symptomatic people sneeze or cough. This idea, that large droplets of virus-laden mucus are the primary mode of transmission, guides the CDC’s advice to maintain at least a 6-foot distance between you and other people. The thinking is that gravity causes those large droplets (which are bigger than 5 microns in size) to fall to the ground within a distance of 6 feet from the infected person.
But that 6-foot guideline is more of a ballpark estimate than a hard and fast rule, said Josh Santarpia, the research director of Countering Weapons of Mass Destruction Program at the University of Nebraska’s National Strategic Research Institute. “There really isn’t anything magic about standing 6 feet away from someone that you are interacting with directly. If you stand talking to someone who is infected with the virus, whether it’s 3 feet or 6 feet, there is going to be some risk of infection,” Santarpia said. That’s because even large respiratory droplets can travel fairly far if the airflow conditions are right, Santarpia said.
And some experts believe the 6-foot rule is based on outdated information.
“6 feet is probably not safe enough. The 3-6 feet rule is based on a few studies from the 1930s and 1940s, which have since been shown to be wrong — droplets can travel farther than 6 feet,” said Raina MacIntyre, a principal research fellow and professor of global biosecurity, who heads the Biosecurity Program at the Kirby Institute, in Australia. “Yet hospital infection control experts continue to believe this rule. It’s like the flat Earth theory — anyone who tries to discuss the actual evidence is shouted down by a chorus of believers.”
Another complicating factor is that at least 25% of the people who are transmitting the virus may be asymptomatic at the time, said Dr. Robert Redfield, director of the Centers for Disease Control and Prevention. That suggests coughs and sneezes aren’t necessary to transmit the virus, simply breathing and talking spreads the virus.
What is true is that persons who have a member of their household infected with the virus have a higher probability of getting infected with COVID than people who do not have a member of their household infected. This tells us a lot. This tells us that close contact is the most important factor. Briefly passing a person on the street, at a distance of 6 feet, is likely to pose a low risk of infection. Chatting at a distance of 6 feet with that same person for a few hours will be higher risk.
______
______
Containment and mitigation:
There are several stages to control an epidemic, starting with anticipation and ending with eradication. But it’s too late for most options today. With this level of cases, the only two options politicians have in front of them are containment and mitigation. Strategies to control of the present outbreak are containment or suppression, and mitigation.
Mitigation:
Mitigation strategy has aim of slowing down transmission but not necessarily stopping epidemic spread (reproduction number R0 not necessarily <1) with protection of more vulnerable groups and reducing the peak healthcare demand. Mitigation is making sure all the cases are identified, controlled, and isolated. It’s what Singapore, Hong Kong, Japan or Taiwan are doing so well: They very quickly limit people coming in, identify the sick, immediately isolate them, use heavy protective gear to protect their health workers, track all their contacts, quarantine them… This works extremely well when you’re prepared and you do it early on, and don’t need to grind your economy to a halt to make it happen. The lengths at which china went to contain the virus are mind-boggling. For example, they had up to 1,800 teams of 5 people each tracking every infected person, everybody they got interacted with, then everybody those people interacted with, and isolating the bunch. That’s how they were able to contain the virus across a billion-people country.
_
Does travel ban works?
We can know by looking at the Wuhan travel ban.
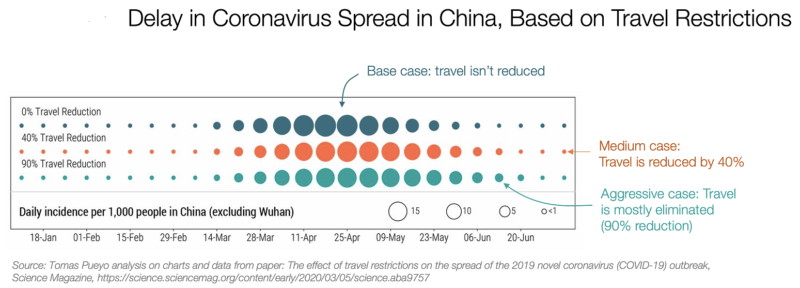
This chart shows the impact that the Wuhan travel ban had delaying the epidemic. The bubble sizes show the number of daily cases. The top line shows the cases if nothing is done. The two other lines show the impact if 40% and 90% of travel is eliminated. If you don’t see much difference, you’re right. It’s very hard to see any change in the development of the epidemic. Researchers estimate that, all in all, the Wuhan travel ban only delayed the spread in China by 3–5 days.
Now what did researchers think the impact of reducing transmission would be?
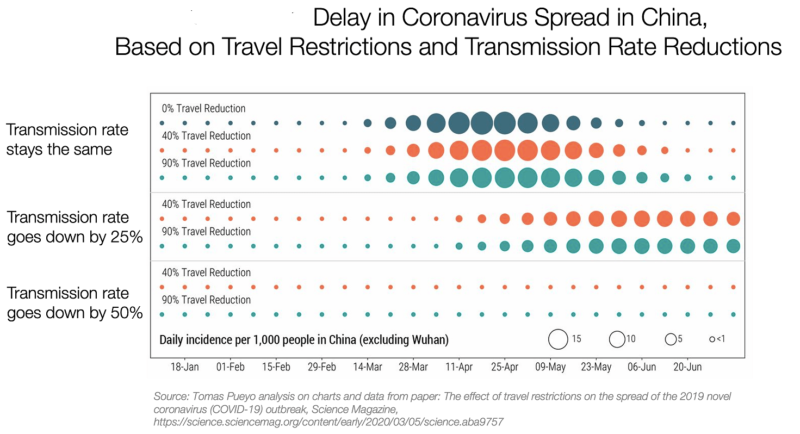
The top bloc is the same as the one you’ve seen before. The two other blocks show decreasing transmission rates. If the transmission rate goes down by 25% (through Social Distancing), it flattens the curve and delays the peak by a whole 14 weeks. Lower the transition rate by 50%, and you can’t see the epidemic even starting within a quarter.
The US administration’s ban on European travel is good: It has probably bought them a few hours, maybe a day or two. But not more. It is not enough. It’s mitigation when what’s needed is containment. Once there are hundreds or thousands of cases growing in the population, preventing more from coming, tracking the existing ones and isolating their contacts isn’t enough anymore. The next level is containment.
_
Containment:
Containment strategy has aim in which epidemic spread is reversed to reproduction number R0 <1. Interventions in the mitigation strategy would be case isolation, quarantine of household contacts of a case and social distancing of the elderly (>70 years). Containment requires heavy social distancing. People need to stop hanging out to drop the transmission rate (R0), from the R0=2–3 that the virus follows without measures, to below 1, so that it eventually dies out. These measures require closing companies, shops, mass transit, schools, enforcing lockdowns… The worse your situation, the worse the social distancing. The earlier you impose heavy measures, the less time you need to keep them, the easier it is to identify brewing cases, and the fewer people get infected. This is what Wuhan had to do. This is what Italy was forced to accept. Because when the virus is rampant, the only measure is to lock down all the infected areas to stop spreading it at once.
_
In the mitigation strategy interventions have to be timely instituted (not too early) to give chance for herd immunity to develop. With the containment strategy the more successful the interventions are applied the less possibility of herd immunity and hence another epidemic is expected later this year after relaxing the instituted interventions.
Some studies concluded that the mitigation strategy, although associated with a herd immunity would result in overwhelming the healthcare system in both the UK and the USA and that it will never be able to completely protect those at risk from severe disease or death and the resulting mortality would therefore still be high. A combination of both containment and mitigation measures may be undertaken at the same time. Containment requires more extreme measures like total lockdown so as to reverse the pandemic by reducing the basic reproduction number to less than 1. Simulations for Great Britain and the United States show that mitigation (slowing but not stopping epidemic spread) and containment (reversing epidemic growth) have major challenges. Optimal mitigation policies might reduce peak healthcare demand by 2/3 and deaths by half, but still result in hundreds of thousands of deaths and health systems being overwhelmed. Containment can be preferred but needs to be maintained for as long as the virus is circulating in the human population (or until a vaccine becomes available), as transmission otherwise quickly rebounds when measures are relaxed. Long-term intervention to suppress the pandemic causes social and economic costs.
Part of managing an infectious disease outbreak is trying to decrease the epidemic peak, known as flattening the epidemic curve. This decreases the risk of health services being overwhelmed and provides more time for vaccines and treatments to be developed. Non-pharmaceutical interventions that may manage the outbreak include personal preventive measures, such as hand hygiene, wearing face-masks, and self-quarantine; community measures aimed at physical distancing such as closing schools and cancelling mass gathering events; community engagement to encourage acceptance and participation in such interventions; as well as environmental measures such surface cleaning.
More drastic actions aimed at containing the outbreak were taken in China once the severity of the outbreak became apparent, such as quarantining entire cities and imposing strict travel bans. Other countries also adopted a variety of measures aimed at limiting the spread of the virus. South Korea introduced mass screening and localized quarantines, and issued alerts on the movements of infected individuals. Singapore provided financial support for those infected who quarantined themselves and imposed large fines for those who failed to do so. Taiwan increased face mask production and penalized hoarding of medical supplies.
______
How will country-based mitigation measures influence the course of the COVID-19 epidemic?
Lancet: March 2020:
Governments will not be able to minimize both deaths from coronavirus disease 2019 (COVID19) and the economic impact of viral spread. Keeping mortality as low as possible will be the highest priority for individuals; hence governments must put in place measures to ameliorate the inevitable economic downturn. In authors’ view, COVID19 has developed into a pandemic, with small chains of transmission in many countries and large chains resulting in extensive spread in a few countries, such as Italy, Iran, South Korea, and Japan. Most countries are likely to have spread of COVID19, at least in the early stages, before any mitigation measures have an impact.
What has happened in China shows that quarantine, social distancing, and isolation of infected populations can contain the epidemic. This impact of the COVID19 response in China is encouraging for the many countries where COVID19 is beginning to spread. However, it is unclear whether other countries can implement the stringent measures China eventually adopted. Singapore and Hong Kong, both of which had severe acute respiratory syndrome (SARS) epidemics in 2002–03, provide hope and many lessons to other countries. In both places, COVID19 has been managed well to date, despite early cases, by early government action and through social distancing measures taken by individuals.
The course of an epidemic is defined by a series of key factors, some of which are poorly understood at present for COVID19. The basic reproduction number (R0), which defines the mean number of secondary cases generated by one primary case when the population is largely susceptible to infection, determines the overall number of people who are likely to be infected, or more precisely the area under the epidemic curve. For an epidemic to take hold, the value of R0 must be greater than unity in value. A simple calculation gives the fraction likely to be infected without mitigation. This fraction is roughly 1–1/R0. With R0 values for COVID19 in China around 2·5 in the early stages of the epidemic, authors calculate that approximately 60% of the population would become infected. This is a very worst-case scenario for a number of reasons. Authors are uncertain about transmission in children, some communities are remote and unlikely to be exposed, voluntary social distancing by individuals and communities will have an impact, and mitigation efforts, such as the measures put in place in China, greatly reduce transmission. As an epidemic progress, the effective reproduction number (R) declines until it falls below unity in value when the epidemic peaks and then decays, either due to the exhaustion of people susceptible to infection or the impact of control measures.
The speed of the initial spread of the epidemic, its doubling time, or the related serial interval (the mean time it takes for an infected person to pass on the infection to others), and the likely duration of the epidemic are determined by factors such as the length of time from infection to when a person is infectious to others and the mean duration of infectiousness. For the 2009 influenza A H1N1 pandemic, in most infected people these epidemiological quantities were short with a day or so to infectiousness and a few days of peak infectiousness to others. By contrast, for COVID19, the serial interval is estimated at 4·4–7·5 days, which is more similar to SARS.
First among the important unknowns about COVID19 is the case fatality rate (CFR), which requires information on the denominator that defines the number infected. Authors are unaware of any completed largescale serology surveys to detect specific antibodies to COVID19. Best estimates suggest a CFR for COVID19 of about 0·3–1%, which is higher than the order of 0·1% CFR for a moderate influenza A season.
The second unknown is the whether infectiousness starts before onset of symptoms. The incubation period for COVID19 is about 5–6 days. Combining this time with a similar length serial interval suggests there might be considerable presymptomatic infectiousness. For reference, influenza A has a presymptomatic infectiousness of about 1–2 days, whereas SARS had little or no presymptomatic infectiousness. There have been few clinical studies to measure COVID19 viraemia and how it changes over time in individuals. In one study of 17 patients with COVID19, peak viraemia seems to be at the end of the incubation period, pointing to the possibility that viraemia might be high enough to trigger transmission for 1–2 days before onset of symptoms. If these patterns are verified by more extensive clinical virological studies, COVID19 would be expected to be more like influenza A than SARS. For SARS, peak infectiousness took place many days after first symptoms, hence the success of quarantine of patients with SARS soon after symptoms started and the lack of success for this measure for influenza A and possibly for COVID19.
The third uncertainty is whether there are a large number of asymptomatic cases of COVID19. Estimates suggest that about 80% of people with COVID19 have mild or asymptomatic disease, 14% have severe disease, and 6% are critically ill, implying that symptombased control is unlikely to be sufficient unless these cases are only lightly infectious.
The fourth uncertainty is the duration of the infectious period for COVID19. The infectious period is typically short for influenza A, but it seems long for COVID19 on the basis of the few available clinical virological studies, perhaps lasting for 10 days or more after the incubation period. The reports of a few superspreading events are a routine feature of all infectious diseases and should not be overinterpreted.
What do these comparisons with influenza A and SARS imply for the COVID19 epidemic and its control? First, we think that the epidemic in any given country will initially spread more slowly than is typical for a new influenza A strain. COVID19 had a doubling time in China of about 4–5 days in the early phases. Second, the COVID19 epidemic could be more drawn out than seasonal influenza A, which has relevance for its potential economic impact. Third, the effect of seasons on transmission of COVID19 is unknown; however, with an R0 of 2–3, the warm months of summer in the northern hemisphere might not necessarily reduce transmission below the value of unity as they do for influenza A, which typically has an R0 of around 1·1–1·5. Closely linked to these factors and their epidemiological determinants is the impact of different mitigation policies on the course of the COVID19 epidemic.
A key issue for epidemiologists is helping policy makers decide the main objectives of mitigation—e.g., minimizing morbidity and associated mortality, avoiding an epidemic peak that overwhelms healthcare services, keeping the effects on the economy within manageable levels, and flattening the epidemic curve to wait for vaccine development and manufacture on scale and antiviral drug therapies. Such mitigation objectives are difficult to achieve by the same interventions, so choices must be made about priorities. For COVID19, the potential economic impact of self-isolation or mandated quarantine could be substantial, as occurred in China.
No vaccine or effective antiviral drug is likely to be available soon. Vaccine development is underway, but the key issues are not if a vaccine can be developed but where phase 3 trials will be done and who will manufacture vaccine at scale. The number of cases of COVID19 are falling quickly in China, but a site for phase 3 vaccine trials needs to be in a location where there is ongoing transmission of the disease. Manufacturing at scale requires one or more of the big vaccine manufacturers to take up the challenge and work closely with the biotechnology companies who are developing vaccine candidates. This process will take time and we are probably a least 1 year to 18 months away from substantial vaccine production.
So what is left at present for mitigation is voluntary plus mandated quarantine, stopping mass gatherings, closure of educational institutes or places of work where infection has been identified, and isolation of households, towns, or cities. Some of the lessons from analyses of influenza A apply for COVID19, but there are also differences. Social distancing measures reduce the value of the effective reproduction number R. With an early epidemic value of R0 of 2·5, social distancing would have to reduce transmission by about 60% or less, if the intrinsic transmission potential declines in the warm summer months in the northern hemisphere. This reduction is a big ask, but it did happen in China.
School closure, a major pillar of the response to pandemic influenza A, is unlikely to be effective given the apparent low rate of infection among children, although data are scarce. Avoiding large gatherings of people will reduce the number of superspreading events; however, if prolonged contact is required for transmission, this measure might only reduce a small proportion of transmissions. Therefore, broaderscale social distancing is likely to be needed, as was put in place in China. This measure prevents transmission from symptomatic and nonsymptomatic cases, hence flattening the epidemic and pushing the peak further into the future. Broaderscale social distancing provides time for the health services to treat cases and increase capacity, and, in the longer term, for vaccines and treatments to be developed. Containment could be targeted to particular areas, schools, or mass gatherings. This approach underway in northern Italy will provide valuable data on the effectiveness of such measures. The greater the reduction in transmission, the longer and flatter the epidemic curve, with the risk of resurgence when interventions are lifted perhaps to mitigate economic impact.
The key epidemiological issues that determine the impact of social distancing measures are what proportion of infected individuals have mild symptoms and whether these individuals will selfisolate and to what effectiveness; how quickly symptomatic individuals take to isolate themselves after the onset of symptoms; and the duration of any nonsymptomatic infectious period before clear symptoms occur with the linked issue of how transmissible COVID19 is during this phase.
Individual behaviour will be crucial to control the spread of COVID19. Personal, rather than government action, in western democracies might be the most important issue. Early selfisolation, seeking medical advice remotely unless symptoms are severe, and social distancing are key. Government actions to ban mass gatherings are important, as are good diagnostic facilities and remotely accessed health advice, together with specialised treatment for people with severe disease. Isolating towns or even cities is not yet part of the UK Government action plan. This plan is light on detail, given the early stages of the COVID19 epidemic and the many uncertainties, but it outlines four phases of action entitled contain, delay, research, and mitigate. The UK has just moved from contain to delay, which aims to flatten the epidemic and lower peak morbidity and mortality. If measures are relaxed after a few months to avoid severe economic impact, a further peak is likely to occur in the autumn. Italy, South Korea, Japan, and Iran are at the mitigate phase and trying to provide the best care possible for a rapidly growing number of people with COVID19.
The known epidemiological characteristics of COVID19 point to urgent priorities. Shortening the time from symptom onset to isolation is vital as it will reduce transmission and is likely to slow the epidemic. However, strategies are also needed for reducing household transmission, supporting home treatment and diagnosis, and dealing with the economic consequences of absence from work. Peak demand for health services could still be high and the extent and duration of presymptomatic or asymptomatic transmission—if this turns out to be a feature of COVID19 infection—will determine the success of this strategy.
_
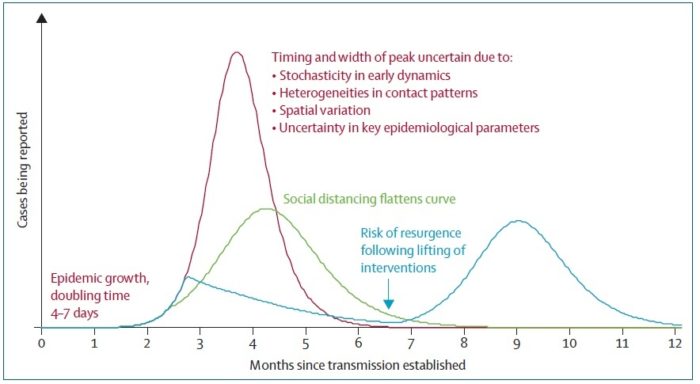
Figure above is illustrative simulations of a transmission model of COVID-19
A baseline simulation with case isolation only (red); a simulation with social distancing in place throughout the epidemic, flattening the curve (green), and a simulation with more effective social distancing in place for a limited period only, typically followed by a resurgent epidemic when social distancing is halted (blue). These are not quantitative predictions but robust qualitative illustrations for a range of model choices.
_
Contact tracing is of high importance in the early stages to contain spread, and modelbased estimates suggest, with an R0 value of 2·5, that about 70% of contacts will have to be successfully traced to control early spread. Analysis of individual contact patterns suggests that contact tracing can be a successful strategy in the early stages of an outbreak, but that the logistics of timely tracing on average 36 contacts per case will be challenging. Superspreading events are inevitable, and could overwhelm the contact tracing system, leading to the need for broaderscale social distancing interventions.
Data from China, South Korea, Italy, and Iran suggest that the CFR increases sharply with age and is higher in people with COVID19 and underlying comorbidities. Targeted social distancing for these groups could be the most effective way to reduce morbidity and concomitant mortality. During the outbreak of Ebola virus disease in west Africa in 2014–16, deaths from other causes increased because of a saturated healthcare system and deaths of healthcare workers. These events underline the importance of enhanced support for healthcare infrastructure and effective procedures for protecting staff from infection.
In northern countries, there is speculation that changing contact patterns and warmer weather might slow the spread of the virus in the summer. With an R0 of 2·5 or higher, reductions in transmission by social distancing would have to be large; and much of the changes in transmission of pandemic influenza in the summer of 2009 within Europe were thought to be due to school closures, but children are not thought to be driving transmission of COVID19. Data from the southern hemisphere will assist in evaluating how much seasonality will influence COVID19 transmission.
Modelbased predictions can help policy makers make the right decisions in a timely way, even with the uncertainties about COVID19. Indicating what level of transmission reduction is required for social distancing interventions to mitigate the epidemic is a key activity. However, it is easy to suggest a 60% reduction in transmission will do it or quarantining within 1 day from symptom onset will control transmission, but it is unclear what communication strategies or social distancing actions individuals and governments must put in place to achieve these desired outcomes. A degree of pragmatism will be needed for the implementation of social distancing and quarantine measures. Ongoing data collection and epidemiological analysis are therefore essential parts of assessing the impacts of mitigation strategies, alongside clinical research on how to best manage seriously ill patients with COVID19.
There are difficult decisions ahead for governments. How individuals respond to advice on how best to prevent transmission will be as important as government actions, if not more important. Government communication strategies to keep the public informed of how best to avoid infection are vital, as is extra support to manage the economic downturn.
______
Vaccines
The primary target in developing coronavirus vaccines has been the spike protein (S protein) which is on the surface of the virion particle, and in vivo is the most important antigen for triggering an immune response. Vaccines for the coronaviruses have been under development since the SARS outbreak, but none are yet available for humans. As the world puts a joint effort in battling the novel coronavirus, scientists and medical researchers are also working round the clock to develop a vaccine to defeat the highly infectious disease. Typically, a traditional vaccine takes years to develop as it has to go through several levels of clinical trials and needs to be tested for side-effects in the long run. However, as the experts across the globe continue to work at breakneck speed, we already have more than 100 potential vaccines for COVID-19 including the ones being developed by US-based Moderna Inc and Sinovac Biotech of China. While both the vaccine candidates have shown promising results in the initial trails, it is important to have realistic expectations from these vaccines and continue practicing social distancing to keep ourselves safe. The World Health Organization has already identified 7 to 8 top vaccine candidates that are being accelerated and effort is underway to speed up the development of these vaccines.
_______
_______
I have narrated overview of the disease itself and now I will discuss points on which experts and governments differ.
______
______
Section-1
Animal to human or lab to human?
_
Coronaviruses (family Coronaviridae, subfamily Coronavirinae) are important pathogens of birds and mammals. Coronaviruses are positive-sense RNA viruses and are currently classified into four genera: Alphacoronavirus, Betacoronavirus, Gammacoronavirus, and Deltacoronavirus. Alphacoronaviruses and betacoronaviruses are found exclusively in mammals, whereas gammacoronaviruses and deltacoronaviruses primarily infect birds. The identification of severe acute respiratory syndrome (SARS) coronavirus in 2003 prompted an intensive search for novel coronaviruses, resulting in the detection of a number of novel coronaviruses in humans, domesticated animals, and wildlife. Interestingly, surveillance of coronaviruses in wild animals has led to the discovery of the greatest diversity of coronaviruses in bat and avian species, which suggests that these animals are the natural reservoirs of the viruses. Indeed, phylogenetic studies of bat and avian coronaviruses suggest an ancient relationship with possible codivergence and coevolution with their hosts. Conversely, many coronaviruses found in bats and other mammals diverged near the tips of coronavirus phylogeny, suggesting that these viruses were the result of recent cross-species transmission events.
Molecular clock analysis based on the RNA-dependent RNA polymerase (RdRp) genomic region suggests a time of most recent common ancestor (tMRCA) for the four coronavirus genera of around 10,100 years ago, with a mean rate of 1.3 × 10⁻⁴ nucleotide substitutions per site per year. This tMRCA estimate is difficult to reconcile with a hypothetical ancient, coevolutionary relationship between coronaviruses and their bat or bird hosts. Moreover, a group of genetically related, yet distinct, alphacoronaviruses have been detected in different mouse-eared bats (Myotis spp.) on multiple continents. However, these bat species do not migrate long distances, with few traveling farther than hundreds of miles to overwinter sites. Yet, the tMRCA of Alphacoronavirus is estimated to be around 200 or 4,400 years ago, on the basis of analyses of helicase and RdRp, respectively. The limited interaction among these bat populations suggests a more ancient evolutionary association with alphacoronaviruses (i.e., codivergence or coevolution), which is incompatible with the relatively young viral tMRCAs. Notably, coronaviruses have a unique proofreading mechanism for viral RNA replication; because of the exoribonuclease activity of viral nonstructural protein 14 (Nsp14), the mutation rate of coronaviruses has been found to be similar to that of single-stranded DNA viruses (∼1 × 10⁻⁵ to 1 × 10⁻⁶ mutation per site per replication) and well below those measured in other RNA viruses (∼1 × 10⁻³ to 1 × 10⁻⁵ mutation per site per replication). For these reasons, there is a substantial underestimation of the length of the natural evolutionary history of coronaviruses.
_
A Case for the Ancient Origin of Coronaviruses, 2013 study:
Coronaviruses are found in a diverse array of bat and bird species, which are believed to act as natural hosts. Molecular clock dating analyses of coronaviruses suggest that the most recent common ancestor of these viruses existed around 10,000 years ago. This relatively young age is in sharp contrast to the ancient evolutionary history of their putative natural hosts, which began diversifying tens of millions of years ago. Here, authors attempted to resolve this discrepancy by applying more realistic evolutionary models that have previously revealed the ancient evolutionary history of other RNA viruses. By explicitly modeling variation in the strength of natural selection over time and thereby improving the modeling of substitution saturation, authors found that the time to the most recent ancestor common for all coronaviruses is likely far greater (millions of years) than the previously inferred range.
_____
Animal hosts of Human Coronaviruses (HCoVs):
The animal origin of HCoVs is supported by similarities in genome organization and phylogenetic relatedness of animal CoVs and HCoVs as well as the geographical coincidence of these viruses and plausible routes of cross-species transmission such as petting, butchering and close contact. Error-prone RNA-dependent RNA polymerase creates diversity in the CoV genome, enabling them to jump across the species barrier. However, HCoVs encode a proofreading exoribonuclease (ExoN) that plays a crucial role in RNA synthesis and replication fidelity. This serves to reduce errors in RNA replication. The inactivation of ExoN causes a mutator phenotype and the resultant virus is either attenuated or inviable. In addition, other structural and non-structural genes might also contribute to the genomic diversity of CoVs by modulating polymerase and ExoN activity. In addition to mutations, recombination and deletion also play an important role in host switching and adaptation. Among SARS-CoV, SARS-CoV-2, and MERS-CoV, a mutation rate as high as 0.80–2.38 × 10⁻³ nucleotide substation per base per year has been documented for SARS-CoV. This is comparable to those of primate lentiviruses, including HIVs. Compared to SARS-CoV, the variabilities in SARS-CoV-2 and MERS-CoV genomes are much less dramatic. It will be of interest to clarify how this might relate to their host adaptability. In this regard, adaptive mutations in the S protein of SARS-CoV have been found during the outbreak to result in better binding with the ACE2 receptor. Cryo-EM analysis has provided structural evidence that S protein of SARS-CoV-2 binds with ACE2 with higher affinity. It will be of interest to see whether SARS-CoV-2 might be further adapted to ACE2 in the near future. Since the receptor-binding domain also contains predominant neutralizing epitopes, variations in this domain are only relevant to the development of a vaccine against SARS-CoV-2.
All HCoVs have a zoonotic origin. Whereas bats are the evolutionary reservoir host of 229E, NL63, SARS-CoV, MERS-CoV, and SARS-CoV-2, parental viruses of OC43 and HKU1 have been found in rodents. Intermediate and amplifying hosts of HCoVs were also found in domestic and wild mammals. Ancestors of OC43 were identified in domestic animals such as cattle and swine. The switch of hosts from cattle or pigs to humans might have occurred in the context of a pandemic of respiratory disease recorded around 1890 in human history. Similar to MERS-CoV, 229E could be acquired by humans from dromedary camels. However, the direction of this cross-species transmission remains to be determined and the possibility cannot be excluded that both humans and camels might have acquired 229E from an unidentified host including bats.
In an effort to identify the direct animal source of SARS-CoV, SARS-CoV-related CoVs (SARS-rCoV), which share 99.8% sequence homology at the nucleotide level with SARS-CoV, were isolated in 2003 from workers working in a live animal market where animal meats were sold and from animals in the same market, including Himalayan palm civets and a raccoon dog. Palm civets were once thought to be the natural host of SARS-CoV as anti-SARS-CoV antibody was detected in civets in the market. In experimental infection, civets were equally susceptible to SARS-CoV and SARS-rCoV. Infected animals displayed clinical symptoms. However, no anti-SARS-CoV antibodies were detected in any wild or farmed civets, raising the possibility that they are not a natural host of SARS-CoV and SARS-rCoVs. In 2005, horseshoe bats were identified as a natural host of SARS-rCoVs. These bat SARS-rCoVs serve as the gene pool and an evolutionary origin of SARS-CoV. It is particularly noteworthy that a SARS-rCoV using the same ACE2 receptor as SARS-CoV was also found in bats. Their genomes share 95% nucleotide sequence homology. Presumably, palm civets and other mammals in the market were transiently infected, and they transmitted the virus to humans. It remains to be clarified whether another stable and natural reservoir host of SARS-CoV, exactly like dromedary camels for MERS-CoV, might exist.
The genomic sequence of MERS-CoV was closely related to bat CoVs HKU4 and HKU5. Bat CoVs that are evolutionarily closer to MERS-CoV, sharing ∼75% nucleotide sequence homology and using the same DPP4 receptor, were also identified. Although bats are the evolutionary reservoir host and bat CoVs serve as the gene pool of MERS-CoV, humans acquire MERS-CoV from diseased dromedary camels, but not directly from bats. These camels are the natural reservoir host of MERS-CoV. MERS-CoVs isolated from dromedaries are identical to those found in humans. Experimental infection of dromedary camels with MERS-CoV results in mild disease, shedding large quantities of the virus from the upper respiratory tract. In addition, other non-camelid domestic animals in close contact with infected camels, including sheep, goats, a cow, and donkeys, are also infected by MERS-CoV. These domestic animals could also pose a risk to humans and should, therefore, be included in the MERS-CoV surveillance programme.
SARS-CoV-2 was found to share 96.2% nucleotide homology with a bat CoV RaTG13 found in Rhinolophus affinis bats. However, their receptor-binding domains in the S proteins differ significantly. Some of the earliest patients infected with SARS-CoV-2 were linked to the Huanan Seafood Wholesale Market and other live animal markets in Wuhan, Hubei, China. SARS-CoV-2 was detected from the working environment of the market, supporting the existence of a live animal source. Bamboo rats in the family of Rhizomyidae and civets are the prime suspects of an intermediate host of SARS-CoV-2, although no concrete evidence is available. Metagenomic analysis of CoV sequences indicates that pangolins, which are a group of endangered small mammals, carry betacoronaviruses at a high rate, including some sharing ∼90% nucleotide homology with SARS-CoV-2. The pangolin betacoronaviruses are phylogenetically related to both SARS-CoV-2 and RaTG13. Existing evidence suggests that neither RaTG13 nor pangolin betacoronaviruses might be the immediate ancestor of SARS-CoV-2. Further investigations are required to determine whether pangolins and other animals might harbour parental viruses of SARS-CoV-2 and serve as its intermediate and amplifying host.
_____
Natural Hosts and Zoonotic Sources of Human Coronaviruses:
To elucidate natural hosts and potential zoonotic sources of HCoVs, it is helpful to review the virus diversity and genome characteristics of related viruses. Figure below provides a schematic overview of animal groups that may have played a role in the evolution and emergence of HCoVs.
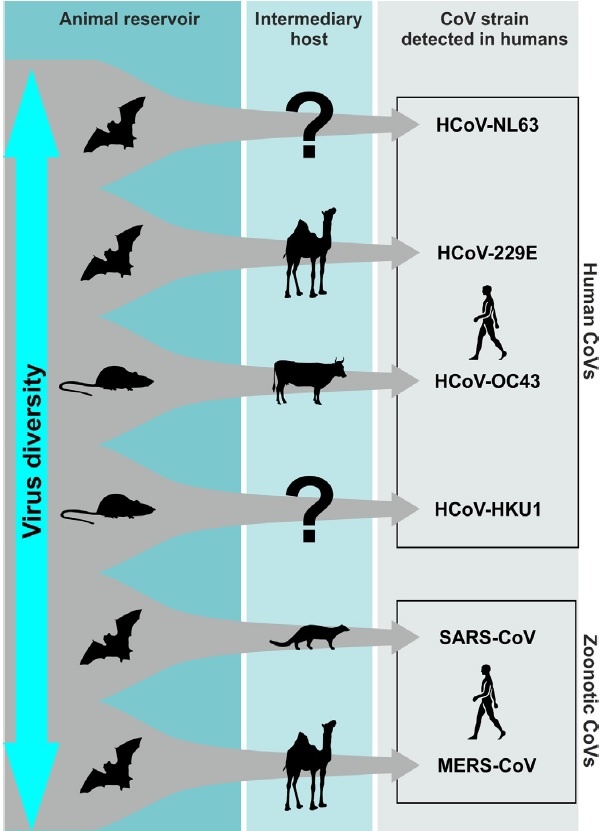
Figure above is summary diagram of the animal groups representing natural hosts and the putative intermediate hosts for the six CoVs found in humans.
______
The coronavirus disease 2019 (COVID-19) epidemic started in late December 2019 in Wuhan, the capital of Central China’s Hubei Province. Since then, it has rapidly spread across China and in other countries, raising major global concerns. The etiological agent is a novel coronavirus, SARS-CoV-2, named for the similarity of its symptoms to those induced by the severe acute respiratory syndrome. The genomic sequences of SARS-CoV-2 viruses isolated from a number of patients share sequence identity higher than 99.9%, suggesting a very recent host shift into humans. Coronaviruses are naturally hosted and evolutionarily shaped by bats. Indeed, it has been postulated that most of the coronaviruses in humans are derived from the bat reservoir. Unsurprisingly, several teams have recently confirmed the genetic similarity between SARS-CoV-2 and a bat betacoronavirus of the sub-genus Sarbecovirus. The whole-genome sequence identity of the novel virus has 96.2% similarity to a bat SARS-related coronavirus (SARSr-CoV; RaTG13) collected in Yunnan province, China, but is not very similar to the genomes of SARS-CoV (about 79%) or MERS-CoV (about 50%). It has also been confirmed that the SARS-CoV-2 uses the same receptor, the angiotensin converting enzyme II (ACE2), as the SARS-CoV. Although the specific route of transmission from natural reservoirs to humans remains unclear, several studies have shown that pangolins may have provided a partial spike gene to SARS-CoV-2; the critical functional sites in the spike protein of SAR-CoV-2 are nearly identical to one identified in a virus isolated from a pangolin.
______
Bats as a reservoir of emerging viral pathogens of humans:
As the only flying mammals, bats are known as a natural reservoir of various human pathogenic viruses including but not limited to rabies virus, Nipah and Hendra viruses, Ebola virus, and influenza viruses. They can directly transmit rabies virus, Nipah and Hendra viruses, and Ebola virus to humans. Ebola virus might also be transmitted to humans indirectly through fruits contaminated by fruit bats in the African forests. Due to large geographical distribution and great diversity of bat species, a large number of bat CoVs can be created through inter-genus and inter-species transmission and recombination.
CoV-infected bats are asymptomatic or have mild symptoms suggesting that CoVs and bats are mutually adapted to high degrees. Particularly, bats are well adapted to CoVs anatomically and physiologically. First, a high level of reactive oxygen species (ROS) generated from the high metabolic activity may suppress CoV replication in bats to a manageable level. Second, degeneration of inflammatory sensors and NF-κB signalling pathway in bats attenuates virus-induced pathology. Particularly, NLRP3 inflammasome activation is defective in bats. Third, constitutively active type I and III interferon production and innate immune response suppress viral replication through the persistent expression of interferon-stimulated genes. It has been speculated that endogenous retroviruses in bats help to sustain interferon stimulation in bats. On the other hand, STING signalling is defective in bats and this might lead to selective repression of a subset of interferon-stimulated genes. Finally, upregulation of inhibitory natural killer cell receptor NKG2/CD94 and low expression level of major histocompatibility complex class I molecules in bats may hinder natural killer cell activity. All these unique features empower bats to survive CoV infection and to co-exist with a large number of bat CoVs. Moreover, a high metabolic rate in bats may provide the selection pressure for the generation of highly pathogenic virus strains. High ROS level in bats is mutagenic by affecting proofreading of CoV polymerase. More pathogenic CoV strains may be generated by recombination, leading to the acquirement of novel proteins or protein features for host adaptation. Bats have an average life span of >25 years. The long life span and the possible establishment of persistent virus infection in bats increase the chance for cross-species transmission of bat CoVs.
_______
Lab to human? Very unlikely.
It is improbable that SARS-CoV-2 emerged through laboratory manipulation of a related SARS-CoV-like coronavirus. The RBD of SARS-CoV-2 is optimized for binding to human ACE2 with an efficient solution different from those previously predicted. Furthermore, if genetic manipulation had been performed, one of the several reverse-genetic systems available for betacoronaviruses would probably have been used. However, the genetic data irrefutably show that SARS-CoV-2 is not derived from any previously used virus backbone. Instead, there are two scenarios that can plausibly explain the origin of SARS-CoV-2: (i) natural selection in an animal host before zoonotic transfer; and (ii) natural selection in humans following zoonotic transfer.
- Natural selection in an animal host before zoonotic transfer:
As many early cases of COVID-19 were linked to the Huanan market in Wuhan, it is possible that an animal source was present at this location. Given the similarity of SARS-CoV-2 to bat SARS-CoV-like coronaviruses, it is likely that bats serve as reservoir hosts for its progenitor. Although RaTG13, sampled from a Rhinolophus affinis bat, is ~96% identical overall to SARS-CoV-2, its spike diverges in the RBD, which suggests that it may not bind efficiently to human ACE2.
Malayan pangolins (Manis javanica) illegally imported into Guangdong province contain coronaviruses similar to SARS-CoV-2. Although the RaTG13 bat virus remains the closest to SARS-CoV-2 across the genome, some pangolin coronaviruses exhibit strong similarity to SARS-CoV-2 in the RBD, including all six key RBD residues. This clearly shows that the SARS-CoV-2 spike protein optimized for binding to human-like ACE2 is the result of natural selection.
Neither the bat betacoronaviruses nor the pangolin betacoronaviruses sampled thus far have polybasic cleavage sites. Although no animal coronavirus has been identified that is sufficiently similar to have served as the direct progenitor of SARS-CoV-2, the diversity of coronaviruses in bats and other species is massively under sampled. Mutations, insertions and deletions can occur near the S1–S2 junction of coronaviruses, which shows that the polybasic cleavage site can arise by a natural evolutionary process. For a precursor virus to acquire both the polybasic cleavage site and mutations in the spike protein suitable for binding to human ACE2, an animal host would probably have to have a high population density (to allow natural selection to proceed efficiently) and an ACE2-encoding gene that is similar to the human ortholog.
- Natural selection in humans following zoonotic transfer
It is possible that a progenitor of SARS-CoV-2 jumped into humans, acquiring the genomic features described above through adaptation during undetected human-to-human transmission. Once acquired, these adaptations would enable the pandemic to take off and produce a sufficiently large cluster of cases to trigger the surveillance system that detected it.
All SARS-CoV-2 genomes sequenced so far have the genomic features described above and are thus derived from a common ancestor that had them too. The presence in pangolins of an RBD very similar to that of SARS-CoV-2 means that we can infer this was also probably in the virus that jumped to humans. This leaves the insertion of polybasic cleavage site to occur during human-to-human transmission.
Estimates of the timing of the most recent common ancestor of SARS-CoV-2 made with current sequence data point to emergence of the virus in late November 2019 to early December 2019, compatible with the earliest retrospectively confirmed cases. Hence, this scenario presumes a period of unrecognized transmission in humans between the initial zoonotic event and the acquisition of the polybasic cleavage site. Sufficient opportunity could have arisen if there had been many prior zoonotic events that produced short chains of human-to-human transmission over an extended period. This is essentially the situation for MERS-CoV, for which all human cases are the result of repeated jumps of the virus from dromedary camels, producing single infections or short transmission chains that eventually resolve, with no adaptation to sustained transmission.
Studies of banked human samples could provide information on whether such cryptic spread has occurred. Retrospective serological studies could also be informative, and a few such studies have been conducted showing low-level exposures to SARS-CoV-like coronaviruses in certain areas of China. Critically, however, these studies could not have distinguished whether exposures were due to prior infections with SARS-CoV, SARS-CoV-2 or other SARS-CoV-like coronaviruses. Further serological studies should be conducted to determine the extent of prior human exposure to SARS-CoV-2.
- Selection during passage
Basic research involving passage of bat SARS-CoV-like coronaviruses in cell culture and/or animal models has been ongoing for many years in biosafety level 2 laboratories across the world, and there are documented instances of laboratory escapes of SARS-CoV. We must therefore examine the possibility of an inadvertent laboratory release of SARS-CoV-2.
In theory, it is possible that SARS-CoV-2 acquired RBD mutations during adaptation to passage in cell culture, as has been observed in studies of SARS-CoV. The finding of SARS-CoV-like coronaviruses from pangolins with nearly identical RBDs, however, provides a much stronger and more parsimonious explanation of how SARS-CoV-2 acquired these via recombination or mutation.
The acquisition of both the polybasic cleavage site and predicted O-linked glycans also argues against culture-based scenaros. New polybasic cleavage sites have been observed only after prolonged passage of low-pathogenicity avian influenza virus in vitro or in vivo. Furthermore, a hypothetical generation of SARS-CoV-2 by cell culture or animal passage would have required prior isolation of a progenitor virus with very high genetic similarity, which has not been described. Subsequent generation of a polybasic cleavage site would have then required repeated passage in cell culture or animals with ACE2 receptors similar to those of humans, but such work has also not previously been described. Finally, the generation of the predicted O-linked glycans is also unlikely to have occurred due to cell-culture passage, as such features suggest the involvement of an immune system.
Evidence for natural evolution:
The scientists found that the RBD portion of the SARS-CoV-2 spike proteins had evolved to effectively target a molecular feature on the outside of human cells called ACE2 receptor. A bioweapon designer would want maximum impact and might rely on history to obtain it, but the novel coronavirus carries subtle flaws indicative of natural selection. For instance, coronaviruses use what are known as spike proteins to bind and access cellular “doorways” called receptors. It’s how the viruses infect animal cells. Experiments have shown that the novel coronavirus strongly binds with a human receptor called ACE2, but the interaction isn’t optimal. This isn’t what somebody who wanted to build the perfect virus would have picked. The novel coronavirus contains genetic features that suggest it encountered a living immune system rather than being cultivated in a petri dish. The evidence for natural evolution was supported by data on SARS-CoV-2’s backbone — its overall molecular structure. If someone were seeking to engineer a new coronavirus as a pathogen, they would have constructed it from the backbone of a virus known to cause illness. But the scientists found that the SARS-CoV-2 backbone differed substantially from those of already known coronaviruses and mostly resembled related viruses found in bats and pangolins. These two features of the virus, the mutations in the RBD portion of the spike protein and its distinct backbone, rules out laboratory manipulation as a potential origin for SARS-CoV-2. Overall, the analysis suggests the virus jumped from an animal to humans sometime in November.
In a nutshell:
In the midst of the global COVID-19 public-health emergency, it is reasonable to wonder why the origins of the pandemic matter. Detailed understanding of how an animal virus jumped species boundaries to infect humans so productively will help in the prevention of future zoonotic events. For example, if SARS-CoV-2 pre-adapted in another animal species, then there is the risk of future re-emergence events. In contrast, if the adaptive process occurred in humans, then even if repeated zoonotic transfers occur, they are unlikely to take off without the same series of mutations. In addition, identifying the closest viral relatives of SARS-CoV-2 circulating in animals will greatly assist studies of viral function. Indeed, the availability of the RaTG13 bat sequence helped reveal key RBD mutations and the polybasic cleavage site.
_____
Potential Factors Influencing Repeated SARS Outbreaks in China, a March 2020 study:
Within last 17 years two widespread epidemics of severe acute respiratory syndrome (SARS) occurred in China, which were caused by related coronaviruses (CoVs): SARS-CoV and SARS-CoV-2. Although the origin(s) of these viruses are still unknown and their occurrences in nature are mysterious, some general patterns of their pathogenesis and epidemics are noticeable. Both viruses utilize the same receptor—angiotensin-converting enzyme 2 (ACE2)—for invading human bodies. Both epidemics occurred in cold dry winter seasons celebrated with major holidays, and started in regions where dietary consumption of wildlife is a fashion. Thus, if bats were the natural hosts of SARS-CoVs, cold temperature and low humidity in these times might provide conducive environmental conditions for prolonged viral survival in these regions concentrated with bats. The widespread existence of these bat-carried or -released viruses might have an easier time in breaking through human defenses when harsh winter makes human bodies more vulnerable. Once succeeding in making some initial human infections, spreading of the disease was made convenient with increased social gathering and holiday travel. These natural and social factors influenced the general progression and trajectory of the SARS epidemiology.
______
Ever since the virus came to light in Wuhan in December last year, speculation has been rife on whether the viral strain originated from the Wuhan Institute of Virology (WIV) or from its nearby Huanan Seafood Market. The WIV, specifically its P4 laboratory, is equipped to handle dangerous viruses. Wuhan virology lab chief denies COVID-19 originated from institute, says virus ‘cannot be man-made’ The Director of a maximum-security laboratory in China’s coronavirus ground-zero city of Wuhan has rejected claims that it could be the source of the outbreak, calling it “impossible.” “Besides some scientists believe that to synthesize a virus requires extraordinary intelligence and workload. So never believed that we humans have the capability at this time to create such a virus,” he said.
______
______
Section-2
Mutations and strains:
_
Every time a virus self-replicates, it first needs to make a copy of its genome. The machinery it uses to make those copies, however — an enzyme called RNA polymerase — often makes errors during the copying process. The resulting copy of the virus’s genome tends to contain random typos, which we know as mutations. But not all mutations will have a meaningful effect on the virus and the course of a pandemic. Some mutations have no effect whatsoever and are known as “neutral mutations.” They can be passed along over many generations and cause no change in a virus’s ability to survive or cause infection. Most mutations are even detrimental to the virus, killing it before it has the chance to copy itself again. Some mutations do have an effect, like making a newly generated virus particle more transmissible. But for a mutation in a single particle to have an impact on the general virus population — what we might think of as a new strain — it must be passed on to future copies of the virus. And for that to happen, the mutation must also have to improve the virus’s ability to survive and replicate, a trait described as “selectively advantageous.” Complicating the matter further is the fact that the traits that we’re most concerned about — the virus’s infectiousness and ability to cause disease — are controlled by multiple genes. This means that the sheer possibility of changing these traits would take multiple random, selectively advantageous mutations, all occurring at the same time in the same virus genome. And the chances of that happening within the short timescale of an outbreak are extremely low.
As it happens, the SARS-CoV-2 virus driving the Covid-19 pandemic appears to be mutating slowly. Peter Thielen, a molecular geneticist at the Johns Hopkins University Applied Physics Laboratory who has been studying strains of the virus said there are only between four and 10 genetic differences between the strains circulating in Wuhan and the United States — a relatively small number. This slow mutation rate bodes well for vaccine development, as vaccines are created to confer immunity against specific virus strains. Since SARS-CoV-2 doesn’t seem to be mutating very much, any vaccine we create now is expected to protect people for the long term.
Of course, the possibility of dangerous mutation remains, however slim. And even if a mutation that impacts transmission or disease severity does happen, it probably wouldn’t change anything at all because by the time we can confirm what any particular mutation is doing, the pandemic will likely be over. […] There isn’t really anything that we can do except for pushing the things that we already are: social distancing, surveillance, hospital capacity, contract tracing, vaccine development, and so on.
_
RNA virus’s mutation rate is dramatically high, up to a million times higher than their hosts, and this high rate is correlated with virulence modulation and evolvability, traits considered beneficial for viral adaptation. Virus mutagenic capability depends upon several factors, including the fidelity of viral enzymes that replicate nucleic acids, as SARS-CoV-2 RNA dependent RNA Polymerase (RdRp). Mutation rate drives viral evolution and genome variability, thereby enabling viruses to escape host immunity and to develop drug resistance. Wang and coworkers have recently characterized 13 variation sites in SARS-CoV-2 ORF1ab, S, ORF3a, ORF8 and N regions, among which positions 28144 in ORF8 and 8782 in ORF1a showed a mutation rate of 30.53% and 29.47%, respectively. RNA virus mutation rate contributes to viral adaptation creating a balance between the integrity of genetic information and genome variability. Biological characterization of viral mutations can provide precious insights for assessing viral drug resistance, immune escape and pathogenesis related mechanisms. Additionally, viral mutation studies can be crucial for designing new vaccines, antiviral drugs and diagnostics assays. The viral genome mutagenic process depends on the viral enzymes that replicate the nucleic acids, influenced by few or no proofreading capability and/or post-replicative nucleic acid repair. Other mutation-generating processes include: host enzymes, spontaneous nucleic acid damages due to physical and chemical mutagens, recombination events and also particular genetic elements responsible for production of new variants. Mutation rates are modulated by other factors such as determinants of the template sequence and structure involved in viral replication. Using these little changes, researchers can draw up phylogenetic trees, much like family trees. They can also make connections between different cases of COVID-19 and gauge whether there might be undetected spread of the virus.
_
A ’strain’ is a sub-type of a virus, characterised by different cell surface proteins, eliciting a different immune response from other strains. A mutation, however, is very minor genetic errors in genome sequences made during replication that doesn’t fundamentally change the nature or behaviour of the virus. The mutations themselves are composed of changes in base pairs. There were reports earlier about how the novel coronavirus has mutated into two strains so far — the original S-type which originated in Wuhan, and the subsequent L-type that evolved from the S-type and is more prevalent in countries like the US. The L-type is the more “aggressive” one, and spreads rapidly but is no more or less virulent than the S-type. In contrast, other experts in the field say the two types the Chinese researchers claimed to have identified were a result of both normal viral mutation and errors in data that they were relying on. These aren’t really different strains of SARS CoV-2. A strain is a genetic variant characterised by different forms of surface proteins. The virus mutates so slowly that the so-called virus strains are fundamentally very similar to each other and mutations are referred as strains. The SARS-CoV-2 is so good at transmitting itself between human hosts that it is under no evolutionary pressure to evolve. I have gone through many studies showing multiple strains of SARS CoV-2 but basically they depict some mutation here and there while overall surface protein structure remains same.
____
Like all viruses, SARS-CoV-2 evolves over time through random mutations, only some of which are caught and corrected by the virus’s error correction machinery. Over the length of its 30,000-base-pair genome, SARS-CoV-2 seems to have a mutation rate of less than 25 mutations per year, whereas the seasonal flu has a mutation rate of almost 50 mutations per year. Given that the SARS-CoV-2 genome is almost twice as large as the seasonal flu genome, it seems as though the seasonal flu mutates roughly four times as fast as SARS-CoV-2. The fact that the seasonal flu mutates so quickly is precisely why it is able to evade our vaccines, so the significantly slower mutation rate of SARS-CoV-2 gives us hope for the potential development of effective long-lasting vaccines against the virus. The reason we need a new flu vaccine every year is because the influenza virus mutates fast and has a uniquely complex way of reshuffling its own genome in a process independent from mutation.
Most genomic changes don’t alter the virus’s behavior. The only way to confirm that a mutation has an effect is to study it in cell cultures or animal models and show, for instance, that it has become better at entering cells or transmitting. And if the virus does change in an important way, it could go either way, making it more or less dangerous. It might seem strange that a mutation that weakens the virus can become established when it has just entered the human population and isn’t competing with strains lacking the mutation.
_____
Just look at a snippet of the bat virus RNA nucleotide sequence the human virus was derived from…
AAAATCAAAGCTTGTGTTGAAGAAGTTACAACAACTCTGGAAGAAACTAAGTT
…and a snippet from the human COVID-19’s RNA nucleotide sequence…
AAAATTAAGGCTTGCATTGATGAGGTTACCACAACACTGGAAGAAACTAAGTT
…clearly, the coronavirus has changed its internal structure to adapt to the new species of their host (to be more precise, about 20% of the internal structure of the coronavirus was mutated), but maintained enough such that it is still true to its origin species.
Two critical mutations in the bat coronavirus set us on the path to the COVID-19 pandemic. The first modified the structure of the spike-like structures that protrude from the virus. Those protrusions give the virus its family name: “Corona” means “crown” in Latin. The altered spikes allow the virus to latch onto a protein called ACE2, which lines the respiratory tract. The related virus responsible for the SARS epidemic employs a similar infection mechanism, as does another bat coronavirus that causes common colds in humans. The second key mutation allowed the coronavirus to grow a cleavage site on spike protein responsive to protein dagger called a furin, which can slice through other proteins to make the virus bind tightly to throat and lung cells. Those mutations could have occurred while the virus was circulating in bats. It’s also possible that one or both mutations could have erupted in a person who was infected by an earlier version of the virus, but who showed no symptoms. Most likely, there was an intermediate host between bats and humans. The pangolin, a creature prized in China for its meat and for the alleged medicinal value of its scales, is a strong candidate. Epidemiologists suspect that someone bought a pangolin at one of the “wet markets” in Wuhan and got infected consuming it, setting off the chain of transmission.
____
Analysis of the mutation dynamics of SARS-CoV-2 reveals the spread history and emergence of RBD mutant with lower ACE2 binding affinity, April 2020 study:
Highlights
- Based on the currently available genome sequence data, authors proved that SARS-COV-2 genome has a much lower mutation rate and genetic diversity than SARS during the 2002-2003 outbreak.
- The spike (S) protein encoding gene of SARS-COV-2 is found relatively more conserved than other protein-encoding genes, which is a good indication for the ongoing antiviral drug and vaccine development.
- Minimum Evolution phylogeny analysis revealed the putative original status of SARS-CoV-2 and the early-stage spread history.
- Authors confirmed a previously reported rearrangement in the S protein arrangement of SARS-COV-2, and propose that this rearrangement should have occurred between human SARS-CoV and a bat SARS-CoV, at a time point much earlier before SARS-COV-2 transmission to human.
- Authors provided first evidence that a mutated SARS-COV-2 with reduced human ACE2 receptor binding affinity have emerged in India based on a sample collected on 27th January 2020.
______
Phylogenetic network analysis of SARS-CoV-2 genomes, April 2020 study:
In early March 2020, the GISAID database contained a compilation of 253 severe acute respiratory syndrome coronavirus 2 (SARS-CoV-2) complete and partial genomes contributed by clinicians and researchers from across the world since December 2019. To understand the evolution of this virus within humans, and to assist in tracing infection pathways and designing preventive strategies, authors present a phylogenetic network of 160 largely complete SARS-Cov-2 genomes as seen in the figure below:
_
Phylogenetic network of 160 SARS-CoV-2 genomes:
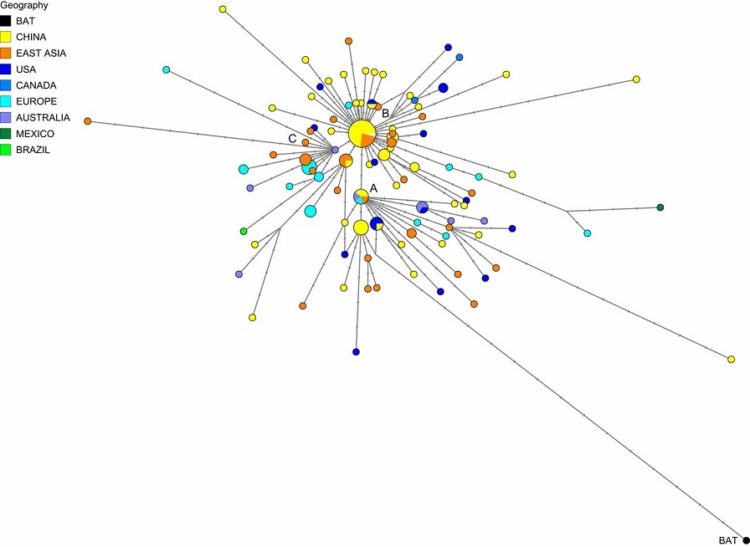
_
Researchers from Cambridge, UK, and Germany have reconstructed the early “evolutionary paths” of COVID-19 in humans — as infection spread from Wuhan out to Europe and North America — using genetic network techniques. By analyzing the first 160 complete virus genomes to be sequenced from human patients, the scientists have mapped some of the original spread of the new coronavirus through its mutations, which creates different viral lineages. “There are too many rapid mutations to neatly trace a COVID-19 family tree. We used a mathematical network algorithm to visualize all the plausible trees simultaneously,” said geneticist Dr Peter Forster, lead author from the University of Cambridge. The team used data from virus genomes sampled from across the world between 24 December 2019 and 4 March 2020. The research revealed three distinct “variants” of COVID-19, consisting of clusters of closely related lineages, which they label ‘A’, ‘B’ and ‘C’.
Forster and colleagues found that the closest type of COVID-19 to the one discovered in bats — type ‘A’, the “original human virus genome” — was present in Wuhan, but surprisingly was not the city’s predominant virus type. Mutated versions of ‘A’ were seen in Americans reported to have lived in Wuhan, and a large number of A-type viruses were found in patients from the US and Australia. Wuhan’s major virus type, ‘B’, was prevalent in patients from across East Asia. However, the variant didn’t travel much beyond the region without further mutations — implying a “founder event” in Wuhan, or “resistance” against this type of COVID-19 outside East Asia, say researchers. The ‘C’ variant is the major European type, found in early patients from France, Italy, Sweden and England. It is absent from the study’s Chinese mainland sample, but seen in Singapore, Hong Kong and South Korea. The new analysis also suggests that one of the earliest introductions of the virus into Italy came via the first documented German infection on January 27, and that another early Italian infection route was related to a “Singapore cluster.” Importantly, the researchers say that their genetic networking techniques accurately traced established infection routes: the mutations and viral lineages joined the dots between known cases. As such, the scientists argue that these “phylogenetic” methods could be applied to the very latest coronavirus genome sequencing to help predict future global hot spots of disease transmission and surge.
_
Significance:
Every genome mutates at a predictable background rate. Most mutations yield no significant effects on the biology of the organism, but the tick-tick-tick of genetic changes allow scientists to construct the order in which different strains or species diverged from each other. With that information in hand, they can then construct a phylogenetic tree—a branching diagram that depicts the evolutionary relationships. This is a phylogenetic network of SARS-CoV-2 genomes sampled from across the world. These genomes are closely related and under evolutionary selection in their human hosts, sometimes with parallel evolution events, that is, the same virus mutation emerges in two different human hosts. This makes character-based phylogenetic networks the method of choice for reconstructing their evolutionary paths and their ancestral genome in the human host.
The first use of phylogenetic techniques shows the ‘ancestral’ virus genome closest to those in bats was not Wuhan’s predominant virus type. The study charts the ‘incipient supernova’ of COVID-19 through genetic mutations as it spread from China and Asia to Australia, Europe and North America. Researchers say their methods could be used to help identify undocumented infection sources.
______
Coronavirus mutations can track its spread:
Changes in the pathogen help scientists follow cases without widespread testing. Labs around the world contribute genetic sequences of viruses collected from patients, and Nextstrain uses that data to paint the evolution of epidemics through global maps and phylogenetic charts, the family trees for viruses. So far, Nextstrain has crunched nearly 1,500 genomes from the new coronavirus, and the data already show how this virus is mutating—every 15 days, on average—as the COVID-19 pandemic rages around the world. As menacing as the word sounds, mutations don’t mean the virus is becoming more harmful. Instead, these subtle shifts in the virus’s genetic code are helping researchers quickly figure out where it’s been, as well as dispel myths about its origins.
_
Tracking cases through mutations:
Seattle-based biologist Trevor Bedford, 38, has emerged as one of the most famous epidemiologists in the world. His frequent tweets are seized upon by many of the globe’s top scientists and health policy makers. So far he has more than 170,000 Twitter followers, with thousands more joining every day. But, unlike traditional epidemiologists, this disease detective working from his lab at the Fred Hutchinson Cancer Research Center, doesn’t do field work to track down Covid-19 patients’ contacts. Instead, Bedford and a handful of colleagues — spanning the globe from Seattle to Basel, Switzerland, and Wanaka, New Zealand —analyse hundreds of virus genomes from patient samples to trace where outbreaks came from, how they spread from one corner of the Earth to the next and, most important, detecting early signs of infection clusters.
The team’s analytic approach relies on tracking how viruses mutate over time as they spread from person to person. In the case of the coronavirus, whose RNA consists of about 30,000 genetic bases or letters, it mutates about twice a month. These minor mutations tend not to change the potency of the virus. But they provide clues for genetic detectives to chart how they shift subtly over time, allowing them to create sprawling “family” trees, or phylogenies, that show how the coronavirus has spread from one part of the world or country to the next.
_
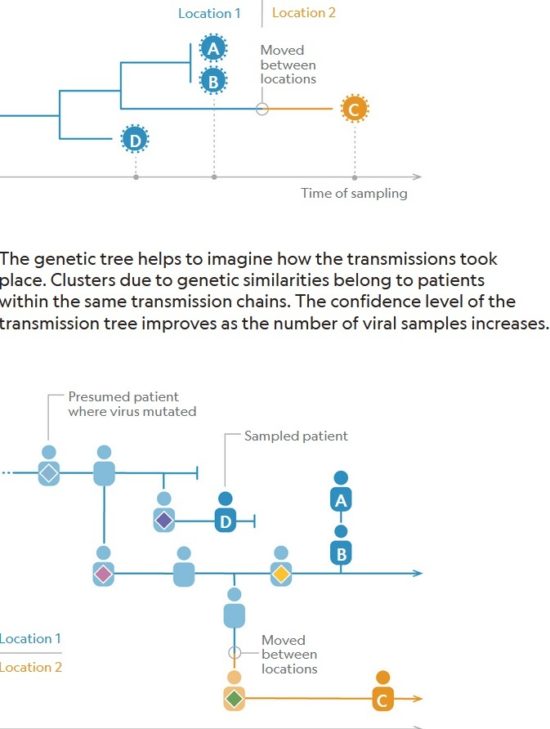
_
Bedford’s lab has been using genetics to track the new coronavirus, known as SARS-CoV-2, since the first U.S. cases started to multiply in Washington State in February and March. Back then, public health officials focused on tracking patients’ travel histories and connecting the dots back to potentially infected people they’d met along the way. Meanwhile, Bedford and his team turned to unlocking the virus’s genetic code by analyzing nasal samples collected from about two dozen patients. Their discovery was illuminating: By tracing how and where the virus had changed over time, Bedford showed that SARS-CoV-2 had been quietly incubating within the community for weeks since the first documented case in Seattle on January 21. The patient was a 35-year-old who had recently visited the outbreak’s original epicenter in Wuhan, China. In other words, Bedford had scientific proof that people could unknowingly be spreading the coronavirus if they had a mild case and didn’t seek care, or if they had been missed by traditional surveillance because they weren’t tested. That revelation has fueled the frantic lockdowns, closures, and social distancing recommendations around the world in an attempt to slow the spread.
_
When U.S. authorities thought they might have the coronavirus somewhat under control, Bedford was among the first to argue that it had already been circulating undetected in the Seattle area for weeks. Virus-genome analyses suggested to Bedford that the very first patient in Washington in January, a 35-year-old man who had recently visited Wuhan, China, somehow infected someone else, allowing the disease to spread undetected for all that time around the Seattle area. “There are some enormous implications here,” Bedford said in a nine-part Twitter thread on February 29 that has since been retweeted thousands of times. “I believe we’re facing an already substantial outbreak in Washington State that was not detected until now due to narrow case definition requiring direct travel to China.”
This genome work differs markedly from traditional epidemiology that focuses heavily on identifying infected patients and tracking all their contacts. “Instead of talking to people about who they have been in contact with and shoe-leather epidemiology, we use the genetics of pathogens to see how they are spreading and how they are transmitting around the world,” says Emma Hodcroft, a molecular epidemiologist at the University of Basel who works closely with Bedford.
_
One of his key collaborators, Richard Neher, is a computational biologist at the University of Basel. Neher says the two scientists hit upon the idea of tracking virus evolution in real time using an interactive website after meeting at a conference at the University of California Santa Barbara in 2014. Their original idea was focused on influenza evolution, with the goal of helping vaccine makers predict which strains are likely to spread around the world in the next flu season. But over time their website, Nextstrain.org, evolved to include data from multiple outbreaks including Zika, Enterovirus D68 and Ebola. When the coronavirus hit, Bedford and Neher had customized software ready to roll for rapidly analyzing hundreds of virus genomes. “We hit the ground running here because all of this basic infrastructure was in place,” Neher says.
Since then, Nextstrain has become a 24/7 operation, staffed with researchers at Bedford’s and Neher’s labs in Seattle and Basel, along with another scientist in New Zealand. With global coverage, someone is always on call to start analyzing data as soon as a new viral genome is released to gisaid.org, a website where scientists are posting the information. It takes about 20 to 30 minutes to analyze a new viral genome, allowing the website to be updated frequently.
Bedford sees his work as expanding, not replacing, the utility of existing virus-tracing methods, providing new data streams to complement traditional epidemiology. And while the evidence he gathers stops short of proving a chain of transmission, “my suspicion is almost everything we have seen in the Seattle area is part of the same transmission chain,” he says. He started analyzing coronavirus genomes from China as soon as they began to flow into public databases on January 10th. At the time, health authorities were claiming that the virus had limited ability to spread between people. But Bedford found something alarming: The viral genomes were too similar to derive from viruses from different animals infecting people on multiple occasions. Instead, the genome data suggested that someone had acquired it from a single infected animal around early December — and it had been spreading from person to person ever since. “This genomic data represented one of the first and strongest indications of sustained epidemic spread,” Bedford said in a Jan. 31 blog post. “I spent the week of Jan 20 alerting every public health official I know.”
Bedford and Neher are limited by the amount of genome data that is available. So far almost 1,000 patients have had their viral genomes analyzed, out of more than 350,000 people who have been infected. There are few virus genome sequences from New York, which has surpassed Washington as the hardest-hit state in the country. Overwhelmed testing centers often don’t have manpower to spare to do genome analysis when so many people are having trouble getting test results.
Even so, a basic picture is emerging: Most of the coronavirus clusters now spiraling out of control in Europe and the United States likely date back to community spread that had been quietly percolating for many weeks. “We were thinking ,” Neher says, “it was all in China and China’s problem, but that was not true.”
_
Although such charts and trees are useful for seeing the big picture of how the pandemic is unfolding, random visitors are cautioned against jumping to conclusions, because they can’t see the more extensive background data. Case in point: Bedford had to back-track on Twitter after suggesting that similar sequencing data from an infected German patient in Italy and a Munich patient who became infected a month earlier showed that the European outbreak had started in Germany. The tree might suggest a connection, but there are so many missing pieces in the transmission chain that there can be other explanations of what could have happened.
And in places where testing and case-based surveillance are limited, Bedford says genetic data will continue to provide clues about whether all these social distancing interventions are working.
______
______
Section-3
RAAS inhibitors beneficial or harmful?
_
The renin–angiotensin–aldosterone system (RAAS) is an elegant cascade of vasoactive peptides that orchestrate key processes in human physiology. Severe acute respiratory syndrome coronavirus (SARS-CoV) and SARS-CoV-2, which have been responsible for the SARS epidemic in 2002 to 2004 and for the more recent coronavirus disease 2019 (Covid-19) pandemic, respectively, interface with the RAAS through angiotensin-converting enzyme 2 (ACE2), an enzyme that physiologically counters RAAS activation but also functions as a receptor for both SARS viruses. The interaction between the SARS viruses and ACE2 has been proposed as a potential factor in their infectivity, and there are concerns about the use of RAAS inhibitors that may alter ACE2 and whether variation in ACE2 expression may be in part responsible for disease virulence in the ongoing Covid-19 pandemic. Indeed, some media sources and health systems have recently called for the discontinuation of ACE inhibitors and angiotensin-receptor blockers (ARBs), both prophylactically and in the context of suspected Covid-19. Given the common use of ACE inhibitors and ARBs worldwide, guidance on the use of these drugs in patients with Covid-19 is urgently needed.
______
ACE 2 receptor:
ACE2 is the SARS-CoV-2 Receptor required for Cell Entry:
The angiotensin-converting enzyme 2 is the receptor required for cellular entry of COVID-19, consistent with the epidemiologic risk for severe disease seen in patients with cardiovascular disease and hypertension in China. The COVID-19 pandemic is caused by SARS-CoV-2, which shares high amino-acid sequence homology with the SARS coronavirus that emerged in 2002. The surface unit (S1) of the spike (S) protein of SARS engages the angiotensin-converting enzyme 2 (ACE2) as the entry receptor and then uses the host serine protease TMPRSS2 for S priming, allowing fusion of viral and cellular membranes and viral entry into the cell. Researchers have now examined how the S protein from SARS-CoV-2 facilitates viral entry into target host cells and compare the process to that used by SARS.
They found that:
-The S proteins of SARS and SARS-2 mediate viral entry into a similar spectrum of cell lines.
-Like SARS, SARS-CoV-2 employs the same host-cell ACE2 as the receptor for cell entry.
-The host cell serine protease TMPRSS2 primes the S protein of SARS-CoV-2 for entry.
-The serine protease inhibitor camostat mesylate, available in Japan to treat chronic pancreatitis and reflux esophagitis, inhibits TMPRSS2 and partially blocks SARS-CoV-2 infection of lung epithelial cells.
-Antibodies against S1 from convalescent sera of SARS patients inhibited SARS-CoV-2 from infecting cultured cells.
High risk for severe COVID-19 disease has been assumed to be driven largely by waning innate immunity that comes with advanced age, but younger patients with cardiovascular disease or hypertension may have unappreciated risk.
__
Molecular Differences in the ACE2 Receptor between Human and Animal Species:
The identification of the contact residues between the receptor-binding domain of S from SARS-CoV-2 and human ACE2 allows estimation of whether SARS-CoV-2 could infect other species. To do so, authors aligned all available ACE2 amino acid sequences with human ACE2. They placed emphasis on the presence of N-glycosylation motifs near the binding site, since they might affect attachment of S. Human ACE2 is glycosylated at N53, N90, and N322. N53 is conserved in all species. N90 is not a glycosylation site in ACE2 of mouse, pig, N. procyonoides, raccoon, civet, ferret, fox, E. telfairi, and chicken. N322 is not a glycosylation site in ACE2 of mouse, rat, cattle, sheep, E. telfairi, and pangolin. However, ACE2 of some species contain an additional glycosylation motif in this region. Residue L79 is a potential N-glycosylation site in chicken and M82 is a potential glycosylation site in Rhinolophus sinicus, pangolin, and rat. Notably, glycosylation of residue 82 has been show to prevent binding of S from SARS-CoV to rat ACE2.
Some amino acids in ACE2 affect binding to S of SARS-CoV-2. The S binding site of ACE2 from macaque and chimpanzees is identical to human ACE2. ACE2 from other species revealed eleven (chicken), nine and ten (rodents), or only three (cat) amino acid differences compared with human ACE2. Of special interest are ACE2 proteins from farm animals and a pet cat, since they might become another possible reservoir for SARS-CoV-2. ACE2 from pig contains six exchanges, but they are mostly located at the periphery of the binding site. N90T causes the loss of the glycosylation site. E329 forms a salt bridge with R426 in S of SARS-CoV, but S of SARS-CoV-2 forms a salt bridge with another residue (D30) in ACE2. Thus, the exchange of E329 by N in porcine ACE2 might affect binding to S of SARS-CoV, but not to S from SARS-CoV-2. A similar pattern emerges for amino acid differences between human and cattle ACE2 and cat ACE2. The few exchanges are also located peripheral to the core of the binding region and thus their exchange might not represent a large obstacle for infection of cells from these species with SARS-CoV-2.
__
Structural variations in human ACE2 may influence its binding with SARS‐CoV‐2 spike protein:
The recent pandemic of COVID‐19, caused by SARS‐CoV‐2, is unarguably the most fearsome compared with the earlier outbreaks caused by other coronaviruses, SARS‐CoV and MERS‐CoV. Human ACE2 is now established as a receptor for the SARS‐CoV‐2 spike protein. Where variations in the viral spike protein, in turn, lead to the cross‐species transmission of the virus, genetic variations in the host receptor ACE2 may also contribute to the susceptibility and/or resistance against the viral infection. This study explored the binding of the proteins encoded by different human ACE2 allelic variants with SARS‐CoV‐2 spike protein. Most ACE2 variants showed a similar binding affinity for SARS‐CoV‐2 spike protein as observed in the complex structure of wild‐type ACE2 and SARS‐CoV‐2 spike protein. However, ACE2 alleles, rs73635825 (S19P) and rs143936283 (E329G) showed noticeable variations in their intermolecular interactions with the viral spike protein. In summary, this study data provides a structural basis of potential resistance against SARS‐CoV‐2 infection driven by ACE2 allelic variants.
______
ACE and its homologue ACE2:
Angiotensin-converting enzyme 2 (ACE2) is an enzyme attached to the outer surface (cell membranes) of cells in the lungs, arteries, heart, kidney, and intestines. ACE2 lowers blood pressure by catalysing the hydrolysis of angiotensin II (a vasoconstrictor peptide) into angiotensin (1–7) (a vasodilator). The primary function of ACE2 is to act as a counterbalance to ACE. ACE cleaves angiotensin I hormone into the vasoconstricting angiotensin II. ACE2 in turn cleaves the carboxyl-terminal amino acid phenylalanine from angiotensin II (Asp-Arg-Val-Tyr-Ile-His-Pro-Phe) and hydrolyses it into the vasodilator angiotensin (1-7), (H-Asp-Arg-Val-Tyr-Ile-His-Pro-OH).
Recent advances have improved our understanding of the renin-angiotensin system (RAS). These have included the recognition that angiotensin (Ang)-(1-7) is a biologically active product of the RAS cascade. The identification of the ACE homologue ACE2, which forms Ang-(1-7) from Ang II, and the GPCR Mas as an Ang-(1-7) receptor have provided the necessary biochemical and molecular background and tools to study the biological significance of Ang-(1-7). Most available evidence supports a counter-regulatory role for Ang-(1-7) by opposing many actions of Ang II on AT₁ receptors, especially vasoconstriction and proliferation. Many studies have now shown that Ang-(1-7) by acting via Mas receptor exerts inhibitory effects on inflammation and on vascular and cellular growth mechanisms. ACE2 primarily acts to counterbalance the effect of ACE. As ACE generates angiotensin II from angiotensin I, ACE2 generates angiotensin (1-7) from angiotensin II which, after binding to the Mas receptor broadly, shifts the balance from vasoconstriction with angiotensin II to vasodilation with Mas receptor activation in the effected vascular bed. The role these vasodilatory and anti-inflammatory effects in the pathogenesis of COVID-19 is unclear but some animal data suggest a link. ACE2 and angiotensin (1-7) have been found to be protective in a number of different lung injury models.
In an acid lung injury model in mice, ACE2 downregulation by SARS-CoV, the SARS virus responsible for the SARS outbreak in 2003, worsened lung injury that was improved by treatment with ARB. This suggested SARS-CoV exacerbates lung injury by decreasing ACE2 that is reversed by ARB treatment. These preclinical data suggest that increasing ACE2 expression can attenuate SARS-CoV-2–induced lung injury.
______
COVID-19 and Cardiovascular Injury:
Although respiratory symptoms predominate, severe cardiovascular sequelae may occur with COVID-19. A plausible port for cellular binding of SARS-CoV-2 is angiotensin converting-enzyme 2 (ACE-2), a membrane-linked aminopeptidase and receptor through which the virus can potentially attach to respiratory structures and mediate tissue injury. ACE-2 is highly expressed by type II alveolar epithelial cells in the lung and the invasion of these cells by SARS-CoV-2 is thought to provoke the respiratory symptoms. It has been suggested that using the same receptor, SARS-CoV-2 may attach and gain entry to cardiomyocytes and subsequently cause local inflammation although studies are needed to confirm that.
A meta-analysis of four studies, of which three used high-sensitivity immunoassays, demonstrated that severe COVID-19 (n=123), defined as requiring mechanical ventilation, ICU admission, or resulting in death, was associated with higher troponin levels compared to those with milder disease (standardized mean difference, 25.6 ng/L; 95% confidence interval, 6.8–44.5 ng/L). In addition, an analysis of 416 hospitalized patients with COVID-19 showed an association between cardiac injury (evident in 19.7% of patients) and higher in-hospital mortality (51.2%, 4.5%, P<0.001), although no specific data was provided on the incidence of troponin elevation among patients with non-severe disease. Another apparent cardiovascular sequela in patients with COVID-19 is heart failure. In a large cohort (n=191) from China, heart failure was reported in 44 (23%) patients and was significantly more frequent among non-survivors (52% vs 12%, p<0.0001). A smaller US study (n=21) showed similar rates of cardiomyopathy (n=7, 33%). Whether cases of cardiomyopathy result from the underlying inflammatory state, hypoxia and hemodynamic impairment, or a direct effect of COVID-19, remains unknown. Furthermore, differentiating heart failure from ARDS and frequently associated hemodynamic insults is often challenging and further studies, particularly utilizing invasive hemodynamic measurements, are needed. Cardiac arrhythmias have also been described in patients with COVID-19. In one report, 16.7% of hospitalized patients experienced an arrhythmia (of any type). The development of an arrhythmia also correlated with greater odds of an ICU stay.
Since patients with hypertension and diabetes mellitus have higher expression levels of ACE-2, and given that the same patient populations tend to have more severe COVID-19 phenotypes, it has been hypothesized that higher ACE-2 levels could potentially augment viral entry and myocardial damage.
The expression of ACE2 is substantially increased in patients with type 1 or type 2 diabetes, who are treated with ACE inhibitors and angiotensin II type-I receptor blockers (ARBs). Hypertension is also treated with ACE inhibitors and ARBs, which results in an upregulation of ACE2. ACE2 can also be increased by thiazolidinediones and ibuprofen.
All these data suggest that ACE2 expression is increased in diabetes & hypertension; and treatment with ACE inhibitors and ARBs further increases ACE2 expression. Consequently, the increased expression of ACE2 would facilitate infection with COVID-19. Researchers therefore hypothesized that diabetes and hypertension treatment with ACE2-stimulating drugs increases the risk of developing severe and fatal COVID-19. Both ACE inhibitors and angiotensin II receptor blockers (ARBs) that are used to treat high blood pressure have been shown in rodent studies to upregulate ACE2 expression hence may affect the severity of coronavirus infections. This has led some to hypothesize that decreasing the levels of ACE2, in cells, might help in fighting the infection.
_
On the other hand, ACE2 has been shown to have a protective effect against virus-induced lung injury by increasing the production of the vasodilator angiotensin 1–7. Furthermore, according to studies conducted on mice, the interaction of the spike protein of the coronavirus with ACE2 induces a drop in the levels of ACE2 in cells through internalization and degradation of the protein and hence may contribute to lung damage. ACE2 converts angiotensin II to angiotensin-(1–7), which has potentially beneficial vasodilatory and anti-inflammatory properties; upregulating ACE2 (with ACE inhibitors or ARBs) could enhance this process. An April 2020 study of patients hospitalized in Hubei Province in China found a death rate of 3.7% for hospitalized patients who had hypertension and were on Angiotensin Converting Enzyme inhibitors or Angiotensin Receptor Blockers versus 9.8% for hospitalized patients with hypertension not on such drugs, suggesting that the drugs are not harmful and may help against the coronavirus. Despite lack of conclusive evidence, some have advocated for the cessation of ACE inhibitor or ARB treatment in COVID-19 patients with hypertension. However, multiple professional societies and regulatory bodies have recommended continuing standard ACE inhibitor and ARB therapy.
_______
Despite substantial structural homology between ACE and ACE2, their enzyme active sites are distinct. As a result, ACE inhibitors in clinical use do not directly affect ACE2 activity. Experimental animal models have shown mixed findings with respect to the effects of ACE inhibitors on ACE2 levels or activity in tissue. Similarly, animal models have had inconsistent findings with respect to the effects of ARBs on ACE2, with some showing that ARBs may increase messenger RNA expression or protein levels of ACE2 in tissue and others showing no effect.
In contrast to available animal models, there are few studies in humans regarding the effects of RAAS inhibition on ACE2 expression. In one study, the intravenous administration of ACE inhibitors in patients with coronary artery disease did not influence angiotensin-(1–7) production, a finding that calls into question whether ACE inhibitors have any direct effects on ACE2-directed angiotensin II metabolism. Similarly, in another study, among patients with hypertension, angiotensin-(1–7) levels appeared to be unaffected after initial treatment with the ACE inhibitor captopril; however, with exposure to captopril monotherapy over a period of 6 months, angiotensin-(1–7) levels increased. Furthermore, few studies have examined plasma ACE2 activity or urinary ACE2 levels in patients who have received long-term treatment with RAAS inhibitors. In cross-sectional studies involving patients with heart failure, atrial fibrillation, aortic stenosis, and coronary artery disease, plasma ACE2 activity was not higher among patients who were taking ACE inhibitors or ARBs than among untreated patients. In a longitudinal cohort study involving Japanese patients with hypertension, urinary ACE2 levels were higher among patients who received long-term treatment with the ARB olmesartan than among untreated control patients, but that association was not observed with the ACE inhibitor enalapril or with other ARBs (losartan, candesartan, valsartan, and telmisartan). Previous treatment with ACE inhibitors was associated with increased intestinal messenger RNA levels of ACE2 in one study, but that association was not observed with ARBs; data are lacking regarding the effects of RAAS inhibitors on lung-specific expression of ACE2.
These seemingly conflicting data indicate the complexity underlying RAAS responses to pathway modulators and reinforce the concept that findings from preclinical models may not readily translate to human physiology. Such data do suggest that effects on ACE2 should not be assumed to be uniform across RAAS inhibitors or even in response to therapies within a given drug class. It is important to note that the plasma ACE2 level may not be a reliable indicator of the activity of the full-length membrane-bound form, in part because ACE2 is shed from the membrane, a process that appears to be separately regulated by an endogenous inhibitor. In addition to the degree of expression, the biologic relevance of ACE2 may vary according to tissue and clinical state. Unfortunately, data showing the effects of ACE inhibitors, ARBs, and other RAAS inhibitors on lung-specific expression of ACE2 in experimental animal models and in humans are lacking. Furthermore, even if RAAS inhibitors modify ACE2 levels or activity (or both) in target tissue beds, clinical data are lacking to indicate whether this would in turn facilitate greater engagement and entry of SARS-CoV-2 spike protein. Further mechanistic studies in humans are needed to better define the unique interplay between SARS-CoV-2 and the RAAS network.
Levels of ACE2 are a double-edged sword. On one hand, the increased expression of ACE2 may facilitate infection with COVID-19 and increase the risk of developing severe and fatal COVID-19. On the other hand, decreased expression of ACE2 can induce pulmonary edema and reduce lung function, which can be reversed by recombinant ACE2 or losartan; therefore, increased expression of ACE2 appears to be protective against acute lung injury. Currently, almost all major societies recommend that patients with hypertension do not discontinue using ACEIs, ARBs, or other renin-angiotensin-aldosterone antagonists in this setting except for clinical reasons rather than COVID-19.
______
Despite the lack of evidence, there have been advocates for both the use and cessation of ACEIs, ARBs, or both during the treatment for COVID-19 in patients with hypertension. This has prompted some individuals to solicit changes in their hypertensive medications and growing uncertainty from physicians on what should be done. Changes in antihypertensive medications would require patients to visit their pharmacy which would increase their exposure and risk of infection. Antihypertensive medication changes between classes additionally require frequent dose adjustment and management of adverse effects and increases the risk of medical errors.
Despite theoretical uncertainties regarding whether pharmacologic regulation of ACE2 may influence the infectivity of SARS-CoV-2, there is clear potential for harm related to the withdrawal of RAAS inhibitors in patients in otherwise stable condition. Covid-19 is particularly severe in patients with underlying cardiovascular diseases, and in many of these patients, active myocardial injury, myocardial stress, and cardiomyopathy develop during the course of illness. RAAS inhibitors have established benefits in protecting the kidney and myocardium, and their withdrawal may risk clinical decompensation in high-risk patients.
In response, the Council on Hypertension of the European Society of Cardiology made the following statement, “The Council on Hypertension strongly recommends that physicians and patients should continue treatment with their usual anti-hypertensive therapy because there is no clinical or scientific evidence to suggest that treatment with ACEIs or ARBs should be discontinued because of the COVID-19 infection.” This statement has been followed by similar statements from a number of different societies suggesting patients continue their current hypertensive medication regimen. On March 17, 2020, the American Heart Association, the Heart Failure Society of America, and the American College of Cardiology put out a joint statement advocating for patients to continue ACEIs and ARBs as prescribed and that changes in medications in the setting of COVID-19 should be completed only after careful assessment.
_____
No evidence of harm with continued use of ACE inhibitors and ARBs:
Three articles now published provide data about whether ACE inhibitors and ARBs are indeed harmful in the context of the Covid-19 epidemic. All are observational studies with the looming possibility of confounding, but each has unique strengths, and their message is consistent — none of the three studies showed evidence of harm with continued use of ACE inhibitors and ARBs.
- Mehra et al. conducted a database study involving patients who had been hospitalized in 11 countries on three continents. The study included 8910 patients who had received a diagnosis of Covid-19, who had been admitted to the hospital between December 20, 2019, and March 15, 2020, and who had either died in the hospital or survived to hospital discharge. In multivariate logistic-regression analysis, an age greater than 65 years, coronary artery disease, congestive heart failure, history of cardiac arrhythmia, chronic obstructive pulmonary disease, and current smoking were associated with an increased risk of in-hospital death. Female sex was associated with a decreased risk. Neither ACE inhibitors nor ARBs were associated with an increased risk of in-hospital death. A secondary analysis that was restricted to patients with hypertension (those for whom an ACE inhibitor or ARB would be indicated) also did not show harm.
- Mancia et al. conducted a case–control study involving patients with confirmed Covid-19 in the Lombardy region of Italy, which has been severely affected by the pandemic. In this analysis, 6272 people with confirmed SARS-CoV-2 infection that had been diagnosed between February 21 and March 11, 2020, were compared with 30,759 controls who were matched according to age, sex, and municipality of residence. In a conditional logistic-regression multivariate analysis, neither ACE inhibitors nor ARBs were associated with the likelihood of SARS-CoV-2 infection. An additional analysis comparing patients with severe or fatal infections with matched controls also did not show an association between these drugs and severe Covid-19.
- Reynolds et al. conducted a study based on data from the electronic health records of 12,594 patients in the New York University (NYU) Langone Health system who were tested for Covid-19 between March 1 and April 15, 2020. A total of 5894 patients had a positive test, among whom 1002 had severe illness (defined as admission to the intensive care unit, mechanical ventilation, or death). Propensity-score matching was performed among all tested patients and among patients with hypertension (to assess whether the likelihood of a positive test result was associated with each of several antihypertensive drug classes), as well as among Covid-19–positive patients and all such patients with hypertension (to assess whether the likelihood of severe illness among those with a positive test was associated with the same drug classes). The investigators’ Bayesian analysis showed no positive association for any of the analyzed drug classes, including ACE inhibitors and ARBs, for either a positive test result or severe illness.
Taken together, these three studies do not provide evidence to support the hypothesis that ACE inhibitor or ARB use is associated with the risk of SARS-CoV-2 infection, the risk of severe Covid-19 among those infected, or the risk of in-hospital death among those with a positive test.
_____
Potential for benefit rather than harm of RAAS Blockers in Covid-19:
SARS-CoV-2 appears not only to gain initial entry through ACE2 but also to subsequently down-regulate ACE2 expression such that the enzyme is unable to exert protective effects in organs. It has been postulated but unproven that unabated angiotensin II activity may be in part responsible for organ injury in Covid-19. After the initial engagement of SARS-CoV-2 spike protein, there is subsequent down-regulation of ACE2 abundance on cell surfaces. Continued viral infection and replication contribute to reduced membrane ACE2 expression, at least in vitro in cultured cells. Down-regulation of ACE2 activity in the lungs facilitates the initial neutrophil infiltration in response to bacterial endotoxin and may result in unopposed angiotensin II accumulation and local RAAS activation. Indeed, in experimental mouse models, exposure to SARS-CoV-1 spike protein induced acute lung injury, which is limited by RAAS blockade. Other mouse models have suggested that dysregulation of ACE2 may mediate acute lung injury that is secondary to virulent strains of influenza and respiratory syncytial virus. In a small study, patients with Covid-19 appeared to have elevated levels of plasma angiotensin II, which were in turn correlated with total viral load and degree of lung injury. Restoration of ACE2 through the administration of recombinant ACE2 appeared to reverse this devastating lung-injury process in preclinical models of other viral infections and safely reduced angiotensin II levels in a phase 2 trial evaluating acute respiratory distress syndrome in humans.
Dysregulated ACE2 may theoretically also attenuate cardioprotection in the context of myocardial involvement and abnormal pulmonary hemodynamics in Covid-19. Markers of myocardial injury have been shown to be elevated during the disease course of Covid-19 and to increase rapidly with clinical deterioration and preceding death. Many viruses are cardiotropic, and subclinical viral myocarditis is commonly seen in viremia associated with a wide range of infectious agents. ACE2 has a well-recognized role in myocardial recovery and injury response; in one study, ACE2 knockout in animal models contributed to adverse left ventricular remodeling in response to acute injury driven by angiotensin II. In autopsies of patients who died from SARS, 35% of heart samples showed the presence of viral RNA, which in turn was associated with reduced ACE2 protein expression. Administration of recombinant ACE2 normalizes angiotensin II levels in human explanted hearts with dilated cardiomyopathy. These hypotheses have prompted trials to test whether the provision of recombinant ACE2 protein may be beneficial in restoring balance to the RAAS network and potentially preventing organ injury. In addition, paired trials of losartan as a treatment for Covid-19 are being conducted among patients who have not previously received treatment with a RAAS inhibitor and are either hospitalized or not hospitalized.
_
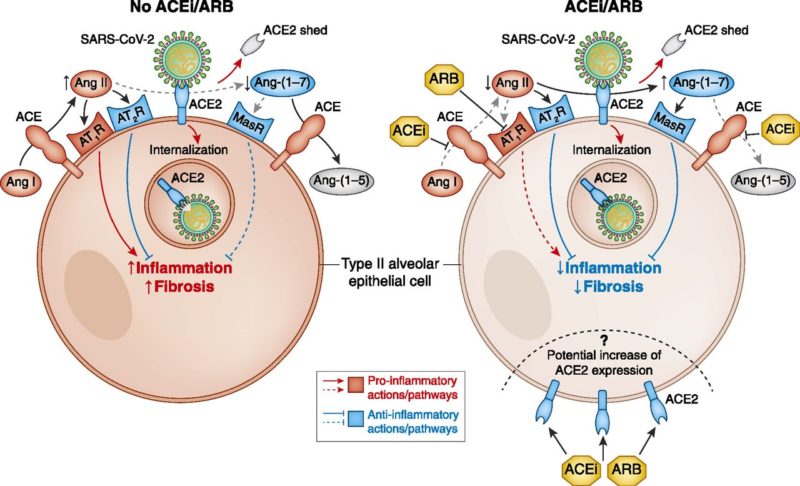
Figure above shows potential effect of angiotensin-converting enzyme inhibitors (ACEis) and angiotensin receptor blockers (ARBs) on severe acute respiratory syndrome coronavirus 2 (SARS-CoV-2)–induced alterations to renin-angiotensin system pathways. SARS-CoV-2 binds to angiotensin-converting enzyme 2 (ACE2) via its spike protein and induces internalization and shedding of ACE2, leading to increased angiotensin II (Ang II) and decreased angiotensin (1–7) [Ang-(1–7)] with net increase in inflammation and fibrosis (red) relative to anti-inflammatory and antifibrotic actions (blue). In the left panel, there is no ACEi or ARB; in the right panel, ACEi and/or ARB treatment could diminish effects of Ang II and increase Ang-(1–7) effects, leading to attenuated inflammation and fibrosis. The dashed inset in the right panel represents a theoretical increase in cell membrane expression of ACE2 with ACEi and/or ARB use. AT1R, type 1 angiotensin receptor; AT2R, type 2 angiotensin receptor; MasR, Mas receptor.
The complex relationship between viral protein binding to ACE2, RAS components, and viral pathogenicity is not fully understood as seen in the figure above. Evidence also supports the possibility that ACEis and/or ARBs could reduce the severity of COVID-19 infection. It is also not clear if ARBs could exert preferential effects over ACEis. These questions require more rigorous studies. Severe acute respiratory distress syndrome infection is associated with decreased ACE2 expression in rodent models, and treatment with losartan reduces lung injury.
_____
Association of Inpatient Use of Angiotensin Converting Enzyme Inhibitors and Angiotensin II Receptor Blockers with Mortality Among Patients With Hypertension Hospitalized With COVID-19, April 2020 study:
Rationale:
Use of angiotensin-converting enzyme inhibitors (ACEIs) and angiotensin II receptor blockers (ARBs) is a major concern for clinicians treating coronavirus disease 2019 (COVID-19) in patients with hypertension.
Objective:
To determine the association between in-hospital use of ACEI/ARB and all-cause mortality in COVID-19 patients with hypertension.
Methods and Results:
This retrospective, multi-center study included 1128 adult patients with hypertension diagnosed with COVID-19, including 188 taking ACEI/ARB (ACEI/ARB group; median age 64 [IQR 55-68] years; 53.2% men) and 940 without using ACEI/ARB (non-ACEI/ARB group; median age 64 [IQR 57-69]; 53.5% men), who were admitted to nine hospitals in Hubei Province, China from December 31, 2019 to February 20, 2020. Unadjusted mortality rate was lower in the ACEI/ARB group versus the non-ACEI/ARB group (3.7% vs. 9.8%; P = 0.01). In mixed-effect Cox model treating site as a random effect, after adjusting for age, gender, comorbidities, and in-hospital medications, the detected risk for all-cause mortality was lower in the ACEI/ARB group versus the non-ACEI/ARB group (adjusted HR, 0.42; 95% CI, 0.19-0.92; P =0.03). In a propensity score-matched analysis followed by adjusting imbalanced variables in mixed-effect Cox model, the results consistently demonstrated lower risk of COVID-19 mortality in patients who received ACEI/ARB versus those who did not receive ACEI/ARB (adjusted HR, 0.37; 95% CI, 0.15-0.89; P = 0.03). Further subgroup propensity score-matched analysis indicated that, compared to use of other antihypertensive drugs, ACEI/ARB was also associated with decreased mortality (adjusted HR, 0.30; 95%CI, 0.12-0.70; P = 0.01) in COVID-19 patients with hypertension.
Conclusions:
Among hospitalized COVID-19 patients with hypertension, inpatient use of ACEI/ARB was associated with lower risk of all-cause mortality compared with ACEI/ARB non-users. While study interpretation needs to consider the potential for residual confounders, it is unlikely that in-hospital use of ACEI/ARB was associated with an increased mortality risk.
______
Angiotensin receptor blockers as tentative SARS‐CoV‐2 therapeutics, March 2020:
Angiotensin‐converting enzyme (ACE) and its close homologue ACE2, while both belonging to the ACE family of dipeptidyl carboxydipeptidases, serve two opposing physiological functions. ACE cleaves angiotensin I to generate angiotensin II, the peptide which binds to and activates AT1R to constrict blood vessels, thereby elevating blood pressure. By contract, ACE2 inactivates angiotensin II while generating angiotensin 1–7, a heptapeptide having a potent vasodilator function via activation of its Mas receptor, and thus serving as a negative regulator of the renin–angiotensin system.
The AT1R antagonists losartan and olmesartan, commonly applied for reducing blood pressure in hypertensive patients, were shown to increase cardiac ACE2 expression about three‐fold following chronic treatment (28 days) after myocardial infarction induced by coronary artery ligation of rats (Ishiyama et al., 2004). Losartan was also shown to upregulate renal ACE2 expression in chronically treated rats (Klimas et al., 2015). In agreement with these observations, higher urinary ACE2 levels were observed in hypertensive patients treated with the AT1R antagonist olmesartan (Furuhashi et al., 2015). Taken together, these observations suggest that chronic AT1R blockade results in ACE2 upregulation in both rats and humans.
As described above, ACE2 is the common binding site for both the SARS‐CoV of the 2002–2003 SARS epidemic and also the SARS‐CoV‐2 strain underlying the current COVID‐19 epidemic. Hence, the suggestion to treat SARS patients with AT1R antagonists for increasing their ACE2 expression seems counter‐intuitive. However, several observations from studies on SARS‐CoV, which very likely are relevant also for SARS‐CoV‐2, seem to suggest otherwise. It has been demonstrated that the binding of the coronavirus spike protein to ACE2, its cellular binding site, leads to ACE2 downregulation, which in turn results in excessive production of angiotensin by the related enzyme ACE, while less ACE2 is capable of converting it to the vasodilator heptapeptide angiotensin 1–7. This in turn contributes to lung injury, as angiotensin‐stimulated AT1R results in increased pulmonary vascular permeability, thereby mediating increased lung pathology. Therefore, higher ACE2 expression following chronically medicating SARS‐CoV‐2 infected patients with AT1R blockers, while seemingly paradoxical, may protect them against acute lung injury rather than putting them at higher risk to develop SARS. This may be accounted for by two complementary mechanisms: blocking the excessive angiotensin‐mediated AT1R activation caused by the viral infection, as well as upregulating ACE2, thereby reducing angiotensin production by ACE and increasing the production of the vasodilator angiotensin 1–7. These aspects on the role of dysregulated ACE2 in SARS‐CoV pathogenesis are reviewed in detail by de Wit et al., 2016. Incidentally, following the SARS‐CoV epidemic of 2002–2003, ACE2 inhibitors were suggested as SARS therapeutics (Huentelman et al., 2004; Turner et al., 2004); however, this proposal has not led to new drugs.
Incidentally, in the context of the human immunodeficiency viruses (HIV), it has been demonstrated that higher expression levels of the HIV binding sites CCR5 and CD4 protect from, rather than increase, HIV virulence. Michel et al. reported that HIV employs its early gene Nef product for avoiding superinfection during the viral‐entry step by downregulating CCR5. This Nef‐mediated downregulation enhances the endocytosis rate of both CCR5 and CD4, which in turn facilitates efficient replication and spread of HIV, thereby promoting AIDS pathogenesis (Michel, Allespach, Venzke, Fackfmicheller, & Keppler, 2005). It remains to be studied if a comparable mechanism for avoiding superinfection has evolved in coronaviruses; in which case, the suggestion of applying AT1R blockers as SARS therapeutics, even that they upregulate the expression of the ACE2 virus binding site, will not seem paradoxical.
Losartan, telmisartan, olmesartan (and additional AT1R antagonists) are widely applied in the clinic since the 1990s for control of hypertension and kidney disorders, and are known as safe drugs that are rarely implicated in adverse drugs events. However, it should be noted that around half of SARS‐CoV patients developed hypotension during their hospitalization (Yu et al., 2006). At present we have no comprehensive information available on hypotension rates among hospitalized SARS‐CoV‐2 patients; it is thus premature to estimate what percentage of SARS patients of the currently ongoing epidemic can be safely treated with AT1R blockers without risking exacerbated hypotension.
________
________
Section-4
Viral load and viral shedding:
_
What is an ‘infectious dose’?
The infectious dose is the amount of virus needed to establish an infection. Viruses with low infectious doses are especially contagious in populations without significant immunity. The minimum infectious dose of SARS-CoV-2, the virus that causes Covid-19, is unknown so far, but researchers suspect it is low. The virus is spread through very, very casual interpersonal contact. COVID-19 is clearly very contagious, but this may be because few particles are needed for infection (the infectious dose is low), or because infected people release a lot of virus in their environment. The infectious dose for the influenza A variant, Influenza A2, is greater than 790 organisms via the nasopharyngeal route.
When infectious dose reaches our respiratory tract, one or two cells will be infected and will be re-programmed to produce many new viruses within 12-24 hours (for COVID-19, we don’t yet know how many or over how long). The new viruses will infect many more nearby cells (which can include cells of our immune defence system too, possibly compromising it) and the whole process goes around again, and again, and again. At some time quite early in infection, our ‘innate immune system’ detects there’s a virus infection and mounts an innate immune response. This response serves two purposes: to slow down the replication and spread of the virus, and to call-up and commission the ‘acquired immune response’ which will stop and finally clear the infection, as well as laying-down immune memory to allow a faster response if we are infected again in the future (this is the basis of the expected immunity in survivors and of vaccination). With COVID-19, these two arms of the immune system (innate and acquired) obviously work well for the majority of the population who recover from more or less mild influenza-like illness.
_
What is the ‘viral load’?
Viral load refers to the number of viral particles that an individual is carrying (and shedding into the environment). Essentially, the more a virus has multiplied inside the body, the higher the viral load is. It is the amount of virus present once a person has been infected and the virus has had time to replicate in their cells. With most viruses, higher viral loads are associated with worse outcomes. Viral load is often expressed as viral particles, or infectious particles per mL depending on the type of assay. A higher viral burden, titre, or viral load often correlates with the severity of an active viral infection. The quantity of virus / mL can be calculated by estimating the live amount of virus in an involved fluid. For example, it can be given in RNA copies per millilitre of blood plasma.
The viral load is also the amount of a specific virus in a test sample taken from a patient. For COVID-19, that means how many viral genomes are detected in a nasopharyngeal swab from the patient. The viral load reflects how well a virus is replicating in an infected person. A high viral load for SARS-CoV2 detected in a patient swab means a large number of coronavirus particles are present in the patient.
_
Is a high viral load linked to higher risk of severe pneumonia or death?
If you have a high viral load, you are more likely to infect other people, because you may be shedding more virus particles. However, in the case of covid-19, it doesn’t necessarily follow that a higher viral load will lead to more severe symptoms.
For instance, health workers investigating the covid-19 outbreak in the Lombardy region of Italy looked at more than 5,000 infected people and found no difference in viral load between those with symptoms and those without. They reached this conclusion after tracing people who had been in contact with someone known to be infected with the coronavirus and testing them to see if they were also infected.
Similarly, when doctors at the Guangzhou Eighth People’s Hospital in China took repeated throat swabs from 94 covid-19 patients, starting on the day they became ill and finishing when they cleared the virus, they found no obvious difference in viral load between milder cases and those who developed more severe symptoms.
Although it is difficult to draw firm conclusions at this stage, such studies may impact our assumptions about whether a high number of viral particles predisposes to a more serious disease.
In the case of the original SARS or influenza, whether a person develops mild symptoms or pneumonia depends not only on how much virus is in their lungs, but also on their immune response and their overall health. Right now it is unclear whether the SARS-CoV-2 viral load can tell us who will get severe pneumonia. Two studies in The Lancet reported people who develop more severe pneumonia tend to have, on average, higher viral loads when they are first admitted to the hospital. These studies also reported that the viral loads remain higher for more days in patients with more severe disease. However, the difference was not dramatic, and people with similar viral loads went on to develop both mild and severe disease.
_
Another common question is whether getting a higher initial virus dose upon infection – for example, through prolonged exposure to an infected person, like health care workers’ experience – will result in more severe disease. A 2015 study from the US showed that the higher the initial dose of influenza virus given to healthy volunteers, the worse their symptoms. Viruses are tiny particles that must get into our cells in order to replicate, so the logic is that the more starting virus particles there are, the more cells will be infected. However, viruses replicate exponentially. A single infected cell can produce hundreds, if not thousands, of copies of the particle. This means that for some viruses, even a tiny dose of virus is enough to cause an infection. Is the initial dose of SARS-CoV-2 (the virus that causes COVID-19) related to the disease severity? At the moment, we just don’t know. The only way to answer this question definitively is with “experimental challenge studies”, which involves intentionally infecting healthy volunteers in order to study diseases and their treatments. These would be ethically questionable because of the potential severity of the disease. On the basis of previous work on SARS and MERS coronaviruses, we know that exposure to higher doses are associated with a worse outcome and this may be likely in the case of Covid-19 as well. This means that health care workers that care for Covid-19 patients are at a particularly high risk as they are more likely to be exposed to a higher number of viral particles, particularly when there is a lack of personal protective equipment (PPE).
In a 2004 study of the coronavirus that causes SARS, a cousin of the one that causes COVID-19, a team from Hong Kong found that a higher initial load of virus—measured in the nasopharynx, it was correlated with a more severe respiratory illness. Nearly all the SARS patients who came in initially with a low or undetectable level of virus in the nasopharynx were found at a two-month follow-up to be still alive. Those with the highest level had a twenty- to forty-per-cent mortality rate. This pattern held true regardless of a patient’s age, underlying conditions, and the like.
In ongoing studies with macaques, researchers are investigating the relationship between the initial dose of the SARS-CoV-2 viral inoculum and the amount of virus in lung secretions at a later time, and there may be a correlation. If we extended this logic to humans, we would expect a similar relationship. And, logically, the larger amount of virus should trigger more severe disease by prompting a brisker inflammatory response. But that is still speculative. The relationship between initial viral dose and severity remains to be seen.
_
Why is it hard to answer basic questions about virus amounts for SARS-CoV-2?
Normally, researchers like us determine the characteristics of a virus from a combination of highly controlled experimental studies in animal models and epidemiological observations from patients. But since SARS-CoV-2 is a new virus, the research community is only just beginning to do controlled experiments. Therefore, all the information we have comes from observing patients who were all infected in different ways, have different underlying health conditions, and are of different ages and both sexes. This diversity makes it difficult to make strong conclusions that will apply to everyone from only observational data.
_
What is the duration of SARS-CoV-2 virus shedding in bodily fluids of symptomatic patients after remission of symptoms?
SARS-CoV-2 virus can initially be detected 1–2 days prior to symptom onset in upper respiratory tract samples; the virus can persist for 7–12 days in moderate cases and up to 2 weeks in severe cases (WHO mission to China Report). In faeces, viral RNA has been detected in up to 30% of patients from day 5 after onset and up to 4 to 5 weeks in moderate cases. The significance of faecal viral shedding for transmission still has to be clarified.
Prolonged viral shedding from nasopharyngeal aspirates – up to at least 24 days after symptom onset – was reported among COVID-19 patients in Singapore. Researchers from Germany also reported prolonged viral shedding with high sputum viral load after recovery in a convalescent patient. They acknowledge, however, that viability of SARS-CoV-2 detected by RT-PCR in this patient has not been proven by viral culture. Prolonged virus shedding has been observed among convalescent children after mild infections, in respiratory tract samples (22 days) and faeces (between two weeks and more than one month).
_
What is the duration of SARS-CoV-2 virus shedding in bodily fluids of asymptomatic patients?
The virus has been detected in asymptomatic persons. Pan et al. report on a family cluster where a mother and a child were both asymptomatic but had positive RT-PCR results. Hoehl et al. (2020) also report that two out of 114 Germans who were evacuated from Hubei province on 1 Feb 2020 tested positive in two throat swab specimens by RT-PCR and presented no symptoms. The two persons were isolated in a hospital in Frankfurt where a faint rash and minimal pharyngitis was observed in one of them. Both patients were still well and afebrile 7 days after admission. Potential infectivity was confirmed by virus culture.
Zou et al. 2020 report that the viral load of asymptomatic patients was similar to symptomatic patients, indicating a transmission potential of asymptomatic or pre-symptomatic patients. The study reports that patients with few or no symptoms had modest levels of detectable viral RNA in the oropharynx for at least 5 days.
Potential transmission from asymptomatic persons has been reported. Bai et al. 2020 report a familial cluster of five COVID-19 patients hospitalised with fever and respiratory symptoms that had contact before onset of symptoms with an asymptomatic family member, a young 20-year-old woman, after her return from Wuhan. She remained asymptomatic for the entire duration of laboratory and clinical monitoring (19 days).
_
Significance of persistence of viral RNA vs. infectious virus?
Viral RNA can persist over long periods of time in bodily fluids. This does not necessarily mean that the person is still infectious. RT-PCR detects viral RNA but cannot determine viability of virus. Isolation of viruses in virus culture is needed to show the infectivity of the virus. Hoehl et al. 2020 reported infectious virus from two asymptomatic cases.
______
Timing of viral shedding & transmissibility: Reporting in Nature Medicine:
Researchers in China examined viral load data on some 90 COVID-19 patients, as well data on the timing of transmission among nearly 80 transmission pairs (that is, one person likely infected the other). Combining these data — and assuming an incubation period of 5.2 days — the researchers conclude that infectiousness began 2.3 days before symptom onset and peaked 0.7 days before symptoms began. They also estimate that presymptomatic transmission accounted for 44% of secondary cases among the transmission pairs; and Infectiousness was estimated to decline relatively quickly within 7 days of illness onset.
_____
Clinical course and risk factors for mortality of adult, March 2020 study:
Background:
Since December, 2019, Wuhan, China, has experienced an outbreak of coronavirus disease 2019 (COVID-19), caused by the severe acute respiratory syndrome coronavirus 2 (SARS-CoV-2). Epidemiological and clinical characteristics of patients with COVID-19 have been reported but risk factors for mortality and a detailed clinical course of illness, including viral shedding, have not been well described.
Methods:
In this retrospective, multicenter cohort study, authors included all adult inpatients (≥18 years old) with laboratory confirmed COVID-19 from Jinyintan Hospital and Wuhan Pulmonary Hospital (Wuhan, China) who had been discharged or had died by Jan 31, 2020. Demographic, clinical, treatment, and laboratory data, including serial samples for viral RNA detection, were extracted from electronic medical records and compared between survivors and non-survivors. They used univariable and multivariable logistic regression methods to explore the risk factors associated with in-hospital death.
Findings:
191 patients (135 from Jinyintan Hospital and 56 from Wuhan Pulmonary Hospital) were included in this study, of whom 137 were discharged and 54 died in hospital. 91 (48%) patients had a comorbidity, with hypertension being the most common (58 [30%] patients), followed by diabetes (36 [19%] patients) and coronary heart disease (15 [8%] patients). Multivariable regression showed increasing odds of in-hospital death associated with older age (odds ratio 1·10, 95% CI 1·03–1·17, per year increase; p=0·0043), higher Sequential Organ Failure Assessment (SOFA) score (5·65, 2·61–12·23; p<0·0001), and d-dimer greater than 1 µg/L (18·42, 2·64–128·55; p=0·0033) on admission. Median duration of viral shedding was 20·0 days (IQR 17·0–24·0) in survivors, but SARS-CoV-2 was detectable until death in non-survivors. The longest observed duration of viral shedding in survivors was 37 days.
Interpretation:
The potential risk factors of older age, high SOFA score, and d-dimer greater than 1 µg/L could help clinicians to identify patients with poor prognosis at an early stage. Prolonged viral shedding provides the rationale for a strategy of isolation of infected patients and optimal antiviral interventions in the future.
Viral shedding:
For survivors, the median duration of viral shedding was 20days (IQR 17–24) from illness onset, but the virus was continuously detectable until death in nonsurvivors (see figure below). The shortest observed duration of viral shedding among survivors was 8 days, whereas the longest was 37 days.
_
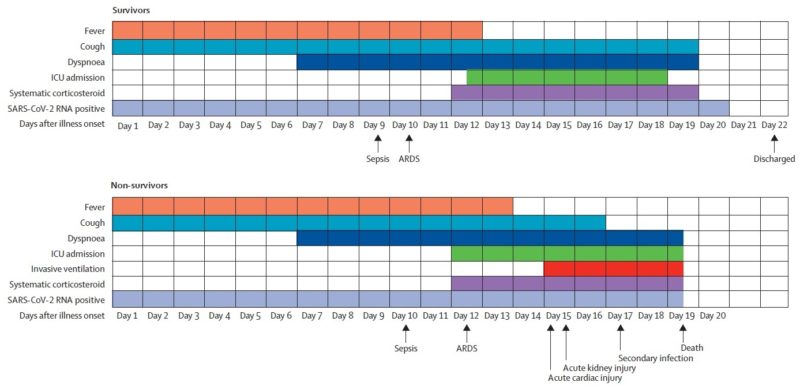
Figure above shows clinical courses of major symptoms and outcomes and duration of viral shedding from illness onset in patients hospitalised with COVID-19. Figure shows median duration of symptoms and onset of complications and outcomes. ICU=intensive care unit. SARS-CoV-2=severe acute respiratory syndrome coronavirus 2. ARDS=acute respiratory distress syndrome. COVID-19=coronavirus disease 2019.
____
Patients with severe COVID-19 shed virus longer and in higher copy numbers:
- Chinese researchers measured SARS-CoV-2 RNA in serial samples (1846 respiratory, 842 stool, 629 serum) from 96 patients (median age, 55 years) admitted for COVID-19 between January 19 and February 15, 2020. Twenty-two patients had mild disease, and 74 had severe disease (30 of the 74 were critically ill). Respiratory samples were positive in 95% of patients in the first week after symptom onset and 54% in the fourth week and were negative thereafter in all patients. Patients with mild disease had positive respiratory samples for a median of 14 days, with highest copy numbers in the first and second weeks after symptom onset, whereas patients with severe disease shed virus for a median of 21 days, with high viral titers through the third and fourth weeks. Viral copy numbers in stool or serum were lower, detectable for 22 and 16 days, respectively, and unrelated to disease severity. Among patients with severe disease, male sex, age greater than 60, and treatment with corticosteroids for more than 10 days were associated with longer viral shedding.
- French researchers subjected 183 respiratory specimens collected from 155 patients between February 27 and March 12, 2020, to viral culture on Vero cells and to quantitative reverse transcription polymerase chain reaction (RT-PCR); 129 samples contained infectious virus. All PCR-positive samples with cycle threshold (Ct) values between 13 and 17 were also culture-positive. Rates of positive cultures from specimens with higher Ct values (i.e., lower viral RNA concentrations) decreased progressively to 12.5% at a Ct of 33. None of seven samples with Ct of 34 or higher was culture-positive.
SARS-CoV-2 shedding appears to last longer in patients with severe disease, in those with corticosteroid treatment, in older individuals, and in men. Furthermore, quantitative RT-PCR and infectivity seem to be closely linked. This information is of value when considering discontinuation of isolation in patients recovering from COVID-19.
_______
_______
Section-5
Droplet or airborne (aerosol) mode of transmission?
_
Like the flu, COVID-19 is spread primarily via respiratory droplets—little blobs of liquid released as someone coughs, sneezes, or talks. Viruses contained in these droplets can infect other people via the eyes, nose, or mouth—either when they land directly on somebody’s face or when they’re transferred there by people touching their face with contaminated hands. Because respiratory droplets are too heavy to remain suspended in the air, direct person-to-person transmission normally only happens when people are in close contact—within about six feet of each other, according to the US Centers for Disease Control and Prevention (CDC). It could also occur in a medical setting, if someone has to handle respiratory secretions such as saliva or mucus from an infected person. Initial reports from China state that the majority of transmissions have occurred either among family members or between patients and health workers. It might also be possible for the virus to be transferred via surfaces contaminated by respiratory droplets or other secretions from an infected person.
_
Understanding Respiratory Infectious Disease Transmission:
In 1897, Carl Flügge showed that pathogens were present in expiratory droplets large enough to settle around an infected individual. “Droplet transmission” by contact with the ejected and infected fluid phase of droplets was thought to be the primary route for respiratory transmission of diseases. This view prevailed until William F. Wells focused on tuberculosis transmission in the 1930s and dichotomized respiratory droplet emissions into “large” and “small” droplets.
According to Wells, isolated droplets are emitted upon exhalation. Large droplets settle faster than they evaporate, contaminating the immediate vicinity of the infected individual. In contrast, small droplets evaporate faster than they settle. In this model, as small droplets transition from the warm and moist conditions of the respiratory system to the colder and drier outside environment, they evaporate and form residual particulates made of the dried material from the original droplets. These residual particulates are referred to as droplet nuclei or aerosols. These ideas resulted in a dichotomous classification between large vs small droplets, or droplets vs aerosol, which can then mediate transmission of respiratory disease. Infection control strategies were then developed based on whether a respiratory infectious disease is primarily transmitted via the large or the small droplet route.
The dichotomy of large vs small droplets remains at the core of the classification systems of routes of respiratory disease transmission adopted by the World Health Organization and other agencies, such as the Centers for Disease Control and Prevention. These classification systems employ various arbitrary droplet diameter cutoffs, from 5 to 10 μm, to categorize host-to-host transmission as droplets or aerosol routes. Such dichotomies continue to underly current risk management, major recommendations, and allocation of resources for response management associated with infection control, including for COVID-19. Even when maximum containment policies were enforced, the rapid international spread of COVID-19 suggests that using arbitrary droplet size cutoffs may not accurately reflect what actually occurs with respiratory emissions, possibly contributing to the ineffectiveness of some procedures used to limit the spread of respiratory disease.
____
Respiratory virus infections cause a broad and overlapping spectrum of symptoms collectively referred to as acute respiratory virus illnesses (ARIs) or more commonly the ‘common cold’. Although mostly mild, these ARIs can sometimes cause severe disease and death. These viruses spread between humans through direct or indirect contact, respiratory droplets (including larger droplets that fall rapidly near the source as well as coarse aerosols with aerodynamic diameter >5 µm) and fine-particle aerosols (droplets and droplet nuclei with aerodynamic diameter ≤5 µm). When you sneeze, largest droplets rapidly settle within 1 to 2 m away from the person. The smaller and evaporating droplets are trapped in the turbulent puff cloud, remain suspended, and, over the course of seconds to a few minutes, can travel the dimensions of a room and land up to 6 to 8 m away. Although hand hygiene and use of face masks, primarily targeting contact and respiratory droplet transmission, have been suggested as important mitigation strategies against influenza virus transmission, little is known about the relative importance of these modes in the transmission of other common respiratory viruses. Uncertainties similarly apply to the modes of transmission of COVID-19.
_
It has long been recognized that particles expelled during human expiratory events, such as sneezing, coughing, talking, and breathing, serve as vehicles for respiratory pathogen transmission. The relative contribution of each expiratory activity in transmitting infectious microorganisms, however, remains unclear. Mechanistic hypotheses about airborne infectious disease transmission have traditionally emphasized the role of coughing and sneezing, which are dramatic expiratory events that yield both easily visible droplets and large quantities of particles too small to see by eye. Much previous research has focused on coughing and sneezing activities that yield relatively large droplets (approximately 50 μm or larger) easily visible to the naked eye. Less noticeable, but arguably more infectious for some diseases, are the smaller particles emitted during sneezing and coughing as well as during breathing and talking. These small particles are believed to be generated during breathing and talking from the mucosal layers coating the respiratory tract via a combination of a “fluid-film burst” mechanism within the bronchioles and from vocal folds adduction and vibration within the larynx. The particles emitted during breathing and typical speech predominantly average only 1 to 5 μm in diameter and are thus too small to see without specialized equipment; most people outside of the community of bioaerosol researchers are less aware of them.
Despite their small size, however, these micron-scale particles are sufficiently large to carry a variety of respiratory pathogens such as measles virus (100–300 nm), influenza virus (80-120 nm), and Mycobacterium tuberculosis (1–3 µm). Indeed, recent work by Yan et al. has confirmed that significant amounts of influenza viral RNA are present in small particles (<5 μm) emitted by influenza-infected individuals during natural breathing, without coughing or sneezing. These small particles are potentially more infectious than larger sneeze- or cough-generated droplets for several reasons.
First, smaller particles persist in the air for longer time periods before setting by gravity, thus increasing the probability of inhalation by susceptible individuals.
Second, smaller particles have a larger probability of penetrating further into the respiratory tract of a susceptible individual to initiate a lower respiratory tract infection.
Third, and perhaps most importantly, speech can release dramatically larger numbers of particles compared to coughing, the louder you speak, the more aerosol particles are generated. Certain individuals are so-called speech superemitters and give off about 10 times the number of particles as others, on average, although the reason remains unknown. In the context of COVID-19, superemitters could potentially act as superspreaders, releasing thousands of infectious particles into the surrounding air in a matter of minutes. A 10-minute conversation with an infected, asymptomatic superemitter talking in a normal volume would yield an invisible ‘cloud’ of approximately 6,000 aerosol particles. At this point, however, we don’t know how infectious that aerosolized cloud might be.
_______
Anfinrud et al. now illustrate in the Journal how liquid droplets exhaled during speech can linger in the air. The large particles to which they refer remain airborne only briefly before settling because of gravity; these particles may pose a threat of infection if they are inhaled by persons close by as well as a contact hazard if they are transferred to another person’s nasal or oral passages. In this way, persons infected with severe acute respiratory syndrome coronavirus 2 (SARS-CoV-2) may contribute to the spread of the infection.
Breathing and talking also produce smaller and much more numerous particles, known as aerosol particles, than those visualized in the laser experiment of Anfinrud and colleagues. Certain persons called “super spreaders” produce many more aerosol particles than other persons. The diameters of these particles are in the few micron range. These particles are too small to settle because of gravity, but they are carried by air currents and dispersed by diffusion and air turbulence.
Inhaled droplets and aerosol particles have different sites of deposition in the recipient. Inhaled droplets are deposited in the upper regions of the respiratory tract, from which they may be removed in nasal secretions or carried upward by the mucociliary escalator, to be expelled or swallowed. In contrast, inhaled aerosolized particles can penetrate to the depths of the lungs, where they may be deposited in the alveoli.
_____
In general it is considered that viral respiratory infections spread by direct contact, such as touching an infected person or the surfaces and fomites that the person has either touched, or on which large virus-containing droplets expired by the person have landed (Morawska 2006), and there the virus can remain stable for days (van Doremalen et al. 2020). The droplets can also be deposited directly on a person in close proximity to the infected person. Therefore, frequent hand-washing and maintaining a distance of at least one meter (arm’s length) are considered the main precautions against contracting the infection (WHO 2020a). One transmission route that is mentioned only in passing, or not at all, is the transport of virus-laden particles in the air. Immediately after droplets are expired, the liquid content starts to evaporate, and some droplets become so small that transport by air current affects them more than gravitation. Such small droplets are free to travel in the air and carry their viral content meters and tens of meters from where they originated (e.g. Morawska et al. 2009), as graphically presented in the figure below:
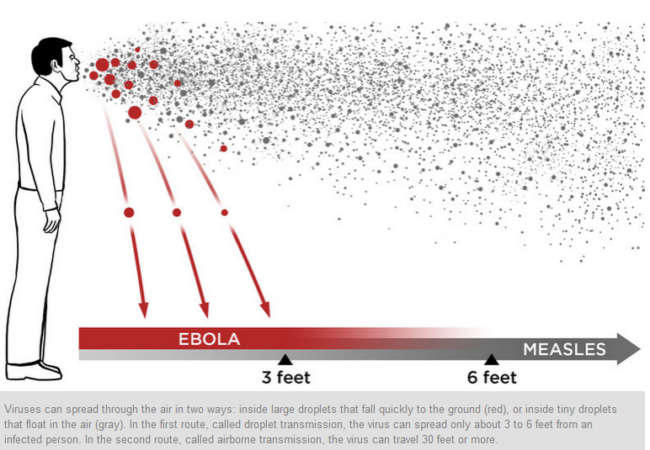
Figure above shows larger droplets with viral content deposit close to the emission point (droplet transmission), while smaller can travel meters or tens of meters long distances in the air indoors (aerosol transmission).
_
Figure below shows Cough droplets visualized in dark background using Tyndall scattering
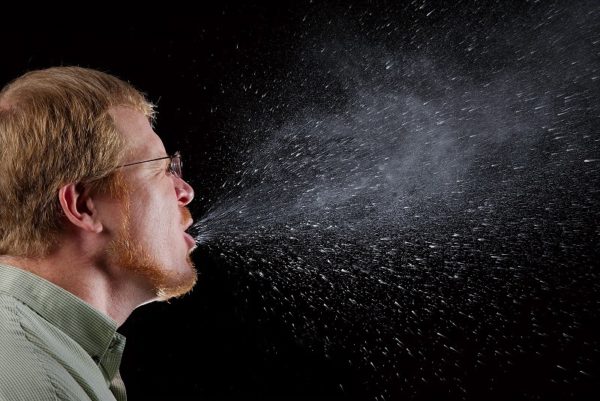
_
The WHO and the U.S. Centers for Disease Control and Prevention (CDC) say covid-19 is primarily spread during close contact and by droplets produced when people cough, sneeze or talk; with close contact being within 1–3 m (3 ft 3 in–9 ft 10 in). A study in Singapore found that an uncovered cough can lead to droplets travelling up to 4.5 meters (15 feet). A second study, produced during the 2020 pandemic, found that advice on the distance droplets could travel might be based on old 1930s research which ignored the protective effect and speed of the warm moist outbreath surrounding the droplets. This study found that an uncovered cough or sneeze can travel up to 8.2 meters (27 feet).
Though the virus is not generally airborne, the National Academy of Science has suggested that bioaerosol transmission may be possible and air collectors positioned in the hallway outside of people’s rooms yielded samples positive for viral RNA. The droplets can land in the mouths or noses of people who are nearby or possibly be inhaled into the lungs. Some medical procedures such as intubation and cardiopulmonary resuscitation (CPR) may cause respiratory secretions to be aerosolised and thus result in airborne spread. It may also spread when one touches a contaminated surface, known as fomite transmission, and then touches one’s eyes, nose or mouth. While there are concerns it may spread by feces, this risk is believed to be low.
_____
Turbulent Gas Clouds and Respiratory Pathogen Emissions:
The current coronavirus disease 2019 (COVID-19) outbreak vividly demonstrates the burden that respiratory infectious diseases impose in an intimately connected world. Unprecedented containment and mitigation policies have been implemented in an effort to limit the spread of COVID-19, including travel restrictions, screening and testing of travelers, isolation and quarantine, and school closures. A key goal of such policies is to decrease the encounters between infected individuals and susceptible individuals and decelerate the rate of transmission. Although such social distancing strategies are critical in the current time of pandemic, it may seem surprising that the current understanding of the routes of host-to-host transmission in respiratory infectious diseases are predicated on a model of disease transmission developed in the 1930s that, by modern standards, seems overly simplified. Implementing public health recommendations based on these older models may limit the effectiveness of the proposed interventions.
New Model for Respiratory Emissions:
Recent work has demonstrated that exhalations, sneezes, and coughs not only consist of mucosalivary droplets following short-range semiballistic emission trajectories but, importantly, are primarily made of a multiphase turbulent gas (a puff) cloud that entrains ambient air and traps and carries within it clusters of droplets with a continuum of droplet sizes. The locally moist and warm atmosphere within the turbulent gas cloud allows the contained droplets to evade evaporation for much longer than occurs with isolated droplets. Under these conditions, the lifetime of a droplet could be considerably extended by a factor of up to 1000, from a fraction of a second to minutes.
_
Figure below shows Multiphase Turbulent Gas Cloud from a Human Sneeze:
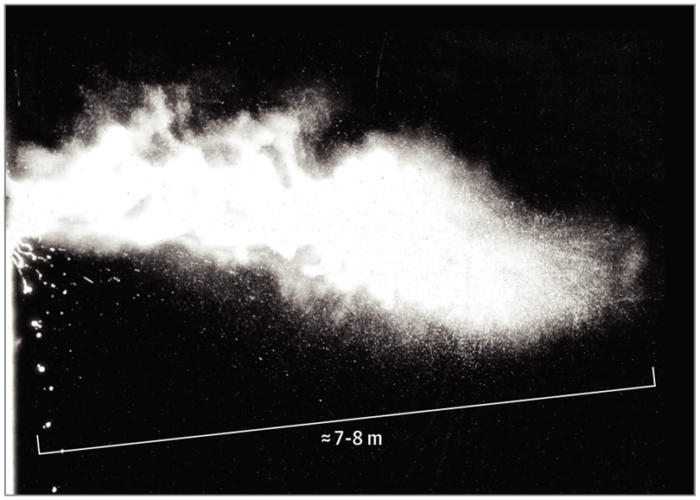
_
Owing to the forward momentum of the cloud, pathogen-bearing droplets are propelled much farther than if they were emitted in isolation without a turbulent puff cloud trapping and carrying them forward. Given various combinations of an individual patient’s physiology and environmental conditions, such as humidity and temperature, the gas cloud and its payload of pathogen-bearing droplets of all sizes can travel 23 to 27 feet (7-8 m). Importantly, the range of all droplets, large and small, is extended through their interaction with and trapping within the turbulent gas cloud, compared with the commonly accepted dichotomized droplet model that does not account for the possibility of a hot and moist gas cloud. Moreover, throughout the trajectory, droplets of all sizes settle out or evaporate at rates that depend not only on their size, but also on the degree of turbulence and speed of the gas cloud, coupled with the properties of the ambient environment (temperature, humidity, and airflow).
Droplets that settle along the trajectory can contaminate surfaces, while the rest remain trapped and clustered in the moving cloud. Eventually the cloud and its droplet payload lose momentum and coherence, and the remaining droplets within the cloud evaporate, producing residues or droplet nuclei that may stay suspended in the air for hours, following airflow patterns imposed by ventilation or climate-control systems. The evaporation of pathogen-laden droplets in complex biological fluids is poorly understood. The degree and rate of evaporation depend strongly on ambient temperature and humidity conditions, but also on the inner dynamics of the turbulent puff cloud coupled with the composition of the liquid exhaled by the patient.
A 2020 report from China demonstrated that SARS-CoV-2 virus particles could be found in the ventilation systems in hospital rooms of patients with COVID-19. Finding virus particles in these systems is more consistent with the turbulent gas cloud hypothesis of disease transmission than the dichotomous model because it explains how viable virus particles can travel long distances from patients. Whether these data have clinical implications with respect to COVID-19 is unknown.
Implications for Prevention and Precaution:
Although no studies have directly evaluated the biophysics of droplets and gas cloud formation for patients infected with the SARS-CoV-2 virus, several properties of the exhaled gas cloud and respiratory transmission may apply to this pathogen. If so, this possibility may influence current recommendations intended to minimize the risk for disease transmission. In the latest World Health Organization recommendations for COVID-19, health care personnel and other staff are advised to maintain a 3-foot (1-m) distance away from a person showing symptoms of disease, such as coughing and sneezing. The Centers for Disease Control and Prevention recommends a 6-foot (2-m) separation. However, these distances are based on estimates of range that have not considered the possible presence of a high-momentum cloud carrying the droplets long distances. Given the turbulent puff cloud dynamic model, recommendations for separations of 3 to 6 feet (1-2 m) may underestimate the distance, timescale, and persistence over which the cloud and its pathogenic payload travel, thus generating an underappreciated potential exposure range for a health care worker. For these and other reasons, wearing of appropriate personal protection equipment is vitally important for health care workers caring for patients who may be infected, even if they are farther than 6 feet away from a patient.
Turbulent gas cloud dynamics should influence the design and recommended use of surgical and other masks. These masks can be used both for source control (i.e., reducing spread from an infected person) and for protection of the wearer (i.e., preventing spread to an unaffected person). The protective efficacy of N95 masks depends on their ability to filter incoming air from aerosolized droplet nuclei. However, these masks are only designed for a certain range of environmental and local conditions and a limited duration of usage. Mask efficacy as source control depends on the ability of the mask to trap or alter the high-momentum gas cloud emission with its pathogenic payload. Peak exhalation speeds can reach up to 33 to 100 feet per second (10-30 m/s), creating a cloud that can span approximately 23 to 27 feet (7-8 m). Protective and source control masks, as well as other protective equipment, should have the ability to repeatedly withstand the kind of high-momentum multiphase turbulent gas cloud that may be ejected during a sneeze or a cough and the exposure from them. Currently used surgical and N95 masks are not tested for these potential characteristics of respiratory emissions.
A lab at Florida Atlantic University simulated a human cough to understand how far and fast cough droplets can spread, and found that it can travel up to 12 feet in few seconds and coughing through mask could not block all droplets, some managed to pass through mask and leakages around mask edges.
_______
_______
Studies favoring airborne transmission of covid-19:
_
Study-1.
New findings, published in Nature, add to the evidence indicating that SARS-CoV-2 can persist in aerosol samples. Researchers in Wuhan measured SARS-CoV-2 RNA concentrations in aerosol samples taken from 30 sites inside two hospitals dedicated to treating COVID-19, as well as from several public areas.
Among the findings:
Patient areas: Viral RNA concentrations generally were very low or undetectable in patient areas (e.g., ICUs, coronary care unit), except in a patient mobile toilet room, which was not ventilated.
Medical staff areas: Some sites — including rooms where personal protective equipment was removed — had high SARS-CoV-2 RNA levels; these levels became undetectable after better sanitization procedures were implemented.
Public areas: Two areas that got a lot of foot traffic — the entrance to a department store and a site next to one of the hospitals — had high viral RNA concentrations.
The researchers conclude: “Although we have not established the infectivity of the virus detected in these hospital areas, we propose that SARS-CoV-2 may have the potential to be transmitted via aerosols. Our results indicate that room ventilation, open space, sanitization of protective apparel, and proper use and disinfection of toilet areas can effectively limit the concentration of SARS-CoV-2 RNA in aerosols.”
_____
Study-2
Airborne transmission of SARS-CoV-2: The world should face the reality, 2020:
Hand washing and maintaining social distance are the main measures recommended by the World Health Organization (WHO) to avoid contracting COVID-19. Unfortunately, these measured do not prevent infection by inhalation of small droplets exhaled by an infected person that can travel distance of meters or tens of meters in the air and carry their viral content. Science explains the mechanisms of such transport and there is evidence that this is a significant route of infection in indoor environments. Despite this, no countries or authorities consider airborne spread of COVID-19 in their regulations to prevent infections transmission indoors. It is therefore extremely important, that the national authorities acknowledge the reality that the virus spreads through air, and recommend that adequate control measures be implemented to prevent further spread of the SARS-CoV-2 virus, in particularly removal of the virus-laden droplets from indoor air by ventilation.
Is it likely that the SARS-CoV-2 virus spreads by air?
Its predecessor, SARS-CoV-1, did spread in the air. This was reported in several studies and retrospectively explained the pathway of transmission in Hong Kong’s Prince of Wales Hospital (Li et al., 2005, Xiao et al., 2017;12., Yu et al., 2005), as well as in health care facilities in Toronto, Canada (Booth et al. 2005), and in aircraft (Olsen et al. 2003). These studies concluded that airborne transmission was the main transmission route in the indoor cases studied. Other examples of airborne transmission of viral infections include the spread of Norwalk-like virus between school children (Marks et al. 2003), and the transmission of influenza A/H5N1 virus between ferrets (Herfst et al. 2012). A World Health Organization (WHO 2009) review of the evidence stated that viral infectious diseases can be transmitted across distances relevant to indoor environments by aerosols (e.g. airborne infections), and can result in large clusters of infection in a short period. Considering the many similarities between the two SARS viruses and the evidence on virus transport in general, it is highly likely that the SARS-CoV-2 virus also spreads by air (Fineberg 2020). Experts in droplet dynamics and airflow in buildings agree on this (Lewis 2020). Therefore, all possible precautions against airborne transmission in indoor scenarios should be taken. Precautions include increased ventilation rate, using natural ventilation, avoiding air recirculation, avoiding staying in another person’s direct air flow, and minimizing the number of people sharing the same environment (Qian et al. 2018). Of significance is maximizing natural ventilation in buildings that are, or can be naturally ventilation and ensuring that the ventilation rate is sufficiently high. These precautions focus on indoor environment of public places, where the risk of infection is greatest, due to the possible buildup of the airborne virus-carrying droplets, the virus likely higher stability in indoor air, and a larger density of people. Public places include in the first instance heath care facilities: while in many hospitals care to provide adequate ventilation is a routine measure, this is not the case in all hospital; often not where new patients are admitted; nursing homes, etc. Shops, offices, schools, restaurants, cruise ships, and of course public transport, is where ventilation practices should reviewed, and ventilation maximized. Also, personal protective equipment (PPE), in particular masks and respirators should be recommended, to be used in public places where density of people is high and ventilation potentially inadequate, as they can protect against infection others (by infected individuals) and being infected (Huang and Morawska, 2019, Leung et al., 2020).
The fact that there are no simple methods for detecting the virus in the air does not mean that the viruses do not travel in the air. The above-mentioned retrospective modeling studies explained the transmission of SARS-CoV-1 in 2003 (Booth et al., 2005, Li et al., 2005, Olsen et al., 2003, Xiao et al., 2017;12., Yu et al., 2005). While we do not yet have all the required data in hand, including for example data on the patterns of infections, or specific indoor characteristics where the infections occurred, analysis of the initial pattern of COVID-19 spread in China reveals multiple cases of non-contact transmission, especially in areas outside Wuhan, such as those in Hunan and Tianjin. On numerous cruise ships where thousands of people onboard were infected, many of the infections occurred after the imposition of isolation that confined passengers for the majority of time to their cabins, and limited direct contact, and with hand hygiene carefully obeyed. Was it therefore the ventilation system that spread the airborne virus between the cabins one of the reasons for the infections? There are also hypothesis, that airborne transmission was at least partially responsible for a larger number of infections during a choir, where 45 out of 60 choir members were infected (Read 2020).
To summarize, based on the trend in the increase of infections, and understanding the basic science of viral infection spread, authors strongly believe that the virus is likely to be spreading through the air. If this is the case, it will take at least several months for this to be confirmed by science. This is valuable time lost that could be used to properly control the epidemic by the measures outlined above and prevent more infections and loss of life. Therefore, we plead that the international and national authorities acknowledge the reality that the virus spreads through air, and recommend that adequate control measures, as discussed above be implemented to prevent further spread of the SARS-CoV-2 virus.
______
Study-3
Aerosol and Surface Stability of SARS-CoV-2 as Compared with SARS-CoV-1, March, 2020:
Here authors investigate the stability of viable HCoV-19 on surfaces and in aerosols in comparison with SARSCoV-1. Overall, stability is very similar between HCoV-19 and SARS-CoV-1. Authors found that viable virus could be detected in aerosols up to 3 hours post aerosolization, up to 4 hours on copper, up to 24 hours on cardboard and up to 2-3 days on plastic and stainless steel. HCoV-19 and SARS-CoV-1 exhibited similar half-lives in aerosols, with median estimates around 2.7 hours. Both viruses show relatively long viability on stainless steel and polypropylene compared to copper or cardboard: the median half-life estimate for HCoV-19 is around 13 hours on steel and around 16 hours on polypropylene. These results indicate that aerosol and fomite transmission of HCoV-19 is plausible, as the virus can remain viable in aerosols for multiple hours and on surfaces up to days.
_
A novel human coronavirus, now named severe acute respiratory syndrome coronavirus (SARS-CoV-2, referred to as HCoV-19 throughout this study) emerged in Wuhan, China in late 2019. The rapid expansion of this outbreak is indicative of efficient human-to-human transmission. HCoV-19 has been detected in upper and lower respiratory tract samples from patients, with high viral loads in upper respiratory tract samples. Therefore, virus transmission via respiratory secretions in the form of droplets (>5 microns) or aerosols (<5 microns) appears to be likely. Virus stability in air and on surfaces may directly affect virus transmission, as virus particles need to remain viable long enough after being expelled from the host to be taken up by a novel host. Airborne transmission or fomite transmission were thought to play important roles in the epidemiology of the two zoonotic coronaviruses that emerged this century, SARS-CoV-1 and MERS-CoV.6 Airborne transmission may have been responsible for the largest superspreading event during the SARS epidemic of 2002-2003, and numerous nosocomial superspreading events of SARS-CoV-1 were linked to aerosol-generating medical procedures. Fomite transmission was also suspected during the SARS epidemic, and one analysis of a nosocomial SARS-CoV-1 superspreading event concluded that fomites had played a significant role.
Authors evaluated the stability of SARS-CoV-2 and SARS-CoV-1 in aerosols and on various surfaces and estimated their decay rates using a Bayesian regression model. SARS-CoV-2 nCoV-WA1-2020 (MN985325.1) and SARS-CoV-1 Tor2 (AY274119.3) were the strains used. Aerosols (<5 μm) containing SARS-CoV-2 (105.25 50% tissue-culture infectious dose [TCID50] per milliliter) or SARS-CoV-1 (106.75-7.00 TCID50 per milliliter) were generated with the use of a three-jet Collison nebulizer and fed into a Goldberg drum to create an aerosolized environment. The inoculum resulted in cycle-threshold values between 20 and 22, similar to those observed in samples obtained from the upper and lower respiratory tract in humans. Their data consisted of 10 experimental conditions involving two viruses (SARS-CoV-2 and SARS-CoV-1) in five environmental conditions (aerosols, plastic, stainless steel, copper, and cardboard). All experimental measurements are reported as means across three replicates.
_
Figure below shows Viability of SARS-CoV-1 and SARS-CoV-2 in Aerosols and on Various Surfaces.
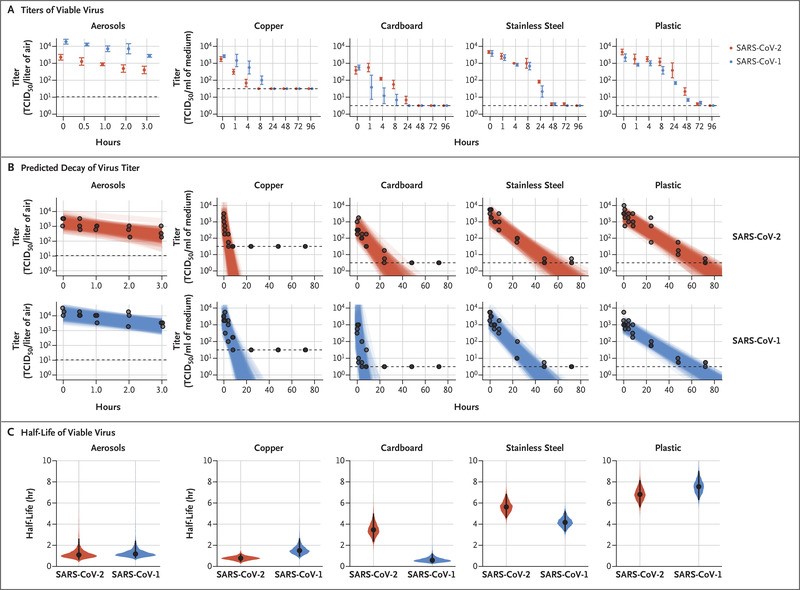
As shown in Panel A, the titer of aerosolized viable virus is expressed in 50% tissue-culture infectious dose (TCID50) per liter of air. Viruses were applied to copper, cardboard, stainless steel, and plastic maintained at 21 to 23°C and 40% relative humidity over 7 days. The titer of viable virus is expressed as TCID50 per milliliter of collection medium. All samples were quantified by end-point titration on Vero E6 cells. Plots show the means and standard errors (bars) across three replicates. As shown in Panel B, regression plots indicate the predicted decay of virus titer over time; the titer is plotted on a logarithmic scale. Points show measured titers and are slightly jittered (i.e., their horizontal positions are modified by a small random amount to reduce overlap) along the time axis to avoid overplotting. Lines are random draws from the joint posterior distribution of the exponential decay rate (negative of the slope) and intercept (initial virus titer) to show the range of possible decay patterns for each experimental condition. There were 150 lines per panel, including 50 lines from each plotted replicate. As shown in Panel C, violin plots indicate posterior distribution for the half-life of viable virus based on the estimated exponential decay rates of the virus titer. The dots indicate the posterior median estimates, and the black lines indicate a 95% credible interval. Experimental conditions are ordered according to the posterior median half-life of SARS-CoV-2. The dashed lines indicate the limit of detection, which was 3.33×100.5 TCID50 per liter of air for aerosols, 100.5 TCID50 per milliliter of medium for plastic, steel, and cardboard, and 101.5 TCID50 per milliliter of medium for copper.
_
SARS-CoV-2 remained viable in aerosols throughout the duration of our experiment (3 hours), with a reduction in infectious titer from 103.5 to 102.7 TCID50 per liter of air. This reduction was similar to that observed with SARS-CoV-1, from 104.3 to 103.5 TCID50 per milliliter.
SARS-CoV-2 was more stable on plastic and stainless steel than on copper and cardboard, and viable virus was detected up to 72 hours after application to these surfaces, although the virus titer was greatly reduced (from 103.7 to 100.6 TCID50 per milliliter of medium after 72 hours on plastic and from 103.7 to 100.6 TCID50 per milliliter after 48 hours on stainless steel). The stability kinetics of SARS-CoV-1 were similar (from 103.4 to 100.7 TCID50 per milliliter after 72 hours on plastic and from 103.6 to 100.6 TCID50 per milliliter after 48 hours on stainless steel). On copper, no viable SARS-CoV-2 was measured after 4 hours and no viable SARS-CoV-1 was measured after 8 hours. On cardboard, no viable SARS-CoV-2 was measured after 24 hours and no viable SARS-CoV-1 was measured after 8 hours.
_
Both viruses had an exponential decay in virus titer across all experimental conditions, as indicated by a linear decrease in the log10TCID50 per liter of air or milliliter of medium over time. The half-lives of SARS-CoV-2 and SARS-CoV-1 were similar in aerosols, with median estimates of approximately 1.1 to 1.2 hours and 95% credible intervals of 0.64 to 2.64 for SARS-CoV-2 and 0.78 to 2.43 for SARS-CoV-1. The half-lives of the two viruses were also similar on copper. On cardboard, the half-life of SARS-CoV-2 was longer than that of SARS-CoV-1. The longest viability of both viruses was on stainless steel and plastic; the estimated median half-life of SARS-CoV-2 was approximately 5.6 hours on stainless steel and 6.8 hours on plastic. Estimated differences in the half-lives of the two viruses were small except for those on cardboard. Individual replicate data were noticeably “noisier” (i.e., there was more variation in the experiment, resulting in a larger standard error) for cardboard than for other surfaces, so we advise caution in interpreting this result.
_
Authors found that the stability of SARS-CoV-2 was similar to that of SARS-CoV-1 under the experimental circumstances tested. This indicates that differences in the epidemiologic characteristics of these viruses probably arise from other factors, including high viral loads in the upper respiratory tract and the potential for persons infected with SARS-CoV-2 to shed and transmit the virus while asymptomatic. Results indicate that aerosol and fomite transmission of SARS-CoV-2 is plausible, since the virus can remain viable and infectious in aerosols for hours and on surfaces up to days (depending on the inoculum shed). These findings echo those with SARS-CoV-1, in which these forms of transmission were associated with nosocomial spread and super-spreading events,5 and they provide information for pandemic mitigation efforts.
_
This study showed that experimentally produced aerosols containing SARS-CoV-2 virions remained infectious in tissue-culture assays, with only a slight reduction in infectivity during a 3-hour period of observation. Aerosols from infected persons may therefore pose an inhalation threat even at considerable distances and in enclosed spaces, particularly if there is poor ventilation. The possible contribution of infective aerosols to the current pandemic suggests the advisability of wearing a suitable mask whenever it is thought that infected persons may be nearby and of providing adequate ventilation of enclosed spaces where such persons are known to be or may recently have been.
Criticism of the study.
The World Health Organization points out that the study in the New England Journal of Medicine was done using lab equipment, not real people coughing or sneezing. In this experimental study, aerosols were generated using a three-jet Collison nebulizer and fed into a Goldberg drum under controlled laboratory conditions. This is a high-powered machine that does not reflect normal human cough conditions. Further, the finding of COVID-19 virus in aerosol particles up to 3 hours does not reflect a clinical setting in which aerosol-generating procedures are performed—that is, this was an experimentally induced aerosol-generating procedure. WHO maintains there is not sufficient evidence to conclude that the coronavirus can be transmitted through the air, except when someone infected with COVID-19 coughs or exhales producing droplets that reach the nose, mouth or eyes of another person directly while the two are in close contact.
_____
Study-4
A study published in Emerging Infectious Diseases found a wide distribution of COVID-19 virus genetic material on surfaces and in the air about 4 meters (13 feet) from patients in two hospital wards in Wuhan, China, posing a risk to healthcare workers. While the findings of the environmental sampling study do not indicate the amount of live virus, if any, or precisely determine the distance of aerosol transmission, the authors say that they confirm that the virus spreads in aerosols in addition to large respiratory droplets.
The researchers tested surface and air samples from an intensive care unit (ICU) and general coronavirus ward at Huoshenshan Hospital from Feb 19 to Mar 2 to detect evidence of SARS-CoV-2, the coronavirus that causes COVID-19.
Fifteen patients were in the ICU, while 24 were housed in the general ward. The investigators used quantitative real-time polymerase chain reaction to identify virus in swabs of floors, computer mice, trash bins, bed handrails, patients’ face masks, health workers’ personal protective equipment, and air vents.
Nearly all (54 of 57) positive samples (94.7%) were from contaminated areas of the ICU and general ward (9/9 [100%]). Rate of positive samples was much higher for the ICU than for the general ward (54/124 [43.5%] vs. 9/114 [7.9%]).
Virus aerosols in ICU:
Fourteen of 40 air samples from the ICU (35%) tested positive for coronavirus, while 2 of 16 from the general ward (12.5%) were positive. Eight of 12 ICU air vent swabs (66.7%) tested positive, as did 1 of 12 (8.3%) general ward swabs, results that the authors said “confirm that SARS-CoV-2 aerosol exposure poses risks.”
COVID-19 aerosol was found near air vents (5/14 [25.7%]), in patient rooms (8/18 [44.4%]), and in the doctor’s office area (1/8 [12.5%]), indicating that aerosolized virus was concentrated near and downstream of patients. However, the upstream area also posed a risk and that, based on the detection of virus in the doctor’s office, “the maximum transmission distance of SARS-CoV-2 aerosol might be 4 m,” they said.
Using the aerosol test results, the researchers identified the patient care area of the ICU as high risk because of the high positivity rate (13/32 [40.6%]). “Thus, stricter protective measures should be taken by medical staff working in the ICU,” the authors said.
______
Study-5
Transmission Potential of SARS-CoV-2 in Viral Shedding Observed at the University of Nebraska Medical Center, march 2020:
Lack of evidence on SARS-CoV-2 transmission dynamics has led to shifting isolation guidelines between airborne and droplet isolation precautions. During the initial isolation of 13 individuals confirmed positive with COVID-19 infection, air and surface samples were collected in eleven isolation rooms to examine viral shedding from isolated individuals. While all individuals were confirmed positive for SARS-CoV-2, symptoms and viral shedding to the environment varied considerably. Many commonly used items, toilet facilities, and air samples had evidence of viral contamination, indicating that SARS-CoV-2 is shed to the environment as expired particles, during toileting, and through contact with fomites. Disease spread through both direct (droplet and person-to-person) as well as indirect contact (contaminated objects and airborne transmission) are indicated, supporting the use of airborne isolation precautions.
_
Air samples, both in the rooms and in the hallway spaces, provide information about airborne viral shedding in these facilities. In room air samples were 63.2% positive by RT-PCR (mean concentration 2.86 copies/L of air). Air samples that were positive for viral RNA by RT-PCR were examined for viral propagation in Vero E6 cells. Cytopathic effect was not observed in any sample, to date, and immunofluorescence and western blot analysis have not, so far, indicated the presence of viral antigens suggesting viral replication. However, the low concentrations of virus recovered from these samples makes finding infectious virus in these samples difficult.
Recent literature investigating human expired aerosol indicates that a significant fraction of human expired aerosol is less than 10 µm in diameter across all types of activity (e.g. breathing, talking, and coughing) and that upper respiratory illness increases production of aerosol particles (less than 10 µm). Taken together these results suggest that virus expelled from infected individuals, including from those who are only mildly ill, may be transported by aerosol processes in their local environment, potentially even in the absence of cough or aerosol generating procedures.
______
______
Studies refuting airborne transmission:
_
Study-1
WHO recommendations 29 March 2020:
Respiratory infections can be transmitted through droplets of different sizes: when the droplet particles are >5-10 μm in diameter they are referred to as respiratory droplets, and when then are <5μm in diameter, they are referred to as droplet nuclei or aerosols. According to current evidence, COVID-19 virus is primarily transmitted between people through respiratory droplets and contact routes. In an analysis of 75,465 COVID-19 cases in China, airborne transmission was not reported.
Droplet transmission occurs when a person is in in close contact (within 1 m) with someone who has respiratory symptoms (e.g., coughing or sneezing) and is therefore at risk of having his/her mucosae (mouth and nose) or conjunctiva (eyes) exposed to potentially infective respiratory droplets. Transmission may also occur through fomites in the immediate environment around the infected person. Therefore, transmission of the COVID-19 virus can occur by direct contact with infected people and indirect contact with surfaces in the immediate environment or with objects used on the infected person (e.g., stethoscope or thermometer).
Airborne transmission is different from droplet transmission as it refers to the presence of microbes within droplet nuclei, which are generally considered to be particles <5μm in diameter, can remain in the air for long periods of time and be transmitted to others over distances greater than 1 m.
In the context of COVID-19, airborne transmission may be possible in specific circumstances and settings in which procedures or support treatments that generate aerosols are performed; i.e., endotracheal intubation, bronchoscopy, open suctioning, administration of nebulized treatment, manual ventilation before intubation, turning the patient to the prone position, disconnecting the patient from the ventilator, non-invasive positive-pressure ventilation, tracheostomy, and cardiopulmonary resuscitation.
There are reports from settings where symptomatic COVID-19 patients have been admitted and in which no COVID-19 RNA was detected in air samples. WHO is aware of other studies which have evaluated the presence of COVID-19 RNA in air samples, but which are not yet published in peer-reviewed journals. It is important to note that the detection of RNA in environmental samples based on PCR-based assays is not indicative of viable virus that could be transmissible. Further studies are needed to determine whether it is possible to detect COVID-19 virus in air samples from patient rooms where no procedures or support treatments that generate aerosols are ongoing. As evidence emerges, it is important to know whether viable virus is found and what role it may play in transmission.
Based on the available evidence, including the recent publications, WHO continues to recommend droplet and contact precautions for those people caring for COVID-19 patients. WHO continues to recommend airborne precautions for circumstances and settings in which aerosol generating procedures and support treatment are performed, according to risk assessment. These recommendations are consistent with other national and international guidelines, including those developed by the European Society of Intensive Care Medicine and Society of Critical Care Medicine and those currently used in Australia, Canada, and United Kingdom.
At the same time, other countries and organizations, including the US Centers for Diseases Control and Prevention and the European Centre for Disease Prevention and Control, recommend airborne precautions for any situation involving the care of COVID-19 patients, and consider the use of medical masks as an acceptable option in case of shortages of respirators (N95, FFP2 or FFP3).
______
Study-2
Epidemiological reasoning:
Even if the virus infects only a small fraction of those who come into contact with it, the extremely low rate among close contacts and the absence of infections in some household members of patients suggests that it rarely exists as an aerosol in most real-world situations. It’s more evidence that [Covid-19] is predominantly spread through droplets and not as an aerosol.
____
Study-3
Physical evidence bolsters that epidemiological reasoning. When researchers in Singapore tested the air in the rooms of three Covid-19 patients, they found no virus particles on cleaned surfaces or in the air even when they took samples on days the patients were symptomatic and presumably shedding virus into the air, they reported in the Journal of the American Medical Association. In the room of the third patient, who shed more virus, virus particles were present on ventilation fans and numerous surfaces — but all air samples were negative. That suggests that aerosolized virus particles are, at worst, rare in real-world conditions.
_____
Study-4
A study by virologist Ke Lan of Wuhan University and his colleagues found no coronavirus in intensive care areas where Covid-19 patients were being treated, in general patient rooms, in hallways, or outside the hospitals. They took 35 air samples at two hospitals as well as public areas in Wuhan, where the Covid-19 outbreak apparently started.
______
My view:
When public health officials say there isn’t sufficient evidence to say that SARS-CoV-2 is airborne, they specifically mean transported in virus-laden aerosols smaller than 5 micrometers in diameter. Compared with droplets, which are heftier and thought to travel only short distances after someone coughs or sneezes before falling to the floor or onto other surfaces, aerosols can linger in the air for longer and travel farther.
Most transmission occurs at close range but the distinction between droplets and aerosols is unhelpful because the particles that come out with virus can be a wide range of sizes. Very, very large ones right down to aerosols. And if SARS-CoV-2 is transmitting in aerosols, it is possible that virus particles can build up over time in enclosed spaces or be transmitted over greater distances. Aerosols are also more likely to be produced by talking and breathing, which might even constitute a bigger risk than sneezing and coughing. When someone’s coughing, they turn away, and when they’re sneezing, they turn away. That’s not the case when we talk and breathe. A study of people with influenza found that 39% of people exhaled infectious aerosols. As long as we are sharing an airspace with someone else, breathing in the air that they exhale, airborne transmission is possible.
Gathering unequivocal evidence for airborne transmission could take years and cost lives. The assumption should be that airborne transmission is possible unless experimental evidence rules it out, not the other way around. That way people can take precautions to protect themselves. Increasing ventilation indoors and not recirculating air can go some way to ensuring that infectious aerosols are diluted and flushed out. Asking public to wear masks can reduce airborne transmission.
It is pointless to score points over each other by quoting studies in favour of aerosol transmission or against aerosol transmission. The goal should be to prevent spread of disease, save lives and avoid panic.
- social distancing works in large droplet transmission in close contacts i.e. < 2 meter but fails in long travelled aerosols
- hand washing works in both droplet and aerosol transmission
- disinfecting surfaces work in both droplet and aerosol transmission
- everybody agrees that infected person must wear mask no matter droplet and/or aerosol transmission but infected person could be asymptomatic or presymptomatic. Since it is impossible to do RT-PCR tests for everybody and since 30 % cases are missed in RT-PCR testing, the only option we have is to mask everybody in public domain. When everybody in public domain wear masks, those concealed infected individuals will be prevented from spreading virus and those who are going to get infected through airborne transmission will also be protected as social distancing cannot prevent airborne transmission.
After going through all the literature on the subject, I believe that SARS-CoV-2 is transmitted by large droplet as well as small aerosols and therefore airborne precautions should be taken by everybody. Also, aerosols are generated by normal breathing and talking that cannot be stopped and aerosols reach lower respiratory tract causing severe disease. Wearing proper masks using correct technique by everybody is the best way to prevent spread of airborne virus.
Experts say that masks are often not worn properly and some virus can still pass through masks, so social distancing must be done in addition to masks. I respectfully disagree. Social distancing of 1-2 meter means large droplets will fall on ground within 1-2 meter of infected person and not enter respiratory tract of people. However when infected individual is wearing mask, most droplets will be blocked. Since everybody wears mask in public domain, all concealed infected people are also wearing masks. If masks cannot block all virus particles, then virus particles in aerosol can travel far beyond social distancing and infect people; however since everyone is wearing mask, those long travelled aerosols with viruses can be partially be blocked by wearing masks whereas social distancing fails completely in airborne transmission. Therefore, when everyone wears masks in public spaces, social distancing becomes irrelevant.
_________
_________
Section-6
Viability of virus on environmental surfaces:
_
According to Prof Richard Tedder the virus will survive and remain infectious outside the body, as viruses do; But infectivity will fall away with time. How quickly this fall occurs is measured as the time taken for virus infectivity to reduce by half. This is termed ‘half-life’ or T1/2 and for this virus is measured in hours. In fact this is best thought of as ‘rate of decay’. The rate of decay is fastest on copper with a T1/2 around 1 hour, in air as an aerosol T1/2 is also around 1 hour, cardboard is 3 and 1/2 hours, plastic and steel T1/2 is around 6 hours. For example, if one million viruses were placed on various surfaces it would require 20 half lives to become undetectable and non-infectious, so 20 hours if in an aerosol, 20 hours on copper, 60-70 hours on cardboard and finally 120-130 hours on plastic and steel. Of course, when one deals with infectivity rather than detectability, extinguishing infectivity is far quicker. Studies with cultured virus starting at relatively high levels have shown loss of infectivity within around 12-15 hours on copper, under 10 hours on cardboard, around 50 hours on steel and 70 hours on plastic. The data for infectivity in aerosols were not comparable and were of a different time course.
_
The primary way people become infected with the coronavirus is from person-to-person transmission. This close contact in the form of a hug, handshake, or being in a packed public space enables infected individuals to easily spread their respiratory droplets, which are typically sneezed or coughed. But because respiratory droplets are heavy, they typically fall to the ground easily. Depending on where they land, they could persist on a surface before being touched by a hand that carries the virus to a nose or mouth, leading to infection.
All viruses are bits of genetic code bundled inside a collection of lipids and proteins, which can include a fat-based casing known as a viral envelope. Destroying an enveloped virus takes less effort than their non-enveloped compatriots, such as the stomach-busting norovirus, which can last for months on a surface. Enveloped viruses typically survive outside of a body for only a matter of days and are considered among the easiest to kill, because once their fragile exterior is broken down, they begin to degrade. Yet every enveloped virus is different, and scientists around the world are aggressively researching SARS-CoV-2, the official name of the new coronavirus, to understand how it stacks up. A study published in the New England Journal of Medicine (vide supra) looked at how long it can be detected on various materials. Dylan Morris, an evolutionary biologist at Princeton University and a study co-author, says the mission was to investigate which surfaces found in medical settings might serve as a potential cesspool for infecting patients. On surfaces, they found SARS-CoV-2 lasted for 24 hours on cardboard, two days on stainless steel, and three days on a type of hard plastic called polypropylene. The virus could only be detected for four hours on copper, a material that naturally breaks down bacteria and viruses.

But their study has limitations. The team examined the virus in a highly controlled lab setting. Spaces that are commonly touched, like a stair rail or bus pole, would contain a higher amount of the virus and present a greater risk for infection. Environmental conditions can also influence how long the virus lasts. Humidity, for example, is thought to make it harder for respiratory droplets to travel through the air, and ultraviolet light is known to degrade viruses.
A study published in the Journal of Hospital Infection looked at the lifespans of other coronaviruses found in humans on various surfaces. The SARS coronavirus – at a temperature of 68 degrees Fahrenheit (20 degrees Celsius) – lasts for two days on steel; four days on wood and glass; and five days on metal, plastic, and ceramics. (The researchers also found that one strain of SARS lasted up to nine days on a plastic surface at room temperature.) SARS only survives between two and eight hours on aluminum, and less than eight hours on latex.
Smooth, nonporous surfaces like doorknobs and tabletops are better at carrying viruses in general. Porous surfaces – like money, hair, and fabric – do not allow viruses to survive as long because the minute spaces or holes in those materials can trap the microbe and prevent its transfer.
The surrounding temperature makes a big difference. The recent study revealed that spikes in temperature make a difference in the lifespans of coronaviruses. An 18-degree Fahrenheit jump, from 68 degrees to 86 degrees, decreased how long SARS lasted on steel surfaces by at least half. That’s because some coronaviruses, including this new one, have a viral envelope: a fat-layer that protects viral particles when traveling from person-to-person in the air. That sheath can dry out however, which kills the virus. So lower temperature, low wind, and a solid surface are all good for a coronavirus’ survival.
In studies of influenza viruses, porous items like clothes and wood didn’t contain the virus for longer than four hours. That’s because these items pull moisture away from the virus and cause it to degrade.
Tap water is also not a cause for concern, experts say, because any contamination would need to come via wastewater. Though the coronavirus has been found in feces, the virus has yet to actually be detected in wastewater, according to the CDC. Even if that were the case, U.S. water filtration is robust enough to kill coronaviruses.
Coronaviruses are enveloped viruses with a protective fat layer. Disinfectants tear apart that fat layer, which makes coronaviruses “fairly wimpy” compared to noroviruses and other common viruses that have a more robust protein shell.
____
Persistence of coronaviruses on inanimate surfaces and their inactivation with biocidal agents, February 2020:
Currently, the emergence of a novel human coronavirus, SARS-CoV-2, has become a global health concern causing severe respiratory tract infections in humans. Human-to-human transmissions have been described with incubation times between 2-10 days, facilitating its spread via droplets, contaminated hands or surfaces. Authors therefore reviewed the literature on all available information about the persistence of human and veterinary coronaviruses on inanimate surfaces as well as inactivation strategies with biocidal agents used for chemical disinfection, e.g. in healthcare facilities.
Most data were described with the endemic human coronavirus strain (HCoV-) 229E. On different types of materials it can remain infectious for from 2 hours up to 9 days. A higher temperature such as 30°C or 40°C reduced the duration of persistence of highly pathogenic MERS-CoV, TGEV and MHV. However, at 4°C persistence of TGEV and MHV can be increased to ≥ 28 days. Few comparative data obtained with SARS-CoV indicate that persistence was longer with higher inoculate. Contamination of frequent touch surfaces in healthcare settings are therefore a potential source of viral transmission. Data on the transmissibility of coronaviruses from contaminated surfaces to hands were not found. However, it could be shown with influenza A virus that a contact of 5 s can transfer 31.6% of the viral load to the hands.
The analysis of 22 studies reveals that human coronaviruses such as Severe Acute Respiratory Syndrome (SARS) coronavirus, Middle East Respiratory Syndrome (MERS) coronavirus or endemic human coronaviruses (HCoV) can persist on inanimate surfaces like metal, glass or plastic for up to 9 days, but can be efficiently inactivated by surface disinfection procedures with 62–71% ethanol, 0.5% hydrogen peroxide or 0.1% sodium hypochlorite within 1 minute. Other biocidal agents such as 0.05–0.2% benzalkonium chloride or 0.02% chlorhexidine digluconate are less effective. As no specific therapies are available for SARS-CoV-2, early containment and prevention of further spread will be crucial to stop the ongoing outbreak and to control this novel infectious thread.
_____
Effectiveness of Hand Sanitizer constituents against SARS-CoV-2, April 2020:
Having previously shown that the WHO-recommended formulations were effective in significantly reducing titers of two previously recognized virulent coronaviruses, SARS and MERS, researchers have now tested the virucidal activity of these disinfectants in vitro against SARS-CoV-2, the etiologic agent of COVID-19. Formulation I consist of 80% (wt/wt) ethanol, 0.725% (vol/vol) glycerol, and 0.125% (vol/vol) hydrogen peroxide. Formulation II contains 75% (wt/wt) 2-propanol with the identical amounts of glycerol and hydrogen peroxide used in formulation I. Suspensions of SARS-CoV-2 titers were exposed to dilutions of these formulations for 30 seconds and were then used to infect cells in tissue culture. The decrease in infectivity was measured for each concentration of each disinfectant. Both formulations efficiently inactivated the virus. Moreover, they retained complete virucidal activity at concentrations ≥30%. The alcohol active ingredients found in commercially available hand sanitizers, even when diluted, are effective in killing SARS-CoV-2 in vitro.
While these are in vitro studies and cannot precisely mimic the conditions of hand sanitizing, such as presence of dirt and shorter exposure times that might limit effectiveness, they provide some assurance that we are reducing viral load when we use these agents.
______
Soap vs. alcohol as SARS-CoV-2 disinfectant:
Alcohol-based disinfectants are effective, but soap is a highly efficient way of killing the virus when it’s on your skin. Each virus particle consists of a small set of genes, enclosed by a sphere of fatty lipid molecules, and because lipid shells are easily torn apart by soap, 20 seconds of thorough hand-washing can take one down. The virus is a self-assembled nanoparticle in which the weakest link is the lipid (fatty) bilayer. Soap dissolves the fat membrane and the virus falls apart like a house of cards and comes inactive and non-viable.
Washing the virus off with water alone might work. But water is not good at competing with the strong, glue-like interactions between the skin and the virus. Water isn’t enough. Soapy water is totally different. Soap contains fat-like substances known as amphiphiles, some of which are structurally very similar to the lipids in the virus membrane. The soap molecules “compete” with the lipids in the virus membrane. This is more or less how soap also removes normal dirt from the skin. The soap not only loosens the “glue” between the virus and the skin but also the Velcro-like interactions that hold the proteins, lipids and RNA in the virus together.
Alcohol-based products, which pretty much includes all “disinfectant” products, contain a high-percentage alcohol solution (typically 60-80% ethanol) and kill viruses in a similar fashion. But soap is better because you only need a fairly small amount of soapy water, which, with rubbing, covers your entire hand easily. Whereas you need to literally soak the virus in ethanol for a brief moment, and wipes or rubbing a gel on the hands does not guarantee that you soak every corner of the skin on your hands effectively enough.
So, soap is the best, but do please use alcohol-based sanitizer when soap is not handy or practical.
______
Coronavirus Ultraviolet Susceptibility:
Ultraviolet light can be an effective measure for decontaminating surfaces that may be contaminated by the SARS-CoV-2 virus by inducing photodimers in the genomes of microorganisms. Ultraviolet light has been demonstrated to be capable of destroying viruses, bacteria and fungi in hundreds of laboratory studies (Kowalski 2009). The SARS-CoV-2 virus has not yet been specifically tested for its ultraviolet susceptibility but many other tests on related coronaviruses, including the SARS coronavirus, have concluded that they are highly susceptible to ultraviolet inactivation.
It is estimated that the SARS-CoV-2 virus can survive on surfaces for up to 9 days, based on its similarity to SARS and MERS. Standard disinfectants are effective against SARS-CoV-2 but as an extra level of protection, and to shield against errors in the manual disinfection process, ultraviolet light can be used to disinfect surfaces and equipment after the manual chemical disinfection process is completed. ASHRAE recommends ultraviolet germicidal irradiation as one strategy to address COVID-19 disease transmission (ASHRAE 2020). COVID-19 is highly contagious and so any residual contamination, no matter how small, can pose a threat to healthcare workers and patients.
_
Table below summarizes the results of studies that have been performed on Coronaviruses under ultraviolet light exposure, with the specific species indicated in each case. The D90 value indicates the ultraviolet dose for 90% inactivation. Although there is a wide range of variation in the D90 values, this is typical of laboratory studies on ultraviolet susceptibility. The range of D90 values for coronaviruses is 7-241 J/m^2 the mean of which is 67 J/m^2, should adequately represent the ultraviolet susceptibility of the SARS-CoV2 (COVID-19) virus.
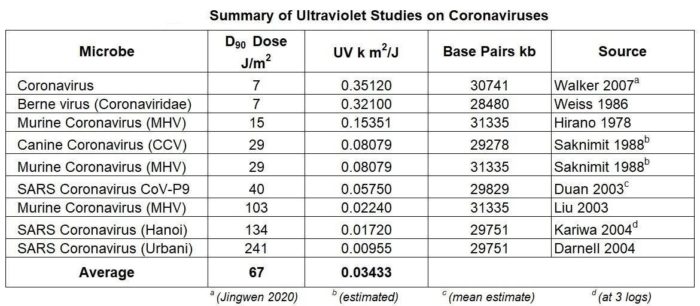
_
Concentrated form of UVC is now on the front line in the fight against Covid-19. In China, whole buses are being lit up by the ghostly blue light each night, while UVC-emitting robots have been cleaning floors in hospitals. Banks have even been using the light to disinfect their money.
But there’s a major caveat. It can take hours to get sunburn from UVB, but with UVC it takes seconds. To use UVC safely, you need specialist equipment and training. The World Health Organization (WHO) has issued a stern warning against people using UV light to sterilize their hands or any other part of their skin.
_____
N95 sterilization with gamma radiation:
Irradiating N95 masks with gamma radiation reduces their ability to filter air particles — even when relatively low doses are used — according to a study in JAMA Network Open. Researchers irradiated three different models of N95 masks (doses ranged from 1 to 50 kGy of 1.3 MeV gamma radiation). After irradiation, all masks passed a fit test. The masks were then placed in an air duct, through which ambient particulate matter was passed. The masks’ filtration efficiency was significantly reduced by all radiation doses. The researchers note: “These findings suggest that a qualitative fit test alone is unable to fully assess mask integrity and that at the doses required for sterilization, gamma radiation degrades the filtration efficiency of N95 masks.”
______
______
Section-7
Asymptomatic and pre-symptomatic transmission:
_
The biological details of transmission of betacoronaviruses are known in general terms: these viruses can pass from one individual to another through exhaled droplets, aerosol, contamination of surfaces, and possibly through fecal-oral contamination. There are four categories of transmission:
- Symptomatic transmission: direct transmission from a symptomatic individual, through a contact that can be readily recalled by the recipient.
- Pre-symptomatic transmission: direct transmission from an individual that occurs before the source individual experiences noticeable symptoms. (Note that this definition may be context specific, for example based on whether it is the source or the recipient who is asked whether the symptoms were noticeable.)
- Asymptomatic transmission: direct transmission from individuals who never experience noticeable symptoms. This can only be established by follow-up, as single time-point observation cannot fully distinguish asymptomatic from pre-symptomatic individuals.
- Environmental transmission: transmission via contamination, and specifically in a way that would not typically be attributable to contact with the source in a contact survey (i.e., this does not include transmission pairs who were in extended close contact, but for whom in reality the infectious dose passed via the environment instead of more directly). These could be identified in an analysis of spatial movements.
____
The existence of many asymptomatic carriers, presymptomatic patients, and patients with very mild symptoms posts a huge challenge to infection control, as the transmission of SARS-CoV-2 from these people to susceptible groups would be difficult to prevent. The number of people infected with SARS-CoV-2 could be underestimated. However, existing evidence suggests that the risk might probably be lower than expected. First, asymptomatic carriers are not common. In the first family cluster that was carefully studied, only one of the six family members was found to be asymptomatic or present with non-specific and mild symptoms with the typical ground-glass opacities in only one but not both lungs. Second, the transmission of SARS-CoV-2 from asymptomatic carriers and presymptomatic patients could be even less common, if their viral loads are low and virus shedding is not substantial. The key questions concern how often asymptomatic and presymptomatic virus shedding might occur as well as whether their viral loads could be high.
Asymptomatic carriers of other HCoVs including 229E, OC43, NL63, and HKU1 have been well documented. Importantly, the detection rate of the virus in this group was lower and viral loads were much lower compared to patients with upper respiratory tract symptoms. This is generally consistent with the notion that asymptomatic or presymptomatic shedding of SARS-CoV-2 might be less common than some estimates such as half to half. In this regard, epidemiological studies to determine the percentages of asymptomatic carriers and in selected large cohorts of subjects in Wuhan should help clarify the role of asymptomatic virus shedding in SARS-CoV-2 transmission. This analysis will also rule in or rule out our prediction that asymptomatic virus shedding exists but is uncommon. Since patients with non-specific and mild symptoms as well as asymptomatic carriers can go undetected easily, the chance that SARS-CoV-2 will be established in humans is increased. It will likely become either endemic in some regions or pandemic.
Theoretically, asymptomatic carriers might arise when host antiviral defence is either strong or decoupled. When the immune response effectively limits but could not completely block SARS-CoV-2 replication, asymptomatic shedding might occur. In this scenario, the risk of transmitting to others is relatively low because of a low viral load. Alternatively, if the immune response against SARS-CoV-2 is decoupled from viral replication as in the infection of natural primate hosts with SIVs, the viral load would be higher, posing a higher risk for person-to-person transmission. A careful quantitative analysis of the replication dynamics of SARS-CoV-2 in asymptomatic carriers over time is required to clarify the validity of the two models.
_____
Traditional infection-control and public health strategies rely heavily on early detection of disease to contain spread. When Covid-19 burst onto the global scene, public health officials initially deployed interventions that were used to control severe acute respiratory syndrome (SARS) in 2003, including symptom-based case detection and subsequent testing to guide isolation and quarantine. This initial approach was justified by the many similarities between SARS-CoV-1 and SARS-CoV-2, including high genetic relatedness, transmission primarily through respiratory droplets, and the frequency of lower respiratory symptoms (fever, cough, and shortness of breath) with both infections developing a median of 5 days after exposure. However, despite the deployment of similar control interventions, the trajectories of the two epidemics have veered in dramatically different directions. Within 8 months, SARS was controlled after SARS-CoV-1 had infected approximately 8100 persons in limited geographic areas. Within 5 months, SARS-CoV-2 has infected more than 2.6 million people and continues to spread rapidly around the world.
What explains these differences in transmission and spread?
A key factor in the transmissibility of Covid-19 is the high level of SARS-CoV-2 shedding in the upper respiratory tract, even among presymptomatic patients, which distinguishes it from SARS-CoV-1, where replication occurs mainly in the lower respiratory tract. Viral loads with SARS-CoV-1, which are associated with symptom onset, peak a median of 5 days later than viral loads with SARS-CoV-2, which makes symptom-based detection of infection more effective in the case of SARS CoV-1. With influenza, persons with asymptomatic disease generally have lower quantitative viral loads in secretions from the upper respiratory tract than from the lower respiratory tract and a shorter duration of viral shedding than persons with symptoms, which decreases the risk of transmission from paucisymptomatic persons (i.e., those with few symptoms).
____
The first confirmation that the novel coronavirus could be transmitted by asymptomatic people came in February, when a case study described a 20-year-old woman from Wuhan, China, who passed the coronavirus to five family members but never got physically sick herself. A World Health Organisation report about the coronavirus outbreak in China, published in February, found few instances in which a person who tested positive never showed any symptoms. Instead, most people who were asymptomatic on the date of their diagnosis (a relatively small group anyway) went on to develop symptoms later. “The proportion of truly asymptomatic infections is unclear but appears to be relatively rare,” the report authors wrote. In the WHO study, 75 percent of people in China who were first classified as asymptomatic later developed symptoms. That means, technically, “presymptomatic transmission” is what’s probably common. Other research has reaffirmed these findings. A CDC study of coronavirus patients in a nursing home in Washington state’s King County found that of 23 people who tested positive, only 10 showed symptoms on the day of their diagnosis. Ten people in the other group developed symptoms a week later.
The CDC also evaluated coronavirus patients on the Diamond Princess cruise ship, which was quarantined in Japan in February. Of the 3,711 people onboard, 712 tested positive, but almost 50 percent of them had no symptoms at the time.
One potential group of asymptomatic carriers could be children. Thus far, children are among those least sickened by the coronavirus – but some could be getting very mild infections then spreading the virus. Research published in the journal The Lancet looked at 36 children who tested positive for coronavirus between January 17 and March 1 in three Chinese hospitals. Half of those children had “mild disease with no presenting symptoms,” the authors wrote. Another study, which has yet to be peer-reviewed, found that 56 percent of 700 children infected with COVID-19 in China had mild, if any, symptoms. John Williams, an expert in pediatric infectious disease at University of Pittsburgh Medical Centre, told ABC that “asymptomatic infection is common in children, occurring in 10-30 percent” of cases.
Several studies have shown now that people infected with the new coronavirus are most contagious about one to three days before they begin to show symptoms. This presymptomatic transmission was not true of the coronaviruses that caused SARS and MERS.
____
Presymptomatic SARS-CoV-2 Infections and Transmission in a Skilled Nursing Facility, April 2020:
Rapid and widespread transmission of SARS-CoV-2 was demonstrated in this skilled nursing facility. More than half of residents with positive test results were asymptomatic at the time of testing and most likely contributed to transmission. Infection-control strategies focused solely on symptomatic residents were not sufficient to prevent transmission after SARS-CoV-2 introduction into this facility.
____
Presymptomatic Transmission of SARS-CoV-2 — Singapore, January 23–March 16, 2020:
Preliminary evidence indicates the occurrence of presymptomatic transmission of SARS-CoV-2, based on reports of individual cases in China.
Investigation of all 243 cases of COVID-19 reported in Singapore during January 23–March 16 identified seven clusters of cases in which presymptomatic transmission is the most likely explanation for the occurrence of secondary cases.
The possibility of presymptomatic transmission increases the challenges of containment measures. Public health officials conducting contact tracing should strongly consider including a period before symptom onset to account for the possibility of presymptomatic transmission. The potential for presymptomatic transmission underscores the importance of social distancing, including the avoidance of congregate settings, to reduce COVID-19 spread.
________
China data shows vast majority of asymptomatic coronavirus carriers never get sick: April 15, 2020:
China for the first time publicized a breakdown of people testing positive for the novel coronavirus without outward signs of being sick, revealing that those among them who remain symptom-free throughout infection are in the majority. Among 6,764 people who tested positive for infection without showing symptoms, only one fifth of them — 1,297 — have so far developed symptoms and been re-classified as confirmed cases. Some 1,023 are were monitored in medical quarantine to see if they develop symptoms. The rest — 4,444 — have been discharged from medical observation after recovering from the virus.
The phenomenon of asymptomatic transmission is a puzzling feature of the virus that’s allowed the pandemic to spread wider and faster than previous outbreaks. While researchers earlier thought that most patients ultimately end up developing symptoms, the indication from China’s data that a sizable group remains symptom-free throughout infection underscores the challenge of containing the widening pandemic.
Researchers are still struggling to understand asymptomatic cases: there’s a possibility that patients who appear to be symptom-free are actually just manifesting symptoms that doctors don’t know yet to look for. For months, a fever and dry cough were understood to be the disease’s main markers, and it’s only recently emerged that a loss of smell and taste is also a sign of infection. China has not disclosed the range of symptoms it looks for.
The number of asymptomatic infections is likely higher than the 6,764 China has detected. These cases were found through efforts to test the contacts of confirmed patients. Otherwise, those who show no signs of being sick have no reason to seek out testing on their own.
_______
Asymptomatic people may be fueling the coronavirus spread:
For every person who tests positive, there’s likely another handful of asymptomatic people who don’t know they’re infected. For every person who tested positive for the coronavirus in China, there were likely another five to eight asymptomatic people who didn’t know they had the infection, according to a new study. What’s more, these undocumented cases likely infected the majority of known — and thus likely more severe — cases.
To figure out just how many COVID-19 cases went undocumented, a group of researchers from five institutions across the world crunched the early numbers from China, where the outbreak first began. The researchers created a mathematical model that analyzed the number of infections in 375 Chinese cities. Their model included travel time and distance traveled for people who participated in the country’s Chunyan, or Spring Festival Period — which began Jan. 10 — by analyzing data from 2018. They then simulated observations between Jan. 10 and Jan. 23 from this year before China implemented travel restrictions.
Based on the model, during this time period, China should have had 86% more cases of COVID-19 than what the country had reported. And those undocumented cases were about half as likely as the documented cases to infect another person. Part of the reason is that people with mild cases or asymptomatic cases likely have lower amounts of virus in their systems that they could shed. However another study, though small in size, found that the coronavirus might be most infectious when symptoms are mildest. The other reason is that these people sneeze and cough less than people with more severe diseases.
Yet, their modeling showed that because there were so many undocumented cases, these people were the source of infection for 79% of all documented cases before Jan. 23. The virus has the potential to spread through the air and so could be spread just by speaking to an infected person; it can also spread by touching a surface that was contaminated by an infected individual.
That means that even health care professionals who are caring for these patients carry the risk of spreading the coronavirus, especially without having access to proper gear. Asymptomatic cases, no matter whether they are health care workers or not, can be contagious.
Recently, Dr. Robert Redfield, director of the Centers for Disease Control and Prevention (CDC) said that 1 in 4 people with COVID-19 could be asymptomatic in the U.S. So while the exact numbers in the U.S. aren’t yet clear, social distancing need to be continued. Once testing becomes more widespread, we can switch to the other strategy of isolating the infected people rather than everybody.
_____
A third of coronavirus cases may be ‘silent carriers’, classified Chinese data suggests:
The number of “silent carriers” – people who are infected by the new coronavirus but show delayed or no symptoms – could be as high as one-third of those who test positive, according to classified Chinese government data seen by the South China Morning Post. More than 43,000 people in China had tested positive for Covid-19 by the end of February but had no immediate symptoms, a condition typically known as asymptomatic, according to the data. They were placed in quarantine and monitored but were not included in the official tally of confirmed cases, which stood at about 80,000 at the time. One obstacle is that countries tally their confirmed cases differently. The World Health Organisation classifies all people who test positive as confirmed cases regardless of whether they experience any symptoms. South Korea also does this. But the Chinese government changed its classification guidelines on February 7, counting only those patients with symptoms as confirmed cases. The United States, Britain and Italy simply do not test people without symptoms, apart from medical workers who have prolonged exposure to the virus.
The approach taken by China and South Korea of testing anyone who has had close contact with a patient – regardless of whether the person has symptoms – may explain why the two Asian countries seem to have checked the spread of the virus. Hong Kong is extending testing to airport arrivals in the city, even if travellers have no symptoms. Meanwhile in most European countries and the US, where only those with symptoms are tested, the number of infections continues to rapidly rise.
A growing number of studies are now questioning the WHO’s earlier statement that asymptomatic transmission was “extremely rare”. A report by the WHO’s international mission after a trip to China estimated that asymptomatic infections accounted for 1 to 3 per cent of cases, according to a European Union paper.
“The number of novel coronavirus (Covid-19) cases worldwide continues to grow, and the gap between reports from China and statistical estimates of incidence based on cases diagnosed outside China indicates that a substantial number of cases are underdiagnosed,” a group of Japanese experts led by Hiroshi Nishiura, an epidemiologist at Hokkaido University, wrote in a letter to the International Journal of Infectious Diseases in February. Based on their research, Nishiura put the proportion of asymptomatic Japanese patients evacuated from Wuhan, ground zero of the outbreak in China, at 30.8 per cent – similar to the classified Chinese government data.
But official figures from South Korea – which had carried out nearly 300,000 tests on all close contacts of its confirmed cases – are the most comparable to China’s. More than 20 per cent of the asymptomatic cases reported to the Korea Centres for Disease Control and Prevention remained without symptoms until they were discharged from hospital. “Korea currently has a significantly higher rate of asymptomatic cases than other countries, perhaps due to our extensive testing,” Jeong Eun-kyeong, director of South Korea’s CDC, told a press briefing on March 16. Another useful point of reference is the data collected from the Diamond Princess cruise ship, which was quarantined for weeks in Yokohama, Japan. All of its passengers and crew were tested, with 712 people testing positive – 334 of whom were asymptomatic, according to official Japanese figures.
An EU report has put the proportion of asymptomatic cases in Italy at 44 per cent, but in most parts of the country people without symptoms are not tested.
______
Universal Screening for SARS-CoV-2 at Delivery could identify many Asymptomatic Women, April 2020:
In areas with high rates of novel coronavirus disease (COVID-19), universal testing for SARS-CoV-2 in pregnant women admitted for delivery could identify many infections that would be missed based on symptoms alone, according to findings in the New England Journal of Medicine. From March 22 to April 4, some 215 women delivered babies at a New York City health system. Of these, four had symptoms at admission and tested positive for SARS-CoV-2. Of the remaining 211 asymptomatic women, 210 had nasopharyngeal swabs taken, and 14% (29 women) were positive for SARS-CoV-2. Therefore, nearly 90% of women who were positive at admission were asymptomatic. The authors write, “The potential benefits of a universal testing approach include the ability to use COVID-19 status to determine hospital isolation practices and bed assignments, inform neonatal care, and guide the use of personal protective equipment. Access to such clinical data provides an important opportunity to protect mothers, babies, and health care teams during these challenging times.”
______
COVID-19 antibody study adds further support for a higher-than-suspected infection rate, April 2020:
A new study conducted by the University of Southern California along with the LA County Department of Public Health indicates the presence of antibodies for COVID-19 in between 2.8 and 5.6% of the population of LA County, suggesting that between 221,000 and 442,000 individuals had the infection — up to 55 times more people than have been confirmed via testing. This is the second antibody study in a short span of time in California that suspects infections are far more widespread than previously thought, and a good justification for continued social distancing measures.
The LA County study does contain some good news, if the antibody testing proves to be accurate (we aren’t entirely sure what they show for sure at this point, especially in terms of immunity), in that the mortality rate of the infection is actually much lower than the official diagnosed case data would suggest. The infection rate found via antibody testing through the USC study is also remarkably close to the rate found in a Stanford study published recently about the number of infections in Santa Clara County, which found that between 48,000 and 81,000 people in that part of California could’ve had and recovered from the infection.
Whereas the LA study found around 2.8 to 5.6% had antibodies, accounting for the margin of error and extrapolating from results to the entire population, the Stanford research found between 2.5 and 4.2% of residents carry antibodies for the infection. Those numbers are based on the test kits’ performance, as well as the demographic makeup of the sample population tested.
Neither new research papers have yet been peer-reviewed, so it’s worth taking them with a grain of salt. But the close alignment between the numbers in both, along with early results from similar studies being conducted globally, does seem to suggest that the number of actual cases of COVID-19 far undershoots the published numbers, which typically only include confirmed diagnoses — most of which represent individuals showing moderate to severe symptoms. The higher rate of undetected infection definitely should not be taken as a sign that COVID-19 is less serious than it appeared, however; this new info only means that its transmission from people who showed no outward symptoms and subsequently never sought any medical care or were identified for quarantine or contact tracing is probably a lot higher than anyone guessed. That means social distancing measures are more important than ever, as it’s likely harder than ever to identify who might be a passive carrier of the virus that leads to COVID-19 without realizing it. Eventually, understanding the nature of the spread should help with refining measures to avoid the greatest potential risks of exposure, but for now, this new info just means that COVID-19 is much more effective at moving through a population without raising early warning signs than we previously understood.
_______
_______
Section-8
Mask useful?
_
How big are Coronavirus Particles?
First things first: we need to know how big the coronavirus is. Scientists have already used electron microscopes to measure how big the corona virus is. Coronavirus particles are spheres with diameters of approximately 0.12 microns (120 nm). The smallest particles are 0.06 microns, and the largest are 0.14 microns. This means coronavirus particles are smaller than the PM2.5 cutoff, but bigger than some dust particles and gases. Size of aerosol containing SARS-CoV-2 is < 5 micron and the size of droplet containing virus is > 5 micron and it could be as large as 50 microns. Both aerosol and droplets are involved in covid-19 transmission.
_
Bio aerosols include microorganisms (cultivable, non-cultivable or dead such as bacteria, fungi and viruses) and metabolic particles of living organisms (such as endotoxins and mycotoxins). These particles are very small and therefore can suspend in air for a long time. As a result, the risk of exposure to these particles is high. If the particles are pathogenic, they can easily cause different diseases for people exposed to them. The most important risk of these particles for people exposed to them is the outbreak of infectious diseases. Hospitals and medical centers are among the important places in which there is a high level of bio aerosols and therefore the suspension of these particles in their environment could result in infections and diseases. The patients, health care personnel, operating room personnel and visitors are among those with the highest exposure to these pollutants. The statistics show that 1 out of 10 patients who remain in hospital are infected by this aerosol. The reduction of postoperative infections is the duty of all those who are working in the operating room including surgeons, anesthesiologists, assistant surgeon and nurses. To reduce these risks people involved need to employ the infection control strategies. One of the best strategies to control postoperative infections is to use surgical masks. The surgical masks have been employed for different purposes, e.g. their use by patients to prevent the spread of contaminated respiratory secretions to others; their use by health care personnel to avoid contamination with patients’ saliva and wound; their use by health care personnel to avoid contamination of wounds as well as keeping hands and fingers away from the mouth and nose pollution.
_
The pore size of masks has a great influence of filtration rate. The average size of pores in the masks are estimated between16 and 51 micron and the smaller masks’ pores, higher the filtration rate. The particles’ size is one of the factors affecting their penetration rate through surgical masks and the penetration rate of particles through surgical masks is different depending on their size. The flow rate and the number of mask layers are among other factors affecting particulate filtration, while air resistance as another important factor as well. The best mask is the one that has the highest efficiency and lowest pressure drop.
_____
A facemask is a loose-fitting, disposable device that creates a physical barrier between the mouth and nose of the wearer and potential contaminants in the immediate environment. They are generally labelled as surgical, isolation, dental or medical procedure masks. On the other hand, respirators are personal air purifiers. They are designed to protect the wearer from inhaling dangerous substances such as toxic chemicals and infectious particles. Respirators are designed to help reduce the wearer’s respiratory exposure to airborne contaminants such as particles that are small enough to be inhaled – particles less than 100 microns (μm) in size. A face masks or a respirator consist entirely or substantially of filter material or comprises a face piece in which the main filter(s) form an inseparable part of the device. Filtering face piece particulate respirators and facemasks are widely utilized for reducing inhalation exposure to airborne particles that may be associated with various health effects. They are considered to prevent or slow down the transmission of airborne particles possibly causing adverse health effects.
A conventional face mask consists of one, two or three layers of flat or pleated fabric, affixed to the head with ear loops. A surgical mask is generally used as a physical barrier to body fluids and larger droplets in healthcare activities. The most common facemasks are the surgical masks but the main differences are; simple face masks are not used to prevent infectious diseases but a surgical mask should have a minimum of 80% bacteria filtration efficiency, a conventional face mask consists of one, two or three layers of flat or pleated fabric, usually made from paper or cotton fabric but a “surgical mask” is made of at least a three-ply layer of material like polypropylene. Surgical face masks are made with non-woven fabric, which has better bacteria filtration and air permeability while remaining less slippery than woven cloth. The material most commonly used to make them is polypropylene, either 20 or 25 grams per square meter (gsm) in density. Nonwoven fabrics are made of individual fibers or filaments that are bound together mechanically, thermally or chemically. They are not knit or woven together, like most cotton. However surgical masks do not have either adequate filtering or fitting attributes to provide respiratory protection for the wearer. They are not intended to be used more than once and are usually designed to help prevent contamination of the work environment or sterile field from large particles generated by the wearer (e.g. spit, mucous). Surgical masks may also be used to help reduce the risk of splashes or sprays of blood, body fluids, secretions and excretions from reaching the wearer’s mouth and nose.
Usually fiber blend is used to balance filtration efficiency and pressure drop. High pressure drop across a filter translates to the undesired high energy consumption to drive air flow through the filter. When fiber size is reduced the total filtration efficiency becomes higher. The increase in filtration efficiency is due to the large surface area per volume available for particle capture, especially for small submicron meter particles. This encouraged a wave of small fiber innovation and commercialization that boost the filtration industry starting from early 1980s and leads to the development of nanofibrous filtering media.
_____
What Masks Do:
Depending on the design, masks can limit the spread of a disease from an infected person in what’s called source control, and/or they can protect the wearer from becoming infected. In the case of COVID-19, transmission of the virus is thought to occur primarily through respiratory droplets, which can land in other people’s mouths or noses when infected people cough or sneeze. The droplets can also contaminate surfaces that others then touch before touching their faces. Here, basic surgical masks — loose-fitting, disposable masks — might be helpful because if someone who is sick is wearing one, their infectious droplets could be trapped in the mask. Doctors and nurses wearing such masks may also be protected somewhat since they’re likely to be coughed or sneezed on. But researchers also suspect the novel coronavirus, SARS-CoV-2, can linger in the air in very small droplets known as aerosols, which can be inhaled by people nearby. Respirators include the oft-cited N95 masks, which are disposable, tight-fitting masks that create a seal on the face and include a specialized filter that captures at least 95% of the airborne particles that pass through it. In contrast to the N95s, surgical masks are not intended to provide protection against aerosols. As a CDC blog explains, surgical masks “are designed to provide barrier protection against droplets, however they are not regulated for particulate filtration efficiency and they do not form an adequate seal to the wearer’s face to be relied upon for respiratory protection.”
____
Surgical masks are cleared by the Food and Drug Administration (FDA). FDA does not do any testing; but reviews the information supplied by the manufacturers in their 510(k) premarket application. Manufacturers submit test results for fluid resistance, filtration efficiency for polystyrene latex and Staphylococcus aureus bacterial aerosol particles, differential pressure and flammability for Surgical masks clearance usually in accordance with ASTM F2100-11. ASTM F2100-11 specification covers testing and requirements for materials used in the construction of medical face masks that are used in providing health care services such as surgery and patient care. It provides performance classes for face mask materials as bacterial filtration efficiency (ASTM F2101), sub-micron particulate filtration efficiency (ASTM F2299), differential pressure (MIL-M-36954C), fluid penetration resistance (ASTM F1862) and flammability (16 CFR Part 1610).
Medical face mask materials covered under this specification shall be designed as one or more of the following performance classes as based on the barrier performance properties of the materials used in medical face masks: Level 1 Barrier, Level 2 Barrier, and Level 3 Barrier. The properties of the medical face mask material shall conform to the specifications requirements in Table below.
Medical Face Mask Material Requirement By Performance (ASTM F2100-11)
|
Characteristic |
Level 1 Barrier
|
Level 2 Barrier |
Level 3 Barrier |
|
Bacterial filtration efficiency, % |
≥95 |
≥98 |
≥98 |
|
Differential pressure, mm H2O/cm2 |
<4.0 |
<5.0 |
<5.0 |
|
Sub-micron particulate filtration efficiency at 0.1 micron, % |
≥95 |
≥95 |
≥95 |
|
Resistance to penetration by synthetic blood, |
80 |
120 |
160 |
|
Flame spread |
Class 1 |
Class 1 |
Class 1 |
_
In the United States, the National Institute for Occupational Safety and Health (NIOSH) tests the filtration efficiency of particulate filtering, air-purifying respirators for certification purposes. NIOSH approves N-, R-, and P-series nonpowered air-purifying respirators, each at 95, 99, and 99.97% filtration efficiency levels under 42 CFR Part 84 as shown in Table below.
NIOSH 42 CFR Part 84 Particle Filter Classification:
|
Minimum Efficiency |
N-Series |
R-Series |
P-Series |
|
95% |
N95 |
R95 |
P95 |
|
99% |
N99 |
R99 |
P99 |
|
99.97% |
N100 |
R100 |
P100 |
According to NIOSH 42 CFR 84, the three efficiency levels are 95, 99, and 99.97%, tested at a flow rate of 85 L/min at the most penetrating particle size (generally about 0.1 to 0.3 μm). The three degradation resistance series were established by the choice of either charge-neutralized NaCl (sodium chloride salt), which is only mildly degrading to filter media (N series of filters), or DOP (dioctyl phthalate) liquid oil, which is highly degrading (R or P series). Then filters are rated as N, R and P series to indicate the filters are ‘not oil resistant’, ‘resistant to oil’ and ‘oil proof’ respectively. Accordingly, N series filters tested with NaCl aerosol are recognized as not highly resistant to degradation and only appropriate for use with solid aerosol in the workplace.
Among the respirators certified under 42 CFR Part 84, the N95 respirators are the most commonly used. Because the filter efficiency is based on the physical parameters of the particles to be filtered, any biologic particles can be expected to be filtered at no less efficiency than the test aerosol (i.e., at least 95% efficient for an N95 filter. The penetration, P, of such particles through a certified N95 respirator cannot exceed 5%; thus, the efficiency, E, of the respirator, which is calculated as E = 100% – P, must be at least 95%.
______
Filtration mechanisms:
The filters used in modern surgical masks and respirators are considered “fibrous” in nature—constructed from flat, nonwoven mats of fine fibers. Fiber diameter, porosity (the ratio of open space to fibers) and filter thickness all play a role in how well a filter collects particles. In all fibrous filters, three “mechanical” collection mechanisms operate to capture particles: inertial impaction, interception, and diffusion. Inertial impaction and interception are the mechanisms responsible for collecting larger particles, while diffusion is the mechanism responsible for collecting smaller particles. In some fibrous filters constructed from charged fibers, an additional mechanism of electrostatic attraction also operates. This mechanism aids in the collection of both larger and smaller particle sizes. This latter mechanism is very important to filtering facepiece respirator filters (N95) that meet the stringent NIOSH filter efficiency and breathing resistance requirements because it enhances particle collection without increasing breathing resistance.
Diagram below illustrates the filtration mechanisms of inertial impaction, interception, diffusion, and electrostatic attraction. In each case, fibers are shown filtering particles.
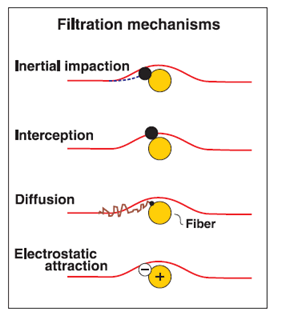
_
There is a particle size at which none of the “mechanical” collection mechanisms (interception, impaction, or diffusion) is particularly effective. This “most penetrating particle size” (MPPS) marks the best point at which to measure filter performance. If the filter demonstrates a high level of performance at the MPPS, then particles both smaller and larger will be collected with even higher performance. This is perhaps the most misunderstood aspect of filter performance and bears repeating. Filters DO NOT act as sieves. One of the best tests of a filter’s performance involves measuring particle collection at its most penetrating particle size, which ensures better performance for larger and smaller particles. Further, the filter’s collection efficiency is a function of the size of the particles, and is not dependent on whether they are bioaerosols or inert particles.
______
Performance of surgical mask and respirator filters:
Respirator filters that collect at least 95% of the challenge aerosol are given a 95 rating. Those that collect at least 99% receive a “99” rating. And those that collect at least 99.97% (essentially 100%) receive a “100” rating. Respirator filters are rated as N, R, or P for their level of protection against oil aerosols. This rating is important in industry because some industrial oils can remove electrostatic charges from the filter media, thereby degrading (reducing) the filter efficiency performance. Respirators are rated “N” if they are not resistant to oil, “R” if somewhat resistant to oil, and “P” if strongly resistant (oil proof). Thus, there are nine types of particulate respirator filters:
N95, N-99, and N-100
R-95, R-99, and R-100
P-95, P-99, and P-100
In studies comparing the performance of surgical mask filters using a standardized airflow, filter performance has been shown to be highly variable. Collection efficiency of surgical mask filters can range from less than 10% to nearly 90% for different manufacturers’ masks when measured using the test parameters for NIOSH certification. Published results on the FDA-required tests (if available) are not predictive of their performance in these studies. It is important to keep in mind that overall performance of any facepiece for particulate filtering depends, first, on good filter performance. A facepiece or mask that fits well to the face but has a poor filter will not be able to provide a high level of protection.
___
Respirator and Surgical Mask Fit:
Because respirator filters must meet stringent certification requirements, they will always demonstrate a very high level of collection efficiency for the broad range of aerosols encountered in workplaces. There has been some recent concern that respirator filters will not collect nano-sized particles, but research has demonstrated that such particles are collected with efficiencies that meet NIOSH standards. This is not surprising, because NIOSH tests employ small, charge-neutralized, relatively monodisperse aerosol particles and a high airflow.
Thus, the most important aspect of a NIOSH-certified respirator’s performance will be how well it fits to the face and minimizes the degree of leakage around the facepiece. This must be measured for each individual and their selected respirator. Selecting the right respirator for a particular workplace exposure depends largely on selecting the right level of protection.
Respirator fit depends on two important design characteristics:
- Whether the respirator operates in a “negative pressure” or “positive pressure” mode
- The type of facepiece and degree of coverage on the face
Respirators that operate in a “negative pressure” mode require the wearer to draw air through an air-cleaning device (filter or chemical cartridge) into the facepiece, which creates a pressure inside the respirator that is negative in comparison to that outside the facepiece. A “positive pressure” respirator, on the other hand, pushes clean air into the facepiece through the use of a fan or compressor, creating a positive pressure inside the facepiece when compared to the outside. Negative pressure respirators inherently offer less protection than positive pressure respirators, because inward leakage occurs more easily in the former.
The facepiece design is also very important—some designs fit on the face better than others. It is more difficult to fit a half-facepiece respirator (one that covers the mouth and nose only) than a full-facepiece respirator (one that also covers the eyes). The nose and chin are the most difficult facial features on which to establish a tight fit. The fit of a hood, helmet or “loose-fitting” facepiece is highly dependent on the specific design and configuration.
Because fit is so important, NIOSH recommends and OSHA requires that each respirator wearer receive an initial fit test and annual fit tests thereafter. It is not possible to predict how well a respirator will fit on a particular face, even for respirators that fit well on a broad range of facial sizes. The FDA does not recommend or require any test of fit for surgical masks. A very limited number of published studies are available on this aspect of surgical mask performance.
_____
Comparing Surgical Masks and Surgical N95 Respirators:
The FDA regulates surgical masks and surgical N95 respirators differently based on their intended use.
A surgical mask is a loose-fitting, disposable device that creates a physical barrier between the mouth and nose of the wearer and potential contaminants in the immediate environment. These are often referred to as face masks, although not all face masks are regulated as surgical masks. Note that the edges of the mask are not designed to form a seal around the nose and mouth.
An N95 respirator is a respiratory protective device designed to achieve a very close facial fit and very efficient filtration of airborne particles. Note that the edges of the respirator are designed to form a seal around the nose and mouth. Surgical N95 Respirators are commonly used in healthcare settings and are a subset of N95 Filtering Facepiece Respirators (FFRs), often referred to as N95s.
The similarities among surgical masks and surgical N95s are:
They are tested for fluid resistance, filtration efficiency (particulate filtration efficiency and bacterial filtration efficiency), flammability and biocompatibility.
They should not be shared or reused.
_____
The table below outlines some of the key differences between respirators and surgical masks. Here N95 surgical masks are included in the general category of respirators.
|
Key Element |
Respirators |
Surgical Masks |
|
Evaluation, Testing, and Certification |
Respirators are evaluated, tested and certified by National Institute for Occupational Health and Safety (NIOSH) to meet set minimum performance requirements, including filter efficiency and breathing resistance.
|
Surgical mask manufacturers provide data and proposed claims to the Food and Drug Administration (FDA) in the United States of America for review. |
|
Purpose |
Respirators protect from exposure to airborne particles. In healthcare, protects from exposure to biological aerosols including viruses and bacteria. |
Surgical masks are a barrier to splashes, droplets, and spit. |
|
Fit (Face seal) |
Respirators are designed to seal tight to the face of the wearer. |
Surgical masks are not designed to seal tight against the face. |
|
Filtration |
Respirator filters that collect at least 95% of the challenge aerosol are given a 95 rating. |
Surgical masks do not effectively filter small particles from the air. |
|
Use Limitations |
Generally, single use. Should be discarded when it:
Some types of respirators can be reused (e.g., elastomeric masks). |
One-time use (one patient encounter). |
___
The following decision tree highlights potential considerations for the selection of respirators verses surgical/procedure masks.
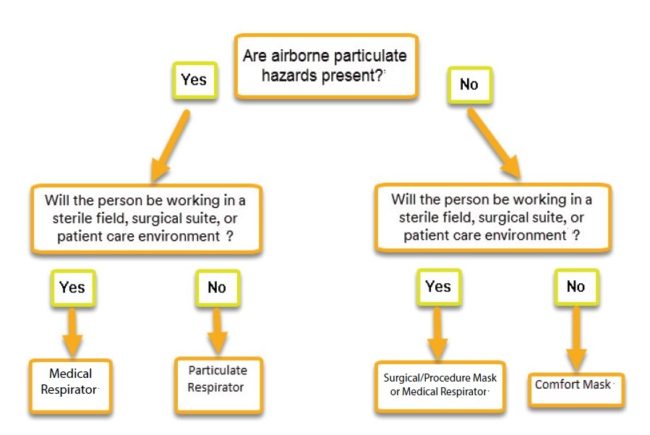
Here are some additional considerations to keep in mind when selecting a respirator for use in a healthcare work environment.
- Selection of respiratory protection for occupational hazards is typically based upon the airborne concentration of the substance that the wearer is exposed to and the occupational exposure limit (OEL) of that substance.
- Biological agents, such as viruses and bacteria, do not have OELs; therefore, employers should consider available guidance when selecting respirators. The U.S. Centers for Disease Control and Prevention (CDC) has recommended that respirators offering more protection, such as powered air purifying respirators (PAPRs), may be considered in situations when high exposures to bacteria and viruses are possible.
- The occupational use of respirators in the U.S. is regulated by the U.S. Occupational Safety and Health Administration (OSHA), and in the U.S., the use of respirators in all workplaces must be per OSHA standard 29 CFR 1910.134.
- Tight-fitting respirators such as disposable filtering facepiece particulate respirators cannot be worn with facial hair or anything else that may interfere with the seal of the respirator to the wearer’s face.
_____
Different Types of masks and respirators are shown in table below:
|
Face mask (cloth or paper masks) |
Surgical mask |
N95 respirator |
Surgical N95 respirator |
|
|
Is it a medical device? |
No |
Yes |
No |
Yes |
|
Size of pores |
100 to 1000 microns |
15 to 50 microns |
0.3 microns |
0.3 microns |
|
Purpose |
Prevents large particles expelled by you, the wearer, from reaching the environment. |
Prevents large particles expelled by you, the wearer when you are ill, from reaching the environment. To be used as a physical barrier to protect you from large droplets of blood or body fluids. |
Reduces your exposure to very small airborne particles or contaminants. May not protect against sprays and direct liquid splashes. |
Provides the protection of both a surgical mask and N95 respirator. To be used as a physical barrier from large droplets of blood or body fluids as well as very small particles (e.g. fine aerosolised droplets), such as those produced by coughing. |
|
Fit |
Does not fit tightly |
Does not fit tightly |
Tight fit |
Tight fit |
|
Filtration efficiency |
Bacterial filtration efficiency 30 % |
Bacterial filtration efficiency above 95% |
Minimum 95% against particulate aerosols (of 0.3 micron in size) free of oil |
Minimum 95% against particulate aerosols (of 0.3 micron in size) free of oil. |
|
Fluid resistance (i.e., resistance to penetration of bodily fluids) |
Not fluid resistant |
Yes |
Not tested for fluid resistance |
Tested to be fluid-resistant |
Table above shows sizes of pores of all kinds of masks and respirators. Since size of SARS-CoV-2 is 120 nm (0.12 micron), theoretically it can pass through any mask/respirator if they were floating alone. However, viruses are in droplets of size 15-20 microns and in aerosols of size 5 microns. Theoretically all of them will be blocked by N 95 filter. Surgical masks will partially block them. However, a 2019 study published in JAMA showed that the type of face mask didn’t make a big difference in the spread of flu. The study among 2,862 medical health workers spread across seven health centres in the US concluded: “Wearing N95 respirators versus medical masks” resulted in no significant difference in the incidence of laboratory-confirmed influenza. In another study published in the Journal of the American Dental Association in 2009, surgical masks appeared to be nearly as effective as N95 respirators in preventing influenza among healthcare workers in Canada. So theory and practice differ significantly as far as utility of mask is concerned.
______
Various studies on various masks:
- In 2014 study, researchers compared the effectiveness of 44 masks, including N95 equivalent respirators, surgical and dental masks, general cotton masks, and handkerchiefs. They used particle penetration tests similar to those used by NIOSH and the European Union. They found that the N95 equivalent mask blocked more than 95 percent of all particles, as expected. The surgical mask was around 40 percent effective, with the dental masks coming in at around 60 percent. Cotton masks were around 30 percent effective and cotton handkerchiefs ranged from 2 percent (one layer) to 13 percent (four layers). A similar study in 2010 by NIOSH researchers looked at masks made of different types of fabrics. They found that masks made from t-shirts blocked about 10 percent of particles in a wide range, masks made from sweatshirt fabric blocked 20 to 40 percent, masks made from towels blocked around 40 percent, and scarves blocked 10 to 20 percent.
- A 2008 systematic review, published in BMJ, found medical masks halted the spread of respiratory viruses from likely infected patients. In particular, studies on the 2003 outbreak of SARS — a cousin to the coronavirus that causes Covid-19 — found that masks alone were 68 percent effective at preventing the virus. By comparison, washing hands more than 10 times a day was 55 percent effective. A combination of measures such as hand-washing, masks, gloves, and gowns was 91 percent effective.
- A 2015 review published in BMJ, looked at mask use among people in community settings, specifically households and colleges. Some studies produced unclear results, but the findings overall indicated that wearing a mask protected people from infections compared to not wearing a mask, especially when paired with hand-washing. A big issue was adherence; people were often bad at actually wearing masks, which, unsurprisingly, diminished their effectiveness. But if masks were used early and consistently, the authors concluded, they seemed to work.
- In a study published April 3, 2020 in Nature Medicine, researchers found that surgical masks reduced the detection of respiratory viruses in aerosols generated by infected people breathing or coughing in a breath-collecting machine.
Seasonal coronaviruses are one cause of the common cold. Benjamin Cowling at the University of Hong Kong and his colleagues had ill volunteers who were infected with seasonal coronaviruses sit in an enclosed booth and place their faces in a sampling device, called the Gesundheit-II, that captures airborne particles. The scientists detected coronavirus RNA in both coarse droplets and finer ‘aerosol’ droplets emitted by volunteers who were not wearing masks. Mask reduced detection of viral RNA in both types of droplet. Larger particles are carried by sneezes and coughs, whereas exhaled breath can spread aerosol droplets, which have a diameter of five micrometres or less. The authors say that surgical masks reduce transmission of not only seasonal coronaviruses, but also influenza.
- A study by Bae and colleagues, recruited 4 patients with SARS-CoV-2 infection to cough five times onto petri dishes containing viral transport media approximately 20 cm from their face while wearing either no mask, a surgical face mask, or a two-ply cotton mask. The median nasopharyngeal viral load was 5.66 log copies/mL, and the cough samples found viral loads of 1.4 to 3.5 logs/mL whether or not a mask was present for three of the four patients. Swabs of the outer surfaces of both types of masks were positive for all four patients. This study shows that neither surgical nor cotton face masks will prevent the spread of virus from a coughing individual — at least at a distance of only 20 cm. So the efficacy is likely diminished in coughing individuals no matter surgical mask or cotton mask according to this study although only 4 patients were tested.
This Mask study retracted:
The authors of a study on the ineffectiveness of masks in blocking SARS-CoV-2 have retracted their study in the Annals of Internal Medicine. They write: We had not fully recognized the concept of limit of detection (LOD) of the in-house reverse transcriptase polymerase chain reaction used in the study (2.63 log copies/mL), and we regret our failure to express the values below LOD as “<LOD (value).” The LOD is a statistical measure of the lowest quantity of the analyte that can be distinguished from the absence of that analyte. Therefore, values below the LOD are unreliable and our findings are uninterpretable. Reader comments raised this issue after publication. We proposed correcting the reported data with new experimental data from additional patients, but the editors requested retraction.
______
Logic to wear a Mask:
If you feel confused about whether people should wear masks and why and what kind, you’re not alone. COVID-19 is a novel disease and we’re learning new things about it every day. However, much of the confusion around masks stems from the conflation of two very different functions of masks.
Masks can be worn to protect the wearer from getting infected or masks can be worn to protect others from being infected by the wearer. Protecting the wearer is difficult: It requires medical-grade respirator masks, a proper fit, and careful putting on and taking off. But masks can also be worn to prevent transmission to others, and this is their most important use for society. If we lower the likelihood of one person infecting another, the impact is exponential, so even a small reduction in those odds results in a huge decrease in deaths. Luckily, blocking transmission outward at the source is much easier. It can be accomplished with something as simple as a cloth mask.
_
A key transmission route of COVID-19 is via droplets that fly out of our mouths — that includes when we speak, not just when we cough or sneeze. A portion of these droplets quickly evaporate, becoming tiny particles whose inhalation by those nearby is hard to prevent. This is especially relevant for doctors and nurses who work with sick people all day. Medical workers are also at risk from procedures such as intubation, which generate very tiny particles that can float around, possibly for hours. That’s why their gear is called “personal protective equipment,” or PPE, and has stringent requirements for fit in order to stop ingress — the term for the transmission of these outside particles to the wearer. Until now, most scientific research and discussion about masks has been directed at protecting medical workers from ingress.
But the opposite concern also exists: egress, or transmission of particles from the wearer to the outside world. Historically, much less research has been conducted on egress, but controlling it — also known as “source control” — is crucial to stopping the person-to-person spread of a disease. Obviously, society-wide source control becomes very important during a pandemic.
The good news is that preventing transmission to others through egress is relatively easy. It’s like stopping gushing water from a hose right at the source, by turning off the faucet, compared with the difficulty of trying to catch all the drops of water after we’ve pointed the hose up and they’ve flown all over the place. Research shows that even a cotton mask dramatically reduces the number of virus particles emitted from our mouths — by as much as 99 percent. This reduction provides two huge benefits. Fewer virus particles mean that people have a better chance of avoiding infection, and if they are infected, the lower viral exposure load may give them a better chance of contracting only a mild illness.
_
COVID-19 has been hard to control partly because people can infect others before they themselves display any symptoms — and even if they never develop any illness. Recent studies show that nearly half of patients are infected by people who aren’t coughing or sneezing yet. Many people have no awareness of the risk they pose to others, because they don’t feel sick themselves, and many may never become overtly ill. If we could just keep our embers from being sent out every time we spoke or coughed, many fewer people would catch infection. Masks help us do that. And because we don’t know for sure who’s sick, the only solution is for everyone to wear masks. This eventually benefits the wearer because fewer viruses mean we’re all less likely to be infected. The main reason for members of the public wearing masks, particularly non-surgical masks, would be to reduce the risk of passing coronavirus to someone else. My mask protects you; your masks protect me. Plus, health care system would no longer be overwhelmed, and we could more easily go back to work and the rest of our public lives.
_
Every infectious disease has a reproduction rate, called R0. When it’s 1.0, that means the average infected person infects one other person. The 1918 pandemic flu had an R of 1.8 — so one infected person infected, on average, almost two others. COVID-19’s rate, in the absence of measures such as social distancing and masks, is between 2 to 3. A disease dies out if its R falls under 1.0. The lower the number, the faster it dies out. The effectiveness of mask-wearing depends on three things: the basic reproduction number, R0, of the virus in a community; masks’ efficacy at blocking transmission; and the percentage of people wearing masks.
The blue area of the graph below indicates an R0 below 1.0, the magic number needed to make the disease die out. Models show that if 80 percent of people wear masks that are 60 percent effective, easily achievable with cloth, we can get to an effective R0 of less than one. That’s enough to halt the spread of the disease.
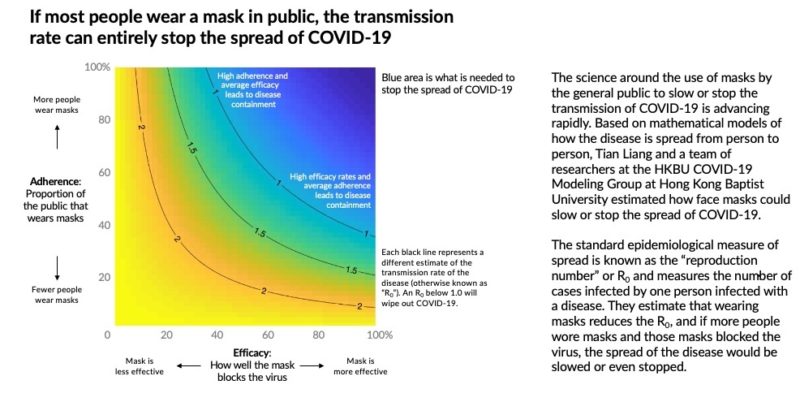
_
Many countries already have more than 80 percent of their population wearing masks in public, including countries such as Hong Kong, where most stores deny entry to unmasked customers, and the more than 30 countries that legally require masks in public spaces, such as Israel, Singapore, and the Czech Republic. While cloth masks are sufficient for protecting others, people who are immunocompromised or elderly should wear surgical mask.
The community use of masks for source control is a “public good”: something we all contribute to that eventually benefits everyone — but only if almost everyone contributes, which can be a challenge to persuade people to do. For example, in Hong Kong, only four confirmed deaths due to COVID-19 have been recorded since the beginning of the pandemic, despite high density, mass transportation, and proximity to Wuhan. Hong Kong’s health authorities credit their citizens’ near-universal mask-wearing as a key factor (surveys show almost 100 percent voluntary compliance). Similarly, Taiwan ramped up mask production early on and distributed masks to the population, mandating their use in public transit and recommending their use in other public places — a recommendation that has been widely complied with. The country continues to function fully, and their schools have been open since the end of February, while their death total remains very low, at only six. In the Czech Republic, masks were not used during the initial outbreak, but after a grassroots campaign led to a government mandate on March 18, masks in public became ubiquitous. The results took a while to be reflected in the official statistics: The first five days of April still saw an average of 257 new cases and nine deaths per day, but the most recent five days of data show an average of 120 new cases and five deaths per day. Of course, we can’t know for sure to what degree these success stories are due to masks, but we do know that in every region that has adopted widespread mask-wearing, case and death rates have been reduced within a few weeks.
_
Social distancing and lockdown processes have now gone into effect in many places around the world. However, no social isolation process is perfect, and there are two simple and evident rules. First, the larger the number of affected individuals, the more perfect the quality of the entire social isolation process needs to be. Second, the isolation has to be done in concert. If one part of the country practices isolation and the other is lax and starts late, it will turn into a game of ping-pong with the illness careening from one place to another. It is striking that organisations such as the World Health Organization had refrained from offering such simple recommendations, particularly in the use of facial coverings. It is only recently that the US Centers for Disease Control is planning to support facial coverings. It makes scientific sense. Cover your nose and mouth in public indoor spaces. Use a scarf if a mask is not available. But refrain from adding too many layers to the scarf since it will block airflow to the extent that most of the air will then enter unfiltered through the gaps between the scarf and the skin.
_
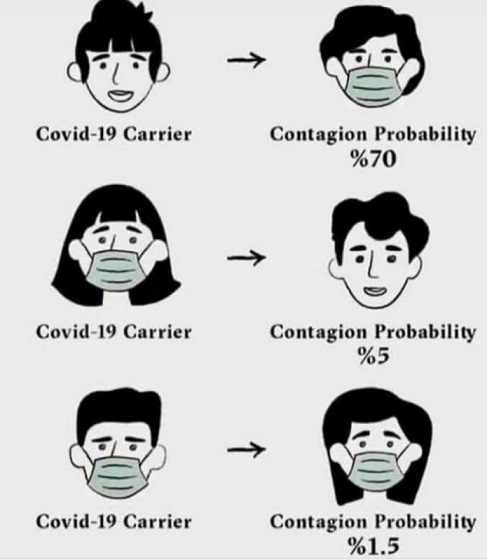
Figure above shows that when everybody wears masks, transmission probability is least. Even if only covid-19 carriers wear masks, probability of transmission is low but since asymptomatic and presymptomatic covid-19 patients are more than 50% of total covid-19 patients, and since we are mainly testing symptomatic patients, and since it is impossible to test everybody, and since 30% people will be false negative even if you test all covid patients, best option to control pandemic is wearing mask by everybody irrespective of who is covid-19 carrier and irrespective of social distancing.
_______
Various authors have justified not wearing masks on four main grounds. Firstly, they claim that there is limited evidence that they are effective. Secondly, they argue that trials have shown that people are unlikely to wear them properly or consistently, which is important since prevention depends on people not repeatedly touching their mask, and on all or most people wearing them most of the time. Thirdly, they point out that the trials have also shown that wearing a mask might make people feel safe and hence disregard other important public health advice such as hand washing and social distancing. Finally, they argue that because of the shortage of masks in the current crisis, the public should not wear them since healthcare workers need them more, and public buying could lead to major supply chain problems.
The first argument can be challenged on the grounds that absence of evidence is not evidence of absence. The second two arguments may have been internally valid in the trials that produced them, but we have no evidence that they are externally valid in the context of covid-19. “The public” here are not volunteers in someone else’s experiment in a flu outbreak—they are people the world over who are trying to stay alive in a deadly pandemic. They may be highly motivated to learn techniques for most effective mask use. There are good reasons why the public is likely to comply more closely with mask advice and wider infection control measures now than the research participants were in the published trials. These reasons include the fact that SARS-CoV-2 is both more contagious and more serious than the medical scenarios in the studies on which the conclusion not to use masks was based. Similarly, if SARS-CoV-2 vaccination were available and affordable, it might be used more widely and be more acceptable than flu vaccination.
Substantial indirect evidence exists to support the argument for the public wearing masks in the covid-19 pandemic. The virus has been shown to remain viable in the air for several hours when released in an aerosol, and such aerosols seem to be blocked by surgical masks in laboratory experiments. Individuals have been shown to be infectious up to 2.5 days before symptom onset, and as many as 50% of infections seem to occur from presymptomatic individuals. Community prevalence of covid-19 in many countries is likely to be high. Modelling studies suggest that even a small reduction in community transmission could make a major difference to demand elsewhere in the system (e.g., for hospital bed space and ventilators).
The suggestion that the public should not wear masks because healthcare workers need them more is valid up to a point, but it is surely an argument for manufacturing more masks, not for denying them to populations who could potentially benefit from them. Until such masks are available in sufficient numbers, cloth masks (washed frequently) as recommended by the CDC may be a substitute. Additional research is urgently needed to identify how best to overcome problems of poor filtration and moisture retention that have been described. Such studies could determine, for example, the optimum nature of fabric, thickness (how many layers?), the nature of the outer water repellent layer, closeness of fit, and duration to be worn before washing.
Some indirect evidence for the benefits of masks is emerging. For example, a longitudinal ecological study from Hong Kong, conducted before and after the introduction of a range of non-pharmaceutical measures including masks for the public, suggested that these seemed to help to contain the pandemic (changes were statistically significant for masks and social distancing measures combined, though the effect of masks alone cannot be isolated out). There is also analogical evidence from the behaviour of viruses with a similar chemical make-up. Given these indirect and circumstantial findings and the seriousness of this outbreak, there is a moral argument that the public should be given the opportunity to change their behaviour as a precaution even when direct, experimental evidence for benefit is not clear cut. Unlike in Australia and the US, where most trials were done, mask wearing has become normalized in some Asian countries, partly as a protection against polluted air and perhaps also as a response to the SARS and MERS outbreaks. In Japan, Hong Kong, South Korea, and China, for example, mask wearing is now the norm.
Another argument for using masks by everybody is that the world may pay a high price for covid-19 and the “collateral damage” risks becoming higher than the direct damage from the virus. The dangers include increased suicide rates because of isolation and economic hopelessness among poorer people losing their income or in small companies, civil unrest in some countries when they consider lockdown, as was seen with Ebola, people losing their access to their regular medication, thriving autocratic systems under the pretense of controlling covid-19, and domestic violence and family disputes—the list is long.
_____
Best Material for making a Homemade Mask:
Researchers at Cambridge University tested a wide range of household materials for homemade masks. To measure effectiveness, they shot Bacillus atrophaeus bacteria (0.93-1.25 microns) and Bacteriophage MS virus (0.023 microns in size) at different household materials. They measured what percentage the materials could capture and compared them to the more common surgical mask. Not surprisingly, the surgical mask performed best, capturing 97% of the 1-micron bacteria. Yet every single material filtered out at least 50% of particles. The top performers were the vacuum cleaner bag (95%), the dish cloth (“tea towel” in the UK 83%), the cotton blend shirt fabric (74%), and the 100% cotton shirt (69%).
The test above used bacteria that were 1 micron large, yet the coronavirus is just 0.1 microns – ten times smaller. Can homemade masks capture smaller virus particles? To answer this question, the scientists tested 0.02 micron Bacteriophage MS2 particles (5 times smaller than the coronavirus). On average, the homemade masks captured 7% fewer virus particles than the larger bacteria particles. However, all of the homemade materials managed to capture 50% of virus particles or more (with the exception of the scarf at 49%)
If the problem is filtration effectiveness, would the masks work better if we doubled up with two layers of fabric? The scientists tested virus-size particles against double-layered versions of the dish towel, pillow case, and 100% cotton shirt fabrics. Overall, the double layers didn’t help much. The double-layer pillowcase captured 1% more particles, and the double-layer shirt captured just 2% more particles. Yet the extra dish cloth layer boosted performance by 14%. That boost made the dish cloth as effective as the surgical mask.
Looking at the data, the dish towel and vacuum cleaner bag were the top-performing materials. However, the researchers didn’t choose these as the best materials for homemade masks: Instead, they concluded the pillowcase and the 100% cotton t-shirt are the best materials for homemade masks.
Why?
The answer lies in breathability. How easy it is to breathe through your mask is an important factor that will affect how comfortable it is. And comfort isn’t merely a luxury. Comfort will influence how long you can wear your mask. Fortunately, in addition to particle effectiveness, the researchers tested the pressure drop across each type of fabric. This gives us a good indication of how easy it is to breathe through each material. As a benchmark, they compared breathability of each homemade mask material to the surgical mask.
Although the dish cloth and the vacuum bag captured the most particles, they were also the hardest to breath through. With two layers, the dish cloth was over twice as hard to breathe through as the surgical mask. In contrast, the pillow case, t-shirt, scarf, and linen were all easier to breathe through than the surgical mask.
Based on particle capture and breathability, the researchers concluded that cotton t-shirts and pillow cases are the best choices for homemade masks.
In a nutshell:
Best material for making homemade masks are cotton and pillowcase fabric. These materials filter out approximately 50% of 0.2 micron particles, similar in size to the coronavirus. They are also as easy to breathe through as surgical masks, which makes them comfortable enough to wear for several hours. Doubling the layers of material for your homemade mask gives a very small increase in filtration effectiveness, but makes the mask much more difficult to breathe through.
______
WHO belatedly recognized importance of Masks: 8 June 2020:
In areas of active SARS-CoV-2 transmission, governments should encourage the public to wear face masks in certain settings, the World Health Organization now recommends. Nonmedical face masks should be encouraged when people cannot keep a distance of at least 6 feet apart (e.g., public transportation, mass gatherings, grocery stores, schools, church, refugee camps). Medical face masks are recommended for vulnerable groups like seniors and people with underlying medical conditions and for those with symptoms consistent with COVID-19.
_____
Mask wearing at home:
Wearing face masks at home may reduce transmission among family members — but only before symptoms develop — a study in BMJ Global Health suggests. Researchers studied roughly 125 families in Beijing in which at least one member contracted COVID-19. Nearly a quarter of household members were subsequently infected. After multivariable adjustment, the risk for secondary transmission was significantly increased when the primary case had diarrhea (odds ratio, 4) and with frequent, daily close contact (within 3 feet) with the primary case at home (OR, 18). Frequent disinfectant use and family members wearing masks at home before the primary case showed symptoms were associated with reduced risk (ORs, 0.2 for both). The authors conclude that the findings “may … be informative for families of high-risk groups such as health workers, quarantined individuals or situations where cases of COVID-19 have to be managed at home.”
______
______
The other side of the story:
Masks are unhelpful or even harmful:
_
Most face masks do not effectively filter small particles from the air and don’t prevent leakage around the edge of the mask when the user inhales. Mask wearing may give people a false sense of security, some experts said. This may lead some members of the public to be lax about other, far more critical precautions, such as staying two meters apart from others, limiting outings, and washing their hands frequently and thoroughly. Moreover, donning an uncomfortable, awkward mask may lead some people to touch their faces more, some argued. Any face touching has the potential to transfer virus particles from contaminated hands to entry points, such as the eyes, nose, and mouth. And even if a mask-wearer’s hands are clean to begin with, simply touching their mask could contaminate their hands if there are viral particles caught on the outside. If that’s the case, a mask wearer could then transfer virus particles from their mask to their face unwittingly—negating any benefit of having the mask. They might also transfer the virus from their mask to their environment by touching surfaces, where the virus particles could get picked up by other people. It has also been debated whether masks provide bacteria and viruses with a warm, damp environment for it to thrive. Last, some argued, the masks that would be most effective at stopping the new coronavirus—SARS-CoV-2—are things like N95 respirators and surgical masks, which are in short supply worldwide. Without question, these should be preserved for the heroic frontline health workers, who are putting their lives at risk every day to treat patients with COVID-19 during this overwhelming pandemic. While experts unanimously agree on that last point—that proper medical masks should go to healthcare workers first—the other points are now up for debate.
_
For most of the general public, wearing a face mask offers very little protection from coronavirus even if supplies of surgical masks were available. This is because:
- Air breathed in tends to take the ‘path of least resistance’. Surgical masks are not closely fitted, so most air travels round the edges of the mask rather than through it. They therefore only protect against large droplets, not small, airborne particles.
- Following social distancing and handwashing guidelines is more effective than wearing a mask. Large droplets are highly unlikely to spread more than 2 meters.
- Wearing a face mask might also make you more likely to touch your face because they are uncomfortable or affecting your breathing.
- Face masks can offer a false sense of security, making you think you’re protected against coronavirus and so more willing to take risks.
- Most people don’t know how to put on, wear, take off or dispose of face masks effectively. This means they could expose themselves to the virus when putting the mask on or taking it off.
- Cloth masks are, relatively speaking, extremely ineffective at preventing virus getting through to the nose and mouth. The argument for wearing these to protect yourself against infection are even less compelling.
-Up to 90% of particles penetrate cloth masks.
-Once damp (after you’ve been breathing while wearing one for more than a few minutes) they may actually retain virus on their surfaces.
-The European Centre for Disease Control states ‘common fabric cloth masks are not considered protective against respiratory viruses and their use should not be encouraged’.
______
______
Section-9
Antibodies test:
_
COVID-19 testing:
Diagnosing viral infections currently relies on two major methodologies: Reverse Transcription Polymerase Chain Reaction (RT-PCR) and serological immunoassays that detect viral-specific antibodies (IgM and IgG) or antigens. COVID-19 testing can identify the SARS-CoV-2 virus and includes methods that detect the presence of virus itself (RT-PCR and isothermal nucleic acid amplification) and those that detect antibodies produced in response to infection. Detection of antibodies (serology) can be used both for diagnosis and population surveillance. Antibody tests show how many people have had the disease, including those whose symptoms were minor or who were asymptomatic. An accurate mortality rate of the disease and the level of herd immunity in the population can be determined from the results of this test.
Part of the immune response to infection is the production of antibodies including IgM and IgG. IgM antibodies to SARS-CoV-2 are generally detectable in blood several days after initial infection, although levels over the course of infection are not well characterized. IgG antibodies to SARS-CoV-2 become detectable later and normally peak around 28 days after the onset of infection. Antibody tests can be used to determine the percentage of the population that has contracted the disease and that is therefore immune.
Serology testing for SARS-CoV-2 is at increased demand in order to better quantify the number of cases of COVID-19, including those that may be asymptomatic or have recovered. Serology tests are blood-based tests that can be used to identify whether people have been exposed to a particular pathogen by looking at their immune response. In contrast, the RT-PCR tests currently being used globally to diagnose cases of COVID-19 can only indicate the presence of viral material during infection and will not indicate if a person was infected and subsequently recovered. These tests can give greater detail into the prevalence of a disease in a population by identifying individuals who have developed antibodies to the virus.
_
Accuracy:
In March 2020 China reported problems with accuracy in their test kits. In the United States, the test kits developed by the CDC had “flaws;” the government then removed the bureaucratic barriers that had prevented private testing. Spain purchased test kits from Chinese firm Shenzhen Bioeasy Biotechnology Co Ltd, but found that results were inaccurate. 80% of test kits the Czech Republic purchased from China gave wrong results. Slovakia purchased 1.2 million test kits from China which were found to be inaccurate. The UK purchased 3.5 million test kits from China but in early April 2020 announced these were not usable.
Laboratory tests that detect antibodies to SARS-CoV-2 in people, including rapid immunodiagnostic tests, need further validation to determine their accuracy and reliability. Inaccurate immunodiagnostic tests may falsely categorize people in two ways. The first is that they may falsely label people who have been infected as negative, and the second is that people who have not been infected are falsely labelled as positive. Both errors have serious consequences and will affect control efforts. These tests also need to accurately distinguish between past infections from SARS-CoV-2 and those caused by the known set of six human coronaviruses. Four of these viruses cause the common cold and circulate widely. The remaining two are the viruses that cause Middle East Respiratory Syndrome and Severe Acute Respiratory Syndrome. People infected by any one of these viruses may produce antibodies that cross-react with antibodies produced in response to infection with SARS-CoV-2.
______
RT-PCR vs antibodies test:
Although, RT-PCR is a highly sensitive test for SARS-CoV-2 (the virus that causes COVID-19) it has its limitations. RT-PCR requires high-quality nasopharyngeal swabs containing sufficient amounts of viral RNA. This can be a challenge because the amount of viral RNA not only varies tremendously between patients, it can also varies within the same patient depending on the timing of the test and the start of the infection and/or the onset of symptoms. In addition, nasopharyngeal swabs are not only very unpleasant to the patient, the sampling techniques vary significantly from nurse to nurse. Without sufficient viral RNA RT-PCR can return a false negative test result. RT-PCR also requires highly trained personnel to perform complex RNA extraction steps and PCR. Normally, this would not be a problem when testing a few thousand samples. RT-PCR becomes an issue when dealing with a global pandemic with potentially millions of people to test. This leads to delays in testing as medical facilities become overwhelmed with requests.
According to recent estimates, false negative results obtained with RT-PCR are more common than initially thought. Some health care experts go as far as stating that, based on their own experience, one in three patients who has been infected with SARS-CoV-2 tests negative with the RT-PCR method. False negative results can have devastating impacts on the current efforts to contain the SARS-CoV-2 outbreak as infected patients are mistakenly given the green light to return home, return to work and possibly infecting others. Relying solely on nucleic acid tests to diagnose SARS-CoV-2 is a risky strategy. As such, calls to add independent testing methodologies to complement RT-PCR are becoming increasing louder.
IgG/IgM serological tests offer some advantages over RT-PCR. Firstly, serological tests detect human antibodies (proteins belonging to the immunoglobulin class) which are known to be much more stable than viral RNA. As a result, IgM/IgG serological specimens are less sensitive to spoilage during collection, transport, storage and testing than RT-PCR specimens. Secondly, because antibodies are typically uniformly distributed in the blood, serological specimens have much less variations than nasopharyngeal viral RNA specimens and can be easily collected with minor phlebotomy discomfort to the patient. Thirdly, unlike RT-PCR, serological tests can detect past infection because virus-specific antibodies (unlike viral RNA) can persist in the blood for several weeks/months after onset of symptoms.
IgM/IgG serological tests also have some limitations, mainly related to the slow pace of the human antibody response to SARS-CoV-2. Although, several studies are still on-going, SARS-CoV-2 antibodies may not be detectable before 3 days after onset of symptoms (or at least 7 to 10 days after infection).
While IgM/IgG serological tests alone may not be enough to diagnose COVID-19, they can be a valuable diagnostic tool when combined with RT-PCR (see paragraph below). In addition, because of their scalability, serological assays can be used in large-scale, whole-population, testing to assess the overall immune response to the virus and identify asymptomatic carriers of the virus. Indeed, 30% of COVID-19 cases are estimated to be asymptomatic.
_
The present IgM/IgG serological assay is designed to complement RT-PCR in the diagnosis of SARS-CoV-2 infections. Table below shows the clinical interpretation of all possible scenarios that can be encountered when testing a patient with both RT-qPCR and an IgM/IgG serological test.
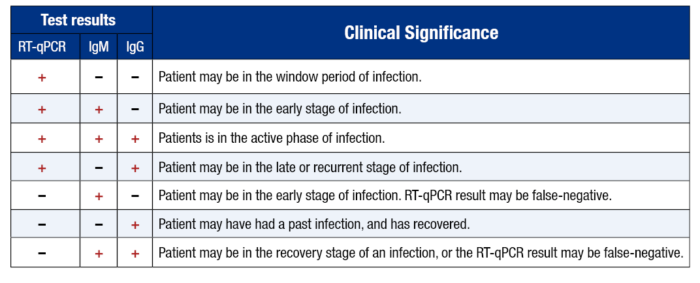
Table above shows clinical Significance of an IgM/IgG Serological Test Result. This table is based on the current knowledge about the rise and fall of SARS-CoV-2 RNA and antigens, IgM antibody and IgG antibody (see figure below) and the correlation of these level variations with the initial time of infection, onset of symptoms and recovery phase. As shown in figure below, serological tests are recommended to be used on patients at least 3 days after onset of symptoms or 7-10 days after infection with the virus.
_
The key takeaway is that the results of RT-PCR and IgM/IgG serological tests do not necessarily need to agree. A disagreement between the two tests, if any, can often be traced to the after-infection time points at which the tests were performed. Overall, while RT-PCR testing may be appropriate for the detection of the SARS-CoV-2 virus during the acute phase, IgM/IgG is an appropriate test during the chronic phase. Since the exact time of infection is often unknown, combining RT-PCR and IgM/IgG testing can improve the accuracy of the COVID-19 diagnosis.
_
Figure below shows variation of the levels of SARS-CoV-2 RNA and Antigen, IgM and IgG after infection.
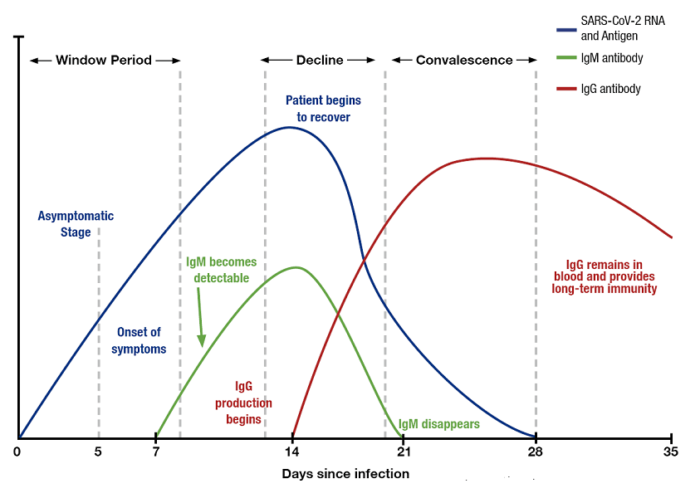
______
WHO continues to review the evidence on antibody responses to SARS-CoV-2 infection. Most of these studies show that people who have recovered from infection have antibodies to the virus. However, some of these people have very low levels of neutralizing antibodies in their blood, suggesting that cellular immunity may also be critical for recovery. As of 24 April 2020, no study has evaluated whether the presence of antibodies to SARS-CoV-2 confers immunity to subsequent infection by this virus in humans. Many countries are now testing for SARS-CoV-2 antibodies at the population level or in specific groups, such as health workers, close contacts of known cases, or within households. WHO supports these studies, as they are critical for understanding the extent of – and risk factors associated with – infection. These studies will provide data on the percentage of people with detectable COVID-19 antibodies, but most are not designed to determine whether those people are immune to secondary infections.
____
FDA warns providers about limits of SARS-CoV-2 Antibody Tests: April 2020:
The agency is urging clinicians to not use serological (antibody) tests as the sole basis to diagnose COVID-19 but instead as information about whether a person may have been exposed. The agency said it is not aware of an antibody test that has been validated for diagnosis of SARS-CoV-2 infection. The tests measure IgM or IgG antibodies, but IgM antibodies may not develop at all, and IgG antibodies usually don’t develop until later in the disease process. Therefore, using such tests to diagnose COVID-19 will miss infections. A New York Times story details the low accuracy seen with many of the tests on the market — sometimes as low as 20–30%. Not only do they miss infections, but most tests “detect” antibodies in some people who don’t have them. One infectious disease expert told the Times: “People don’t understand how dangerous this test is. We sacrificed quality for speed.”
______
Entering the Era of SARS-COV-2 Antibody Testing: May 2020:
A serologic test for antibodies against the SARS-COV-2 nucleocapsid protein shows optimal specificity and sensitivity at day 14, but its prognostic role is unclear. Researchers present data on the sensitivity and specificity of the Abbott SARS-CoV-2 immunoglobulin G (IgG) test, which detects IgG antibodies against the SARS-CoV-2 nucleocapsid protein. When the SARS-CoV-2 assay was used on 1020 deidentified serum specimens from 1010 different individuals submitted in 2018 and 2019 for serologic testing of other viral infections, specificity was 99.9%. When the assay was used on 689 samples obtained from 125 patients with PCR-confirmed SARS-CoV-2 infection in March and April 2020, sensitivity was 53.1% at 7 days after the estimated day of symptom onset, 82.4% at 10 days, 96.9% at 14 days, and 100% at 17 days; sensitivity was 88.7% at 7 days after the date of PCR positivity, 97.2% at 10 days, 100% at 14 days, and 100% at 17 days. In a voluntary field test of anti-SARS-CoV-2 antibody seroprevalence in Boise, Idaho, in late April 2020, 1.8% of 4856 individuals tested positive with this test.
Given that >90% of adults aged 50 and older harbor antibodies to other circulating coronaviruses, the serologic test evaluated here shows excellent specificity and high sensitivity at 14 days after symptom onset. FDA emergency authorization recently was provided for this and other serologic tests for SARS-CoV-2. The CDC has issued interim guidance on testing for SARS-CoV-2 antibodies. Among the recommendations: serologic assays that have received emergency use authorization from the FDA are preferred; the test’s positive predictive value should be high (e.g., choose a test with a specificity of 99.5% or greater if possible); and testing can be used to aid in the diagnosis of COVID-19 in patients who present late (e.g., 9–14 days after symptom onset), when the sensitivity of polymerase chain reaction testing is waning.
______
______
Section-10
Are we testing enough?
_
The importance of testing:
To understand the global pandemic, we need global testing. Testing is our window onto the pandemic and how it is spreading. Without testing we have no way of understanding the pandemic. It is one of our most important tools in the fight to slow and reduce the spread and impact of the virus. Tests allow us to identify infected individuals, guiding the medical treatment that they receive. It enables the isolation of those infected and the tracing and quarantining of their contacts. Testing for COVID-19 also informs our understanding of the pandemic and the risks it poses in different populations. This knowledge is important if we are to properly assess the interventions that should be implemented, including very costly interventions such as social distancing and the shutdown of entire regions and industries. Without data on COVID-19 we cannot possibly understand how the pandemic is progressing. Without data we cannot respond appropriately to the threat; neither as individuals nor as a society. Nor can we learn where countermeasures against the pandemic are working.
Some countries present comprehensive, detailed and regularly updated data. Iceland is one of these countries. Estonia goes even further, showing breakdowns by age, gender and region. For many countries however, available data on testing is either incomplete or else completely unavailable. This makes it impossible for their citizens and for researchers to assess the extent and significance of their testing efforts. Our current knowledge of COVID-19 testing – and more importantly of the pandemic itself – would be greatly improved if all countries were able to report all the testing data available to them in the way shown by the best examples. Make millions of diagnostic tests available. Not everyone needs to be tested, but everyone with symptoms does. Every contact of covid-19 case must be tested irrespective of symptoms. All health care workers must be tested. The nation needs to gear up to perform millions of diagnostic tests. This was key to success in South Korea. Every decision about managing cases depends on sound medical evaluation and the results of diagnostic tests. Without diagnostic tests, we cannot trace the scope of the outbreak.
____
Data on testing can tell a lot about the pandemic:
No country knows the true number of people infected with COVID-19. All we know is the infection status of those who have been tested. The total number of people that have tested positive – the number of confirmed cases – is not the total number of people who have been infected. The true number of people infected with COVID-19 is much higher. Whilst there is no way to infer the true number of infections from testing data, it can help give us a strong indication of the quality of a country’s data on the pandemic and an idea of how informative the number of confirmed cases in a country may be.
_
- Testing coverage
It means tests per thousand people.
_
Figure below shows Timeline of Number of tests per thousand people in different countries.
The United States was testing 100,000 people per day by March 27. In comparison, several European countries have been testing more people per 1000 people per day than the United States. Three European countries are aiming to conduct 100,000 tests per day – Germany by mid-April, the United Kingdom by the end of April and France by the end of June. Germany has a large medical diagnostics industry, with over 100 testing labs that provided the technology and infrastructure to enable rapid increases in testing. The UK sought to diversify its life sciences companies into diagnostics to scale up testing capacity.
_
Countries are reporting testing data in different ways: some report the number of tests, others report the number of people tested. This distinction is important – people may be tested many times, and the number of tests a person has is likely to vary across countries. Across different countries, we see an enormous range in testing coverage. In Iceland there have been more than 100 tests per thousand people – far more than in any other country. In Indonesia, testing coverage is very low – only 0.1 tests per thousand people.
Generally, we would expect that more testing means more reliable data on confirmed cases, for two reasons.
Firstly, a greater degree of testing provides us with a larger ‘sample’ of people for which their infection status is known. If everybody was tested, we would know the true number of people who are infected.
Secondly, it may be the case that countries with a high capacity for testing do not need to ration tests as much. Where the capacity for testing is low, tests may be reserved (or ‘rationed’) for particularly high-risk groups. Such rationing is one of the reasons that tested people are not representative of the wider population.
As such, where testing coverage is higher, the ‘sample’ of tested people may provide a less biased idea of the true prevalence of the virus.
_
- The number of tests per confirmed case
A further complication with using testing coverage as an indicator of reliability, is that the number of tests needed to have an accurate picture of the spread of the virus varies over the course of an outbreak. At the beginning of an outbreak, where the number of people infected with the virus is low, a much smaller number of tests are needed to accurately assess the spread of the virus. As the virus infects more people, testing coverage also needs to expand in order to provide a reliable picture of the true number of infected people. For this reason it is helpful to look at the number of tests performed for each confirmed case. This gives us an indication of the scale of testing that accounts for the different stages each country may be in its outbreak.
The key insight from this metric is that there are very large differences between countries.
Only one in every 24 samples tested for Covid-19 in India is positive. In a country like Japan, one out of 11.7 tests turn out to be positive. Italy tests 6.7 persons for one positive test while the US tests 5.3 persons and UK 3.4
_
- What can we learn from these measures about the pandemic?
Both testing coverage and the number of tests per confirmed case help us understand what we can know about the true spread of the virus from data on confirmed cases. But it is the number of tests per confirmed case that is arguably the most helpful in this regard, because this accounts for the fact that a smaller outbreak requires less testing. Consider for instance the difference between three countries: the UK, Australia and Taiwan.
In terms of testing coverage the UK appears to be ahead of Taiwan, with at least twice the number of people tested per thousand, as of 11 April. But on the same date, there were 60 times more confirmed cases per million in the UK than in Taiwan – 1,035 per million and 16 cases per million respectively. So whilst testing relative to population size is higher in the UK, testing relative to the size of the outbreak is much, much higher in Taiwan. As of 11 April, in Taiwan one case was confirmed for every 120 tests. In the UK, a case was confirmed in fewer than every four tests. In Australia, testing coverage is much higher than in Taiwan. But in terms of the number of tests per confirmed case, the countries are much closer – one case was confirmed for every 55 tests in Australia as of 11 April.
The very large differences – such as those seen between Taiwan, Australia and the UK – do tell us something important about the quality of the data.
A country that performs very few tests for each case it confirms is not testing widely enough for the number of confirmed cases to paint a reliable picture of the true spread of the virus. Whilst those people with the most severe symptoms may have been tested in such countries, there are likely to be many times more people with mild or no symptoms that were never tested.
Testing in the UK has not kept pace with the advancing outbreak. The number of people tested per confirmed case fell rapidly throughout March and early April – from more than 400, to less than 4. The current low level of testing, relative to the size of the outbreak, suggests that the true number of infections in the UK is likely to be far higher than the number of confirmed cases. The large number of tests for each confirmed case in Taiwan and Australia suggests that the number of confirmed cases paint a much more reliable picture of the true number of infections in these countries.
_
Researchers from the London School of Hygiene and Tropical Medicine – Timothy Russel, Joel Hellewell, Sam Abbott and others – reach similar conclusions about the UK and Australia via a different method. They estimate the degree to which countries’ confirmed cases may underestimate total symptomatic cases by applying the case fatality rate observed in large studies in China and South Korea to data on the number of COVID-19 deaths in countries around the world. They estimate that in Australia the number of confirmed cases reflect more than three quarters of the total number of symptomatic cases in the country. For the UK, they estimate that confirmed cases represent less than one in twenty symptomatic cases. As such, the gap between the UK and Australia in terms of the true number of infections is likely to be far higher than that indicated by their confirmed cases. The intuition behind these researchers’ estimates is that where the number of confirmed cases looks low against the number of deaths, this is a clear indication that the true number of cases is likely to be much, much higher. But the fundamental reason for this is the limited extent of testing. The rate of tests per case thus gives us another useful way of approaching the same question, by looking at the extent of testing relative to the number of cases directly.
______
______
Section-11
Reliable statistics? Fluctuating R0/CFR?
_
R0 = reproduction number
R0 is an indication of the transmissibility of a virus, representing the average number of new infections generated by an infectious person in a totally naïve population. For R0>1, the number infected is likely to increase, and for R0<1, transmission is likely to die out. The basic reproduction number is a central concept in infectious disease epidemiology, indicating the risk of an infectious agent with respect to epidemic spread. The formal definition of a disease’s R0 is the number of cases, on average, an infected person will cause during their infectious period. The term is used in two different ways.
The basic reproduction number represents the maximum epidemic potential of a pathogen. It describes what would happen if an infectious person were to enter a fully susceptible community, and therefore is an estimate based on an idealized scenario. Researchers use the basic reproduction number, R0, to describe how transmissible a disease is in the absence of any special quarantining or social distancing measures.
The effective reproduction number depends on the population’s current susceptibility. This measure of transmission potential is likely lower than the basic reproduction number, based on factors like whether some of the people are vaccinated against the disease, or whether some people have immunity due to prior exposure with the pathogen or whether lockdown is enforced or not. Therefore, the effective R0 changes over time and is an estimate based on a more realistic situation within the population.
It’s important to realize that both the basic and effective R0 are situation-dependent. It’s affected by the properties of the pathogen, such as how infectious it is. It’s affected by the host population – for instance, how susceptible people are due to nutritional status or other illnesses that may compromise one’s immune system. And it’s affected by the environment, including things like demographics, socioeconomic and climatic factors.
For example, R0 for measles ranges from 12 to 18, depending on factors like population density and life expectancy. This is a large R0, mainly because the measles virus is highly infectious.
On the other hand, the influenza virus is less infectious, with its R0 ranging from 1.4 to 2. Influenza, therefore, doesn’t cause the same explosive outbreaks as measles, but it persists due to its ability to mutate and evade the human immune system.
If R0 is less than 1, the disease will die out in a population, because on average an infectious person will transmit to fewer than one other susceptible person. On the other hand, if R0 is greater than 1, the disease will spread. When public health agencies are figuring out how to deal with an outbreak, they are trying to bring R0 down to less than 1. This is tough for diseases like measles that have a high R0. It’s especially challenging for measles in densely populated regions like India and China, where R0 is higher, compared to places where people are more spread out.
For the SARS pandemic in 2003, scientists estimated the original R0 to be around 2.75. A month or two later, the effective R0 dropped below 1, thanks to the tremendous effort that went into intervention strategies, including isolation and quarantine activities. While on average, an infectious person transmitted to fewer than one susceptible individual, occasionally one person transmitted to tens or even hundreds of other cases. This phenomenon is called super spreading. Officials documented super spreader events a number of times during the SARS epidemic in Singapore, Hong Kong and Beijing.
__
R0 for coronavirus SARS-CoV-2:
Basic R0 estimates for COVID-19 are currently based on limited data, but most have so far fallen between 2 and 3. That means that a typical infected person is expected to pass the disease to two or three other people.
The R0 is, by definition, an average value. What it misses is the fact that not everybody is average. There is a lot of variation among individuals in terms of how much they transmit. For instance, one British man who contracted COVID-19 in Singapore was linked to a further 11 cases after he made a trip to a ski resort in France in late January. A woman in South Korea was linked to as many as 15 new cases after she attended a church and then visited a hospital. These people have been referred to as “superspreaders” by some epidemiologists and media outlets. Research on other respiratory viruses suggests that there may be biological reasons that some people seem to transmit disease more easily. For example, some infected people just make more virus than other people do. There’s also variation in the size of respiratory droplets that people, through no fault of their own, produce as they breathe or talk. Size can help determine how a droplet moves through the air, how likely it is to reach another person, and whether it makes it to that person’s airways. Larger droplets are heavier and fall out of the air faster, for example, but may last longer than smaller droplets before evaporating. Additionally, for many illnesses, there’s a lot of difference in the severity of symptoms people show. This has a direct impact on transmission, because how sick versus well you feel will determine whether you’re out moving around in the world, doing all your normal stuff, contacting lots of people, or whether you’re at home feeling crappy, or self-isolating because you’re aware you might be an infection risk.
There are also many non-biological factors that influence the probability a disease will spread, from the number of people at a particular gathering, to their susceptibility of catching the disease, to the types of interactions those people are having. For instance, during the West African Ebola epidemic, which claimed more than 11,000 lives between 2013 and 2016, at least some new chains of transmission are thought to have started at unsafe burials, in which lots of people came into close contact with the body of an infected person and with one another.
Partly because of these contextual factors, the term “superspreaders” is misleading and unhelpful. It’s not the person, it’s the situation. The term “superspreaders” fails to capture the complexity of transmission, adding that the term should not be used to stigmatize people linked to more cases than usual.
_
The difficulties arise for a number of reasons in calculating R0 for SARS-CoV-2:
First, the basic properties of this viral pathogen – like the infectious period – are as yet not fully known.
Second, researchers don’t know how many mild cases or infections that don’t result in symptoms have been missed by surveillance but nevertheless are spreading the disease.
Third, the majority of people who come down with this new coronavirus do recover, and are likely then immune to coming down with it again. It’s unclear how the changing susceptibility of the population will affect the future spread of infection. As the virus moves into new regions and communities, it encounters people with varying health conditions that affect their susceptibility to disease, as well as different social structures, both of which affect its transmissibility.
Finally, and likely the most important reason, no one knows the future impacts of current disease control measures. Epidemiologists’ current estimates of R0 say nothing about how measures such as travel restrictions, social distancing, lockdown and self-quarantine efforts will influence the virus’s continued spread.
R0 estimates for SARS have been within the range of the mean R0 for COVID-19. Due to similarities of both pathogen and region of exposure, this is expected. On the other hand, despite the heightened public awareness and impressively strong interventional response, the COVID-19 is already more widespread than SARS, indicating it is more transmissible. Therefore basic R0 estimate of SARS may have been overstated.
_____
_____
CFR = case fatality rate
The case fatality rate (CFR) is a measure of the ability of a pathogen or virus to infect or damage a host in infectious disease and is described as the proportion of deaths within a defined population of interest, i.e. the percentage of cases that result in death. CFRs confers the extent of disease severity and CFR is necessary for setting priorities for public health in targeted interventions to reduce the severity of risk.
Most people with COVID-19 recover. For those who do not, the time from development of symptoms to death has been between 6 and 41 days, with the most common being 14 days. As of 7 June 2020, approximately 393,000 deaths had been attributed to COVID-19. The CFR for coronavirus disease 2019 (COVID-19) in Italy is among the highest in the world and was 7.2% as of March 17, 2020. By comparison, the CFR in China was 2.3% as of February 11, 2020. There are potentially several reasons for these differences. CFR for COVID-19 depends on age and is much higher among the elderly than in younger and middle-aged individuals. Compared to China, the population of Italy is older, with 23% over age 65 years. Mortality among all age strata under age 70 years was similar between Italy and China and only among those ≥70 years old were differences between the countries noted. Thus, age explains at least part of the difference in CFR between Italy and China. In China, as of 5 February about 80 per cent of deaths were in those over 60, and 75 per cent had pre-existing health conditions including cardiovascular diseases and diabetes.
Initial studies reported an estimation of 3% for the global CFR of COVID-19. Estimating CFR from country-level data requires assessment of information about the delay between the report of the country-specific cases and death from COVID-19, as well as underestimating and under-reporting of death-related cases, which may not be known.
Formula is used to measure CFR and recovery rate (RR).
CFR (%) = (Number of deaths due to COVID−19/ Number of closed cases of COVID−19) X 100
RR (%) = (Number of cases recovered from COVID−19/ Number of closed cases of COVID−19) X 100
_
There is no single figure of CFR for any particular disease. The CFR varies by location, and is typically changing over time. CFRs vary widely between countries, from 0.2% in Germany to 7.7% in Italy for covid-19. But this is not necessarily an accurate comparison of the true likelihood that someone with COVID-19 will die of it. We do not know how many cases are asymptomatic versus symptomatic, or whether the same criteria for testing are being applied between countries. Without better and more standardised criteria for testing and for the recording of deaths, the real mortality rate is unknown. To understand the differences in CFR and how they should guide decision-making, we need better data. But if we’re careful to acknowledge its limitations, CFR can help us to better understand the severity of the disease and what we should do about it. CFR numbers vary by region and over time, and are influenced by the volume of testing, healthcare system quality, treatment options, time since initial outbreak, and population characteristics such as age, sex, and overall health.
_
CFR may be used to determine the severity and prognosis of a disease. But in case of the current pandemic, CFR may not be a completely reliable method as the total number of COVID-19 cases counted depends on how aggressively countries are testing. In many places because of a lack of adequate testing supplies and resources, only those people who report themselves are being tested. This means testing in most countries is limited to the hospitals and presumably does not take into account those with mild symptoms who are not sick enough to report themselves and those who are asymptomatic and show no symptoms at all. This leads to an inflated CFR since the denominator will be smaller. Also, depending on the type of test used, countries may only be counting people who are actively infected, excluding those who had the disease but were cured. This will lead to an underestimation of the denominator as well, and hence the CFR will be overestimated. In other words, by not counting the people who don’t need hospital care, we are massively over projecting the percent of infected people who die of COVID-19. It’s a dangerous message that is causing fear all driven by a false denominator.
On the other hand, authors from institutes in France, Switzerland and China suggested in the journal Lancet that CFR is underestimated and they suggest that the denominator of the mortality rate be the total number of patients infected at the same time as those who died. However, this suggestion was criticised by Marc Lipsitch of the Harvard School of Public Health in the same journal. Referring to their suggestion he says, “The authors make the situation worse: correcting for delay (with an invalid method) without correcting for ascertainment of mild cases inflates the estimates, bringing them further from what most experts believe are the true numbers, around the 1–2 per cent range for symptomatic cases.”
Official tallies of deaths from the COVID-19 pandemic generally refer to dead people who tested positive for COVID-19 according to official protocols. The number of true fatalities from COVID-19 may be much higher, as it may not include people who die without testing – e.g. at home or in nursing homes. There are indications of undercounting of deaths in Brazil, China, Iran, North Korea, Russia, the UK, and the U.S. Such underestimation often occurs in pandemics, such as the 2009 H1N1 swine flu epidemic.
______
Why CFR differ:
In Italy, the death rate from Covid-19 is more than 10 times greater than in Germany. Why does the death rate vary so much internationally? At first it can seem surprising that the same virus – which doesn’t seem to have mutated significantly as it has spread – can lead to such widely differing reported mortality rates. And even within one country, the rate appears to change over time. Several main factors account for much of the difference we’re seeing – and perhaps the most important come down to simply how we’re counting, as well as testing, cases.
Let us look at some of the broad reasons why death rates can look so starkly different from place to place.
First, we know that there are big differences in the risk the virus poses to different age groups. For this coronavirus, SARS-CoV-2, older individuals are far more likely to become critically ill or die from the disease. In a new paper in The Lancet Infectious Diseases, researchers concluded, when looking at data from China and elsewhere, that people between the ages of 40 and 49 have an estimated CFR of about 0.4 percent; for those 80 and older, it’s 13.4 percent. This gulf of survivability is already playing out in some countries with older populations, such as Italy. Additionally, Covid-19 has been demonstrably deadlier for those with existing health conditions, including lung disease (often caused by smoking), cardiovascular disease, severe obesity, diabetes, kidney failure, and liver disease. So countries — or regions — with less healthy populations might also be seeing big differences in the rates at which people are dying from the illness.
Beyond the varying impacts of the illness itself, there are lots of variables in how numbers are being gathered and reported. Perhaps the biggest factor here is testing. When experts calculate a basic fatality rate, it can be as simple as dividing the number of deaths by the number of confirmed cases.
Since the international spread of the novel coronavirus, countries have varied widely in their ability and willingness to roll out testing. So that means the denominator (the number of cases) can be closer or further from an accurate count of how many people actually have the virus. The larger the percentage of a population that has been tested, the more complete picture we will get of the virus’s actual fatality rate there.
The other issue with the poor testing rates is sampling bias. Tests that are available are usually saved for the sickest and riskiest cases. This pushes the fatality rate higher than it actually is because the testing is more likely to omit mild or asymptomatic cases and instead overrepresents those who are more likely to die. So, as testing finally becomes more widespread in various countries, their fatality rates will drop.
That is no reason for optimism, as the authors of a study in The Lancet note. The researchers offer an overall CFR for Covid-19 at 1.38 percent, which reflects their estimates for lack of testing and other factors, including potential censorship. This number, they noted, is still “substantially higher than for recent influenza pandemics (e.g. H1N1 influenza in 2009)” — “swine flu” — which had a case fatality rate of 0.1 percent. Their estimated CFR, “combined with likely infection attack rates (around 50-80 percent), show[s] that even the most advanced health-care systems are likely to become overwhelmed.” It is clear that this is far worse than the seasonal flu. Another way to look at death rates — in the absence of widespread testing — is to compare the number of Covid-19 deaths to a country’s total population, which is what researchers have done here. In another effort to make up for incomplete testing (and possibly incomplete reporting), researchers are attempting to estimate what percentage of actual cases have been reported (as of a couple weeks ago) for each country.
The other factors likely impacting the vastly different fatality rates include a country’s resources (particularly its health care capacity), its organization (such as how easily it can institute effective, widespread public health measures), and how forthcoming it is with data.
We will likely see other factors emerge as the pandemic rages on and more data comes in.
_
Between countries, case fatality rates vary significantly, and over time, which suggests considerable uncertainty over the exact case fatality rates.
- The number of cases detected by testing will vary considerably by country;
- Selection bias can mean those with severe disease are preferentially tested;
- There may be delays between symptoms onset and deaths which can lead to underestimation of the CFR;
- There may be factors that account for increased death rates such as coinfection, more inadequate healthcare, patient demographics (i.e., older patients might be more prevalent in countries such as Italy);
- There may be increased rates of smoking or comorbidities amongst the fatalities.
- Differences in how deaths are attributed to Coronavirus: dying with the disease (association) is not the same as dying from the disease (causation).
_
The death-to-case ratio reflects the number of deaths divided by the number of diagnosed cases within a given time interval. Based on Johns Hopkins University statistics, the global death-to-case ratio for covid-19 is 6.2% (119,686/1,920,918) as of 14 April 2020.The number varies by region. In China, estimates for the death-to-case ratio decreased from 17.3 per cent (for those with onset of symptoms from 1 to 10 January 2020) to 0.7 per cent (for those with onset of symptoms after 1 February 2020).
The case fatality rate (CFR) reflects the percentage of diagnosed people who die from a disease, and the infection fatality rate (IFR), which reflects the percentage of infected (diagnosed and undiagnosed) who die from a disease. These statistics are not timebound and follow a specific population from infection through case resolution. A number of academics have attempted to calculate these numbers for specific populations. The University of Oxford’s Centre for Evidence-Based Medicine estimates that the infection fatality rate for the pandemic as a whole is between 0.1 per cent and 0.39 per cent. The upper estimate of this range is consistent with the first random testing in Germany, and a study analysing the impact of testing on CFR estimates. If this is the true rate, locking down the world with tremendous social and financial consequences may be totally counterproductive. It’s like an elephant being attacked by a house cat. Frustrated and trying to avoid the cat, the elephant accidentally jumps off a cliff and dies.
_
Could the Covid-19 case fatality rate be that low?
No, some say, pointing to the high rate in elderly people. However, even some so-called mild or common-cold-type coronaviruses that have been known for decades can have case fatality rates as high as 8% when they infect elderly people in nursing homes. In fact, such “mild” coronaviruses infect tens of millions of people every year, and account for 3% to 11% of those hospitalized in the U.S. with lower respiratory infections each winter. These “mild” coronaviruses may be implicated in several thousands of deaths every year worldwide, though the vast majority of them are not documented with precise testing. Instead, they are lost as noise among 60 million deaths from various causes every year.
Although successful surveillance systems have long existed for influenza, the disease is confirmed by a laboratory in a tiny minority of cases. In the U.S., for example, so far this season 1,073,976 specimens have been tested and 222,552 (20.7%) have tested positive for influenza. In the same period, the estimated number of influenza-like illnesses is between 36,000,000 and 51,000,000, with an estimated 22,000 to 55,000 flu deaths.
Note the uncertainty about influenza-like illness deaths: a 2.5-fold range, corresponding to tens of thousands of deaths. Every year, some of these deaths are due to influenza and some to other viruses, like common-cold coronaviruses.
In an autopsy series that tested for respiratory viruses in specimens from 57 elderly persons who died during the 2016 to 2017 influenza season, influenza viruses were detected in 18% of the specimens, while any kind of respiratory virus was found in 47%. In some people who die from viral respiratory pathogens, more than one virus is found upon autopsy and bacteria are often superimposed. A positive test for coronavirus does not mean necessarily that this virus is always primarily responsible for a patient’s demise.
__
Germany’s low coronavirus mortality rate intrigues experts:
Germany’s relatively low mortality rate continues to intrigue experts as Covid-19 spreads across Europe, with some questioning the methodology behind its data gathering while others argue the country’s high testing rates allow a more accurate approximation of the threat posed by the novel coronavirus. Germany currently has the lowest mortality rate of the 10 countries most severely hit by the pandemic: 0.3% compared with 9% in Italy and 4.6% in the UK. The contrast with Italy is especially surprising because the two countries have the highest percentage of citizens aged 65 or over in Europe. If anything, the Bloomberg Global Health Index would suggest Italians have a healthier lifestyle than Germans.
One likely explanation for the discrepancy in figures was that while northern Italy’s hospitals are being overrun with new patients, Germany’s are not yet at full capacity and have had more time to clear beds, stock up on equipment and redistribute personnel. Unlike in Italy, there is currently no widespread post-mortem testing for the novel coronavirus in Germany. Those who were not tested for Covid-19 in their lifetime but are suspected to have been infected with the virus “can” be tested after death, but in Germany’s decentralised health system this is not yet a routine practice. As a result, it is theoretically possible that there could be people who may have died in their homes before being tested and who do not show up in the statistics.
______
As global COVID-19 total passes 850,000, a study shows 1.4% fatality rate: March 31, 2020
In research developments, scientists from the MRC Center for Global Infectious Disease Analysis at Imperial College London estimated that symptom onset to death is 18 days and that the case-fatality rate (CFR) in and outside of China is 1.4%, but declined to 0.66 after adjusting for undiagnosed cases. The team, which based its findings on case data from people who died from COVID-19, published its findings in The Lancet Infectious Diseases. The hospitalization rate was 8.2% for people in their 50s, but rose to 18.4% for people ages 80 and older.
In another article in the NEJM, Guan et al. report mortality of 1.4% among 1099 patients with laboratory-confirmed Covid-19; these patients had a wide spectrum of disease severity. If one assumes that the number of asymptomatic or minimally symptomatic cases is several times as high as the number of reported cases, the case fatality rate may be considerably less than 1%. This suggests that the overall clinical consequences of Covid-19 may ultimately be more akin to those of a severe seasonal influenza (which has a case fatality rate of approximately 0.1%) or a pandemic influenza (similar to those in 1957 and 1968) rather than a disease similar to SARS or MERS, which have had case fatality rates of 9 to 10% and 36%, respectively.
_____
Estimating the burden of SARS-CoV-2 in France, May 2020:
France has been heavily affected by the SARS-CoV-2 epidemic and went into lockdown on the 17 March 2020. Using models applied to hospital and death data, authors estimate the impact of the lockdown and current population immunity. They find 3.6% of infected individuals are hospitalized and 0.7% die, ranging from 0.001% in those <20 years of age to 10.1% in those >80 years of age. Across all ages, men are more likely to be hospitalized, enter intensive care, and die than women. The lockdown reduced the reproductive number from 2.90 to 0.67 (77% reduction). By 11 May 2020, when interventions are scheduled to be eased, authors project 2.8 million (range: 1.8–4.7) people, or 4.4% (range: 2.8–7.2) of the population, will have been infected. Population immunity appears insufficient to avoid a second wave if all control measures are released at the end of the lockdown.
Researchers estimate that in France, just 4.4% of the population has been infected with SARS-CoV-2. Their modeling study, reported in Science, also suggests that 65% of the world would need to be immune to establish herd immunity. They write, “Our results therefore strongly suggest that, without a vaccine, herd immunity on its own will be insufficient to avoid a second wave at the end of the lockdown [scheduled for May 11].” Their estimates of a low level of immunity against SARS-CoV-2 indicates that efficient control measures that limit transmission risk will have to be maintained beyond the 11 May 2020 to avoid a rebound of the epidemic.
Note: This study estimated CFR to be 0.7%.
____
New estimate by CDC reduces COVID-19 death rate to just 0.26% (IFR) from WHO’s 3.4% (CFR):
For the first time, the US Centers for Disease Control and Prevention (CDC) has given a realistic estimate of the overall death rate for COVID-19, which in its most likely scenario is 0.26 %. They estimate a 0.4 % fatality rate among the symptomatic cases. If you consider their projection that 35% of all infected cases remain asymptomatic, the overall infection fatality rate (IFR) drops to just 0.26 %. This is almost exactly what the Stanford researchers had projected in April 2020.
Revised Fatality Rates by CDC (22 May 2020)
The new estimates of fatality rate released by the CDC are as follows for different age groups:
0-49 years old: 0.05%
50-64 years old: 0.2%
65+ years old: 1.3%
Overall ages: 0.4%
The CDC has also cautioned that the numbers are likely to change as new data arrives. But, if you consider how we have gone from 3.4 % to 2.0 % to now 0.26 %, it seems more likely that the number might get even lower as we get more data.
_____
_____
Section-12
Is CQ/HCQ helpful or harmful:
_
Recently, a novel coronavirus (2019-nCoV), officially known as severe acute respiratory syndrome coronavirus 2 (SARS-CoV-2), emerged in China. Despite drastic containment measures, the spread of this virus is ongoing. SARS-CoV-2 is the etiological agent of coronavirus disease 2019 (COVID-19) characterised by pulmonary infection in humans. The efforts of international health authorities have since focused on rapid diagnosis and isolation of patients as well as the search for therapies able to counter the most severe effects of the disease. In the absence of a known efficient therapy and because of the situation of a public-health emergency, it made sense to investigate the possible effect of chloroquine/hydroxychloroquine against SARS-CoV-2 since this molecule was previously described as a potent inhibitor of most coronaviruses, including SARS-CoV-1. Preliminary trials of chloroquine repurposing in the treatment of COVID-19 in China have been encouraging, leading to several new trials.
Chloroquine (CQ) and the 4-aminoquinoline drug hydroxychloroquine (HCQ) belong to the same molecular family. Hydroxychloroquine differs from chloroquine by the presence of a hydroxyl group at the end of the side chain: the N-ethyl substituent is β-hydroxylated. This molecule is available for oral administration in the form of hydroxychloroquine sulfate. Hydroxychloroquine has pharmacokinetics similar to that of chloroquine, with rapid gastrointestinal absorption and renal elimination. However, the clinical indications and toxic doses of these drugs slightly differ.
_
Lines of attack:
Experimental treatment strategies being tested by a large WHO study and other clinical trials attempt to interfere with different steps (numbered) in the coronavirus replication cycle as seen in the figure below:
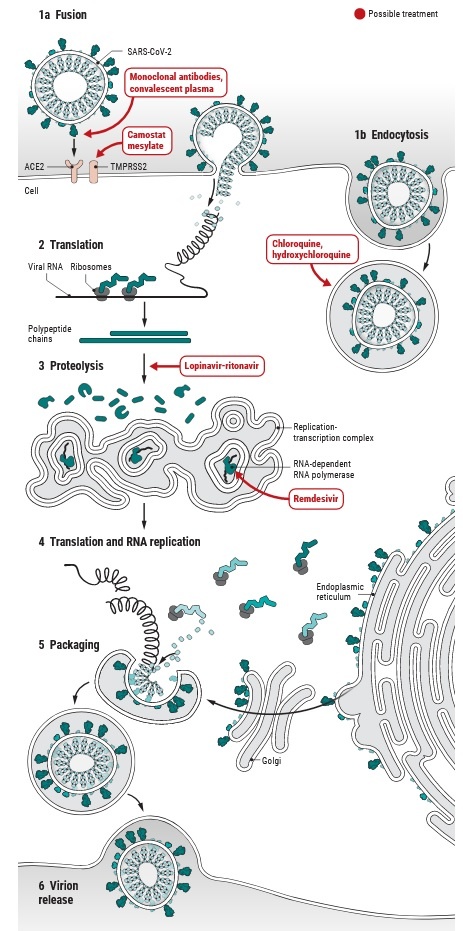
_
The recent publication of results showing the activity of chloroquine (CQ) against SARS-CoV-2 in vitro, some experts and researchers also have been recommended the efficacy of this antimalarial drug in patients with COVID-19. For this, the U.S. Food and Drug Administration (FDA) has been working to investigate the use of CQ in COVID-19. As a derivative of CQ, hydroxychloroquine (HCQ) has similar therapeutic effects and fewer adverse effects. Based on its characteristics of immunity regulation, antithrombotic activity, and inflammation improvement, HCQ has been routinely used in the clinical treatment of systemic lupus erythematosus (SLE). However, the efficacy of HCQ in COVID-19 remains unknown. Interestingly, through a follow-up survey, researchers found that none of their 80 SLE patients who took long-term oral HCQ had been confirmed to have SARS-CoV-2 infection or appeared to have related symptoms.
Several agents or drugs including, remdesivir, favipiravir, ribavirin, lopinavir–ritonavir (used in combination) and chloroquine (CQ) or hydroxychloroquine (HCQ), have been highlighted based on the promising in-vitro results and therapeutic experiences from another two coronavirus diseases including the severe acute respiratory syndrome (SARS) and the Middle East respiratory syndrome (MERS). However, none of these promising results has yet been translated into clinical benefits of patients with COVID-19, including lopinavir–ritonavir, reported from the most recently failed trial. Another “wonder drug”, CQ and its hydroxy-analogue HCQ, are glaring on the list of COVID-19 therapy, due to potent antiviral activity against SARS-CoV-2 from in-vitro studies, and promising results from news reports of some ongoing trials. Despite their unclear benefits, CQ and HCQ are both recommended for off-label use in the treatment of COVID-19 by the Chinese National guideline and recently authorized by the U.S. Food and Drug Administration for emergency uses. HCQ was also recently recommended by the American president Donald Trump. Such a presidential endorsement stimulates an avalanche of demand for HCQ, which buried the dark-side of this drug. Deaths have been reported in Nigeria among people self-treating for apparent COVID-19 with CQ overdoses. Retinopathy, gastrointestinal and cardiac side effects are well documented with the use of CQ or HCQ in the treatment of malarial and rheumatic diseases. HCQ is preferred in clinical applications due to its lower toxicity, particularly retinal toxicity, and three times the potency against SARS-CoV-2 infection comparing to CQ in the recent in-vitro study. Currently, there is no convincing evidence from well-designed clinical trials to support the use of CQ/HCQ with good efficacy and safety for the treatment of COVID-19. Rapidly conduction of such trails with high-quality is challenging in the face of a dangerous coronavirus outbreak, in which, healthcare workers are under overwhelming work and highest risk of exposure to developing COVID-19.
_
Evidence shows that high levels of inflammation accompany the most severe cases of COVID-19. Hyperactive (uncontrolled) immune responses can lead to Cytokine Storm Syndrome, Acute Respiratory Distress Syndrome and eventual organ failure. Decreasing inflammation helps keep the lungs and other organs functioning properly during viral infection. Chloroquine and hydroxychloroquine reduce autophagy (self-regulated destruction of host cells), interfere with Toll-like receptor (TLR) signaling and decrease cytokine production. As a result, inflammation is controlled and immune responses are less severe. Evidence suggests that chloroquine and hydroxychloroquine may also interfere with the glycosylation of SARS-CoV-2 cellular receptors and prevent virus/cell fusion by increasing endosomal pH. Both of these drugs are currently FDA approved for the treatment of malaria, rheumatoid arthritis and lupus and have shown in vitro activity against SARS-CoV and SARS-CoV-2.
______
New insights on the antiviral effects of chloroquine against coronavirus: what to expect for COVID-19? A March 2020 study:
Here authors discuss the possible mechanisms of chloroquine interference with the SARS-CoV-2 replication cycle.
Antiviral properties of chloroquine:
In vitro, chloroquine appears as a versatile bioactive agent reported to possess antiviral activity against RNA viruses as diverse as rabies virus, poliovirus, HIV, hepatitis A virus, hepatitis C virus, influenza A and B viruses, influenza A H5N1 virus, Chikungunya virus , Dengue virus, Zika virus, Lassa virus, Hendra and Nipah viruses, Crimean–Congo hemorrhagic fever virus and Ebola virus, as well as various DNA viruses such as hepatitis B virus and herpes simplex virus. The antiviral properties of chloroquine described in vitro have sometimes been confirmed during treatment of virus-infected patients but have not always been reproduced in clinical trials depending on the disease, the concentration of chloroquine used, the duration of treatment and the clinical team in charge of the trial.
Regarding coronaviruses, the potential therapeutic benefits of chloroquine were notably reported for SARS-CoV-1. Chloroquine was also reported to inhibit in vitro the replication of HCoV-229E in epithelial lung cell cultures. In 2009, it was reported that lethal infections of newborn mice with the HCoV-O43 coronavirus could be averted by administering chloroquine through the mother’s milk. In vitro experiments also showed a strong antiviral effect of chloroquine on a recombinant HCoV-O43 coronavirus. Although chloroquine was reported to be active against Middle East respiratory syndrome coronavirus (MERS-CoV) in vitro, this observation remains controversial.
Potential antiviral effect of chloroquine against SARS-CoV-2:
Because of its broad spectrum of action against viruses, including most coronaviruses and particularly its close relative SARS-CoV-1, and because coronavirus cell entry occurs through the endolysosomal pathway, it made sense in a situation of a public-health emergency and the absence of any known efficient therapy to investigate the possible effect of chloroquine against SARS-CoV-2. A recent paper reported that both chloroquine and the antiviral drug remdesivir inhibited SARS-CoV-2 in vitro and suggested these drugs be assessed in human patients suffering from COVID-19.
Mode of action of chloroquine:
Chloroquine has multiple mechanisms of action that may differ according to the pathogen studied.
Chloroquine can inhibit a pre-entry step of the viral cycle by interfering with viral particles binding to their cellular cell surface receptor. Chloroquine was shown to inhibit quinone reductase 2, a structural neighbour of UDP-N-acetylglucosamine 2-epimerases that are involved in the biosynthesis of sialic acids. The sialic acids are acidic monosaccharides found at the extremity of sugar chains present on cell transmembrane proteins and are critical components of ligand recognition. The possible interference of chloroquine with sialic acid biosynthesis could account for the broad antiviral spectrum of that drug since viruses such as the human coronavirus HCoV-O43 and the orthomyxoviruses use sialic acid moieties as receptors. The potent anti-SARS-CoV-1 effects of chloroquine in vitro were considered attributable to a deficit in the glycosylation of a virus cell surface receptor, the angiotensin-converting enzyme 2 (ACE2) on Vero cells.
Chloroquine can also impair another early stage of virus replication by interfering with the pH-dependent endosome-mediated viral entry of enveloped viruses such as Dengue virus or Chikungunya virus. Due to the alkalisation of endosomes, chloroquine was an effective in vitro treatment against Chikungunya virus when added to Vero cells prior to virus exposure. The mechanism of inhibition likely involved the prevention of endocytosis and/or rapid elevation of the endosomal pH and abrogation of virus–endosome fusion. A pH-dependent mechanism of entry of coronavirus into target cells was also reported for SARS-CoV-1 after binding of the DC-SIGN receptor. The activation step that occurs in endosomes at acidic pH results in fusion of the viral and endosomal membranes leading to the release of the viral SARS-CoV-1 genome into the cytosol. In the absence of antiviral drug, the virus is targeted to the lysosomal compartment where the low pH, along with the action of enzymes, disrupts the viral particle, thus liberating the infectious nucleic acid and, in several cases, enzymes necessary for its replication. Chloroquine-mediated inhibition of hepatitis A virus was found to be associated with uncoating, thus blocking its entire replication cycle.
Chloroquine can also interfere with the post-translational modification of viral proteins. These post-translational modifications, which involve proteases and glycosyltransferases, occur within the endoplasmic reticulum or the trans-Golgi network vesicles and may require a low pH. For HIV, the antiretroviral effect of chloroquine is attributable to a post-transcriptional inhibition of glycosylation of the gp120 envelope glycoprotein, and the neosynthesised virus particles are non-infectious. Chloroquine also inhibits the replication Dengue-2 virus by affecting the normal proteolytic processing of the flavivirus prM protein to M protein. As a result, viral infectivity is impaired. In the herpes simplex virus (HSV) model, chloroquine inhibited budding with accumulation of non-infectious HSV-1 particles in the trans-Golgi network. Using non-human coronavirus, it was shown that the intracellular site of coronavirus budding is determined by the localisation of its membrane M proteins that accumulate in the Golgi complex beyond the site of virion budding, suggesting a possible action of chloroquine on SARS-CoV-2 at this step of the replication cycle. It was recently reported that the C-terminal domain of the MERS-CoV M protein contains a trans-Golgi network localisation signal.
Beside affecting the virus maturation process, pH modulation by chloroquine can impair the proper maturation of viral protein and the recognition of viral antigen by dendritic cells, which occurs through a Toll-like receptor-dependent pathway that requires endosomal acidification. On the contrary, other proposed effects of chloroquine on the immune system include increasing the export of soluble antigens into the cytosol of dendritic cells and the enhancement of human cytotoxic CD8+ T-cell responses against viral antigens. In the influenza virus model, it was reported that chloroquine improves the cross-presentation of non-replicating virus antigen by dendritic cells to CD8+ T-cells recruited to lymph nodes draining the site of infection, eliciting a broadly protective immune response.
Chloroquine can also act on the immune system through cell signalling and regulation of pro-inflammatory cytokines. Chloroquine is known to inhibit phosphorylation (activation) of the p38 mitogen-activated protein kinase (MAPK) in THP-1 cells as well as caspase-1. Activation of cells via MAPK signalling is frequently required by viruses to achieve their replication cycle. In the model of HCoV-229 coronavirus, chloroquine-induced virus inhibition occurs through inhibition of p38 MAPK. Chloroquine is a well-known immunomodulatory agent capable of mediating an anti-inflammatory response. Therefore, there are clinical applications of this drug in inflammatory diseases such as rheumatoid arthritis, lupus erythematosus and sarcoidosis. Chloroquine inhibits interleukin-1 beta (IL-1β) mRNA expression in THP-1 cells and reduces IL-1β release. Chloroquine-induced reduction of IL-1 and IL-6 cytokines was also found in monocytes/ macrophages. Chloroquine-induced inhibition of tumour necrosis factor-alpha (TNFα) production by immune cells was reported to occur either through disruption of cellular iron metabolism, blockade of the conversion of pro-TNF into soluble mature TNFα molecules and/or inhibition of TNFα mRNA expression. Inhibition of the TNFα receptor was also reported in U937 monocytic cells treated with chloroquine. In the Dengue virus model, chloroquine was found to inhibit interferon-alpha (IFNα), IFNβ, IFNγ, TNFα, IL-6 and IL-12 gene expression in U937 cells infected with Dengue-2 virus.
_
Figure below shows schematic representation of the possible effects of chloroquine on the severe acute respiratory syndrome coronavirus 2 (SARS-CoV-2) replication cycle.
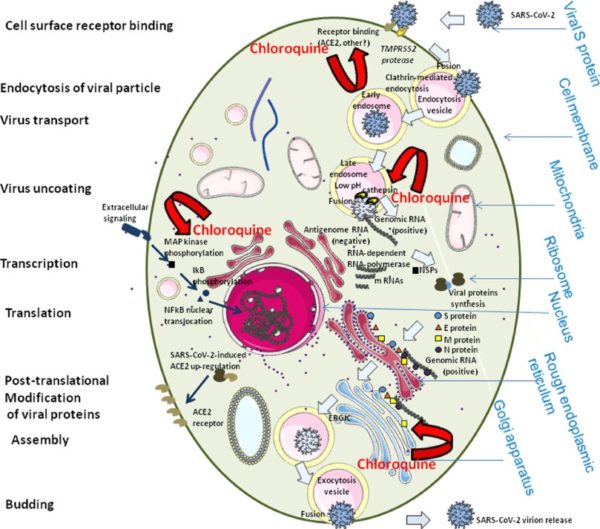
It is possible that chloroquine interferes with ACE2 receptor glycosylation, thus preventing SARS-CoV-2 binding to target cells. Chloroquine could also possibly limit the biosynthesis of sialic acids that may be required for cell surface binding of SARS-CoV-2. If binding of some viral particles is achieved, chloroquine may modulate the acidification of endosomes thereby inhibiting formation of the autophagosome. Through reduction of cellular mitogen-activated protein (MAP) kinase activation, chloroquine may also inhibit virus replication. Moreover, chloroquine could alter M protein maturation and interfere with virion assembly and budding. ERGIC, ER-Golgi intermediate compartment.
_____
Chloroquine, an antimalarial agent with anti-inflammatory and immunomodulatory activities, has gained significant interest as a potential therapeutic option for the management of COVID-19. In early February,
Wang and colleagues demonstrated potent in vitro activity of chloroquine against SARS-CoV-2 with an EC50 at 48 hours of 1.13 µM in Vero E6 cells. These data were consistent with previous data for chloroquine’s inhibitory activity against SARS-CoV-1 and MERS-CoV in various cell lines, where EC50 values of 1 – 8.8 and 3.0 µM were demonstrated, respectively. These findings have supported the clinical use of chloroquine, at a dose of 500 mg by mouth twice daily, in numerous clinical trials in China during this outbreak. While the rationale for this dosing regimen remains unclear, and peer reviewed data from the trials are currently unavailable, it was announced in mid-February that promising early results have been demonstrated. As per Gao and colleagues, “thus far, results from more than 100 patients have demonstrated that chloroquine phosphate is superior to the control treatment in inhibiting the exacerbation of pneumonia, improving lung imaging findings, promoting a virus-negative conversion, and shortening the disease course according to the news briefing. Severe adverse reactions to chloroquine phosphate were not noted in the aforementioned patients.”
While this development has been encouraging, supply issues in the United States and cardiovascular toxicity concerns limit the use of chloroquine. As an alternative, hydroxychloroquine, a compound that differs from chloroquine only by a single hydroxyl group, has garnered interest. Hydroxychloroquine is perceived as having better tolerability than chloroquine, which has led to long-term usage in rheumatological disorders. Historically, very limited data were published assessing the activity of hydroxychloroquine against coronaviruses. In 2006, Biot and colleagues assessed the comparative inhibitory activity of chloroquine and hydroxychloroquine against SARS-CoV-1 in Vero cells. The authors demonstrated that chloroquine had a roughly 5-fold increased potency (EC50 of 6.5 ± 3.2 µM) compared to that of hydroxychloroquine (EC50 of 34 ± 5 µM).
Against SARS-CoV-2, Yao and colleagues performed a two-part study assessing the comparative in vitro activity of chloroquine and hydroxychloroquine and performed pharmacology based pharmacokinetic (PBPK) modelling to assess comparative exposure and predicted activity of these two compounds in the lung. In vitro analyses in Vero cells demonstrated that the potency of hydroxychloroquine (EC50 of 0.72 µM) was greater than that of chloroquine (EC50 of 5.47 µM) against SARS-CoV-2.
In order to inform optimal dosing of hydroxychloroquine the investigators then performed PBPK modeling. In this analysis the investigators utilized human population pharmacokinetic and rat lung penetration data for each compound to estimate free trough concentrations in the lung to EC50 ratios (RLTEC). Since chloroquine 500mg by mouth twice daily has been reported to demonstrate efficacy against SARS-CoV-2 the target RLTEC for hydroxychloroquine regimens was set to ≥ 2.38 (day 1), 5.92 (day 3), and 18.9 (day 5) which were the RLTEC values predicted with the “efficacious” 500 mg by mouth twice daily dosing of chloroquine. Various dosing regimens were simulated, but two are particularly notable. The first was an oral loading dose of 1200 mg (divided 800 mg then 400 mg) on day 1, followed by 400 mg daily. This regimen led to significantly higher RLTEC on day 1 (33.3), day 3 (55.1), and day 5 (103) than those values demonstrated with chloroquine. The second regimen was a loading dose of 800 mg (400 mg x 2) on day 1 followed by 200 mg twice daily. This was also associated with higher RLTEC values than chloroquine on day 1, 3, and 5 (corresponding to 21.0, 38.9, and 85.4, respectively). The authors concluded these data support the lower dose regimen as RLTEC values were significantly higher than those with the “proven efficacious” regimen of chloroquine 500mg by mouth twice daily. Clinicians should note both chloroquine and hydroxychloroquine have half-lives of ~40 days, and therefore short durations would likely provide prolonged courses of therapy. This was exemplified in the PBPK modelling where RLTEC values with hydroxychloroquine were predicted to still above the targeted efficacy threshold on day 10, even with a 5-day course of therapy.
_
Chloroquine and hydroxychloroquine are relatively well tolerated as demonstrated by extensive experience in patients with SLE and malaria. However, both agents can cause rare and serious adverse effects (<10%), including QTc prolongation, hypoglycemia, neuropsychiatric effects, and retinopathy. Baseline electrocardiography to evaluate for prolonged QTc is advisable prior to and following initiation of these medications because of the potential for arrhythmias, especially in critically ill patients and those taking concomitant QT-interval prolonging medications such as azithromycin and fluoroquinolones. No significant adverse effects have been reported for chloroquine at the doses and durations proposed for COVID-19. Use of chloroquine and hydroxychloroquine in pregnancy is generally considered safe. A review of 12 studies including 588 patients receiving chloroquine or hydroxychloroquine during pregnancy found no overt infant ocular toxicity.
______
______
Some studies show that HCQ is beneficial in covid-19:
_
Study-1
Hydroxychloroquine and azithromycin as a treatment of COVID-19: results of an open-label non-randomized clinical trial, March 2020:
This recent open-label nonrandomized French study of 36 patients (20 in the hydroxychloroquine group and 16 in the control group) reported improved virologic clearance with hydroxychloroquine, 200 mg, by mouth every 8 hours compared with control patients receiving standard supportive care. Virologic clearance at day 6, measured by nasopharyngeal swabs, was 70% (14/20) vs 12.5% (2/16) for the hydroxychloroquine and control groups, respectively (P = .001). The authors also reported that addition of azithromycin to hydroxychloroquine in 6 patients resulted in numerically superior viral clearance (6/6, 100%) compared with hydroxychloroquine monotherapy (8/14, 57%).
Despite these promising results, this study had several major limitations: a small sample size (only 20 in the intervention arm and only 6 receiving hydroxychloroquine and azithromycin); the removal of 6 patients in the hydroxychloroquine group from analysis due to early cessation of treatment resulting from critical illness or intolerance of the medications; variable baseline viral loads between hydroxychloroquine monotherapy and combination therapy groups; and no clinical or safety outcomes reported. These limitations coupled with concerns of additive cardiotoxicity with combination therapy do not support adoption of this regimen without additional studies.
_
Study-2
Efficacy of hydroxychloroquine in patients with COVID-19: results of a randomized clinical trial March 2020:
Aims: Studies have indicated that chloroquine (CQ) shows antagonism against COVID-19 in vitro. However, evidence regarding its effects in patients is limited. This study aims to evaluate the efficacy of hydroxychloroquine (HCQ) in the treatment of patients with COVID-19.
Main methods: From February 4 to February 28, 2020, 62 patients suffering from COVID-19 were diagnosed and admitted to Renmin Hospital of Wuhan University. All participants were randomized in a parallel-group trial, 31 patients were assigned to receive an additional 5-day HCQ (400 mg/d) treatment, Time to clinical recovery (TTCR), clinical characteristics, and radiological results were assessed at baseline and 5 days after treatment to evaluate the effect of HCQ.
Significance: Among patients with COVID-19, the use of HCQ could significantly shorten TTCR and promote the absorption of pneumonia.
Conclusion: Despite small number of cases, the potential of HCQ in the treatment of COVID-19 has been partially confirmed. Considering that there is no better option at present, it is a promising practice to apply HCQ to COVID-19 under reasonable management. However, Large-scale clinical and basic research is still needed to clarify its specific mechanism and to continuously optimize the treatment plan.
_
Study-3
Hydroxychloroquine in patients with COVID-19: an open-label, randomized, controlled trial, April 2020:
What is already known on this topic:
The potent in-vitro effects of hydroxychloroquine (HCQ) against SARS-CoV-2 has not convincingly been translated into clinical benefits in patients with COVID-19. A non-randomized trial showed significantly higher virus clearance rate at 6-day post inclusion in patients receiving 600mg hydroxychloroquine daily (N=20) than in patients with standard-of-care (N=16). In contrast, a randomized study of hydroxychloroquine published in Chinese showed no impact of hydroxychloroquine with a dose of 400mg hydroxychloroquine daily for 5 days on increasing virus negative conversion rate and alleviation of clinical symptoms in 30 patients with COVID-19.
What this study adds:
In this multicenter, parallel, open-label randomized trial that included 150 adult patients hospitalized for COVID-19, adding hydroxychloroquine to the current standard-of-care in patients with COVID-19 does not increase virus response but accelerate the alleviation of clinical symptoms, possibly through anti-inflammatory properties and recovery of lymphopenia. Clinicians might consider hydroxychloroquine treatment in symptomatic patients with elevated CRP and/or lymphopenia because hydroxychloroquine might prevent disease progression, particularly in patients at higher risk.
Side effects of HCQ should be closely monitored, although no apparent safety concerns were observed in this trial using HCQ with a loading dose of 1, 200 mg daily for three days followed by a maintained dose of 800 mg daily for the remaining days (total treatment duration: 2 or 3 weeks for mild/moderate or severe patients, respectively).
_______
_______
Some studies show that HCQ is not beneficial, may be harmful in covid-19:
_
Study-1
In a prospective study of 30 patients in China randomized patients received hydroxychloroquine, 400 mg, daily for 5 days plus standard of care (supportive care, interferon, and other antivirals) or standard care alone in a 1:1 fashion; there was no difference in virologic outcomes. At day 7, virologic clearance was similar, with 86.7% vs 93.3% clearance for the hydroxychloroquine plus standard of care group and standard care group, respectively (P > .05).
_
Study-2
No evidence of clinical efficacy of hydroxychloroquine in patients hospitalised for COVID-19 infection and requiring oxygen: April 2020:
Methods:
Authors used data collected from routine care of all adults in 4 French hospitals with documented SARS-CoV-2 pneumonia and requiring oxygen ≥ 2 L/min to emulate a target trial aimed at assessing the effectiveness of HCQ at 600 mg/day. The composite primary endpoint was transfer to intensive care unit (ICU) within 7 days from inclusion and/or death from any cause. Analyses were adjusted for confounding factors by inverse probability of treatment weighting.
Results:
This study included 181 patients with SARS-CoV-2 pneumonia; 84 received HCQ within 48 hours of admission (HCQ group) and 97 did not (no-HCQ group). Initial severity was well balanced between the groups. In the weighted analysis, 20.2% patients in the HCQ group were transferred to the ICU or died within 7 days vs 22.1% in the no-HCQ group (16 vs 21 events, relative risk [RR] 0.91, 95% CI 0.47–1.80). In the HCQ group, 2.8% of the patients died within 7 days vs 4.6% in the no-HCQ group (3 vs 4 events, RR 0.61, 95% CI 0.13–2.89), and 27.4% and 24.1%, respectively, developed acute respiratory distress syndrome within 7 days (24 vs 23 events, RR 1.14, 95% CI 0.65–2.00). Eight patients receiving HCQ (9.5%) experienced electrocardiogram modifications requiring HCQ discontinuation.
Interpretation:
These results do not support the use of HCQ in patients hospitalised for documented SARSCoV-2-positive hypoxic pneumonia.
Authors found that HCQ treatment at 600 mg/day added to standard of care was not associated with a reduction of admissions to ICUs or death 7 days after hospital admission, compared to standard of care alone. The rate of ARDS did not decrease either. However, the study found eight patients who took the drug developed abnormal heart rhythms and had to stop taking it.
_
Study-3
Study finds no benefit, higher death rate in patients taking hydroxychloroquine for Covid-19, April 2020:
The study, which reviewed veterans’ medical charts, was posted on medrxiv.org, a pre-print server, meaning it was not peer reviewed or published in a medical journal. The research was funded by the National Institutes of Health and the University of Virginia. In the study of 368 patients, 97 patients who took hydroxychloroquine had a 27.8% death rate. The 158 patients who did not take the drug had an 11.4% death rate.
“An association of increased overall mortality was identified in patients treated with hydroxychloroquine alone. These findings highlight the importance of awaiting the results of ongoing prospective, randomized, controlled studies before widespread adoption of these drugs,” wrote the authors, who work at the Columbia VA Health Care System in South Carolina, the University of South Carolina and the University of Virginia.
Researchers also looked at whether taking hydroxychloroquine or a combination of hydroxychloroquine and the antibiotic azithromycin, had an effect on whether a patient needed to go on a ventilator. “In this study, we found no evidence that use of hydroxychloroquine, either with or without azithromycin, reduced the risk of mechanical ventilation in patients hospitalized with Covid-19,” the authors wrote.
_
Study-4
Trial of chloroquine to treat COVID-19 stopped early due to heart complications, April 2020:
A Brazilian study testing the antimalarial drug chloroquine for COVID-19 had to be stopped early in one group of patients taking a high dose of the drug, after some patients in this group developed dangerous heart rhythm problems.
The Brazilian researchers planned to enroll 440 people in their study to test whether chloroquine is a safe and effective treatment for COVID-19. Participants took either a “high dose” of the drug (600 milligrams twice daily for 10 days) or a “low dose” (450 mg for five days, with a double dose only on the first day). The study was “double blind,” meaning that neither the patients nor their doctors knew which dose they were receiving. However, after enrolling just 81 patients, the researchers saw some concerning signs. Within a few days of starting the treatment, more patients in the high dose group experienced heart rhythm problems than did those in the low dose group. And two patients in the high dose group developed a fast, abnormal heart rate known as ventricular tachycardia before they died. As a result of the findings, the researchers immediately halted the high-dose arm of the study. They warned against using such high doses for any COVID-19 patients.
_
Study-5
Hydroxychloroquine for COVID-19: What do the clinical trials tell us? April, 2020:
Centre for Evidence-Based Medicine, Nuffield Department of Primary Care Health Sciences:
To date five reports of the results of clinical observations of treatment of COVID-19 with hydroxychloroquine have appeared: an open-label non-randomized trial in which patients were given hydroxychloroquine or hydroxychloroquine + azithromycin; an open-label randomized placebo-controlled study of hydroxychloroquine; and three other studies, one a randomized comparison of hydroxychloroquine with standard care, one a case series, and one an observational study designed to emulate a randomized controlled trial in 181 patients. Authors have examined the protocols and preliminary trial reports of the first two of these studies, whose results are in the public domain and which have been presented as supporting the use of hydroxychloroquine. Authors have added brief notes about the three later studies, which are all negative.
The five reports are as follows:
- Hydroxychloroquine and azithromycin as a treatment of COVID-19: results of an open-label non-randomized clinical trial
The protocol (EU Clinical Trials Register No. 2020-000890-25/FR)
- Efficacy of hydroxychloroquine in patients with COVID-19: results of a randomized clinical trial
The protocol (Chinese Clinical Trial Registry: ChiCTR2000029559)
- Chen J, Liu D, Liu L, Liu P, Xu Q, Xia L, Ling Y, Huang D, Song S, Zhang D, Qian Z, Li T, Shen Y, Lu H. A pilot study of hydroxychloroquine in treatment of patients with common coronavirus disease-19 (COVID-19). Journal of Zhejiang University March 2020. DOI:10.3785/j.issn.1008-9292.2020.03.03.
- No Evidence of Rapid Antiviral Clearance or Clinical Benefit with the Combination of Hydroxychloroquine and Azithromycin in Patients with Severe COVID-19 Infection. Molina et al. Médecine et Maladies Infectieuses 2002; in press. doi:https://doi.org/10.1016/j.medmal.2020.03.006
5. No evidence of clinical efficacy of hydroxychloroquine in patients hospitalised for COVID-19 infection and requiring oxygen: results of a study using routinely collected data to emulate a target trial. Mahévas et al. medRxiv 2020 https://doi.org/10.1101/2020.04.10.20060699
Verdict:
Current data do not support the use of hydroxychloroquine for prophylaxis or treatment of COVID-19. There are no published trials of prophylaxis. Two trials of hydroxychloroquine treatment that are in the public domain, one non-peer reviewed, are premature analyses of trials whose conduct in both cases diverged from the published skeleton protocols registered on clinical trial sites. Neither they, nor three other negative trials that have since appeared, support the view that hydroxychloroquine is effective in the management of even mild COVID-19 disease.
_
Study-6
Observational Study of Hydroxychloroquine in Hospitalized Patients with Covid-19, May 2020:
Method:
Authors examined the association between hydroxychloroquine use and intubation or death at a large medical center in New York City. Data were obtained regarding consecutive patients hospitalized with Covid-19, excluding those who were intubated, died, or discharged within 24 hours after presentation to the emergency department (study baseline). The primary end point was a composite of intubation or death in a time-to-event analysis. They compared outcomes in patients who received hydroxychloroquine with those in patients who did not, using a multivariable Cox model with inverse probability weighting according to the propensity score.
Result:
Of 1446 consecutive patients, 70 patients were intubated, died, or discharged within 24 hours after presentation and were excluded from the analysis. Of the remaining 1376 patients, during a median follow-up of 22.5 days, 811 (58.9%) received hydroxychloroquine (600 mg twice on day 1, then 400 mg daily for a median of 5 days); 45.8% of the patients were treated within 24 hours after presentation to the emergency department, and 85.9% within 48 hours. Hydroxychloroquine-treated patients were more severely ill at baseline than those who did not receive hydroxychloroquine (median ratio of partial pressure of arterial oxygen to the fraction of inspired oxygen, 223 vs. 360). Overall, 346 patients (25.1%) had a primary end-point event (180 patients were intubated, of whom 66 subsequently died, and 166 died without intubation). In the main analysis, there was no significant association between hydroxychloroquine use and intubation or death (hazard ratio, 1.04, 95% confidence interval, 0.82 to 1.32). Results were similar in multiple sensitivity analyses.
Conclusion:
In this observational study involving patients with Covid-19 who had been admitted to the hospital, hydroxychloroquine administration was not associated with either a greatly lowered or an increased risk of the composite end point of intubation or death. Randomized, controlled trials of hydroxychloroquine in patients with Covid-19 are needed. (Funded by the National Institutes of Health.)
Columbia University Irving Medical Center NewYork-Presbyterian Pulmonary, Allergy and Critical Care Medicine division chief Neil Schluger said: “Given the observational design of the study, the results cannot completely exclude the possibility of either modest benefit or harm of hydroxychloroquine treatment, but the findings do not support its use outside of randomised clinical trials.” Schluger added that a randomised, controlled trial could help determine if a drug has a benefit.
__
Study-7
In the previous study by Geleris and colleagues, the primary analysis compared the risk for intubation or death in hydroxychloroquine recipients and nonrecipients, with an adjustment for predictors of respiratory failure and weighting according to propensity score for the probability of hydroxychloroquine use.
Here for Rosenberg and colleagues, hospital mortality was the primary outcome. Rosenberg assessed 1438 patients hospitalized with COVID-19 who received hydroxychloroquine alone (271 patients) or with azithromycin (735 patients), azithromycin alone (211 patients), or neither drug (221 patients). Overall in-hospital mortality was 20.3%. There was no significant difference in mortality across the groups. Cardiac arrest was significant more likely in patients receiving hydroxychloroquine with azithromycin.
_
Study-8
Chloroquine/hydroxychloroquine warning:
The FDA is warning the public that chloroquine and hydroxychloroquine should not be taken for COVID-19 outside a hospital or clinical trial setting, as the drugs confer potentially life-threatening cardiac risks. A Nature Medicine study published recently found that a cohort of 84 COVID-19 patients given the combination of hydroxychloroquine plus azithromycin had their average QTc interval increase from 435 ms at baseline to a maximal average value of 463 ms. Roughly 11% had a QTc interval above 500 ms, “a known marker of high risk of malignant arrhythmia and sudden cardiac death.”
_
Study-9
Considerations for Drug Interactions on QTc in Exploratory COVID-19, from American Heart Association, American College of Cardiology Foundation, and Heart Rhythm Society: 2020.
Hydroxychloroquine and azithromycin have been touted for potential prophylaxis or treatment for COVID-19. Both drugs are listed as definite causes of torsade de pointes at crediblemeds.org. There are occasional case reports of hydroxychloroquine prolonging the QT interval and provoking torsade de pointes when used to treat systemic lupus erythematosus. The widely used antibiotic azithromycin is increasingly recognized as a rare cause of QT prolongation, serious arrhythmias, and increased risk for sudden death; advanced age and female sex have been implicated as risk factors. Interestingly, azithromycin can also provoke non-pause–dependent polymorphic ventricular tachycardia. The FDA Perspective supported the observations that azithromycin administration leaves the patient vulnerable to QTc interval prolongation and torsade de pointes.
Basic electrophysiologic studies suggest that both drugs can provoke proarrhythmia via mechanisms beyond block of IKr (delayed rectifier K+ channel) implicated in usual cases of torsade de pointes. The effect of the combination of these agents on QT or arrhythmia risk has not been studied. There are very limited data evaluating the safety of combination therapy. Multiple randomized trials are currently being initiated. Seriously ill patients often have comorbidities that can increase risk of serious arrhythmias. These include hypokalemia, hypomagnesemia, fever, and an inflammatory state.
Mechanisms to minimize arrhythmia risk include:
- Electrocardiographic/QT interval monitoring:
-Withhold the drugs in patients with baseline QT prolongation (e.g., QTc ≥500 msec) or with known congenital long QT syndrome.
-Monitor cardiac rhythm and QT interval; withdrawal of the drugs if QTc exceeds a preset threshold of 500 msec.
-In patients critically ill with COVID-19 infection, frequent caregiver contact may need to be minimized, so optimal electrocardiographic interval and rhythm monitoring may not be possible.
- Correction of hypokalemia to levels of >4 mEq/L and hypomagnesemia to levels of >2 mg/dL.
- Avoid other QTc prolonging agents whenever feasible.
_
Study-10
COVID-19: Hydroxychloroquine & QT Prolongation, May 2020:
Two observational studies in JAMA Cardiology add to evidence that hydroxychloroquine treatment is associated with prolonged QTc interval in patients with novel coronavirus disease (COVID-19).
The first included a cohort of 90 COVID-19 patients admitted to a Boston hospital, all of whom received hydroxychloroquine, with or without azithromycin. Some 19% who received hydroxychloroquine monotherapy developed prolonged QTc of 500 ms or more; 3% had a change in QTc of 60 ms or more. With hydroxychloroquine plus azithromycin, the rates were 21% and 13%, respectively. One patient with QTc prolongation developed torsades de pointes.
Separately, in a study of 40 COVID-19 patients admitted to a French ICU who received hydroxychloroquine, over 90% experienced increased QTc interval. One third of those who received hydroxychloroquine plus azithromycin developed QTc of 500 ms or more, versus 5% of those who received hydroxychloroquine alone. There were no ventricular arrhythmias.
The authors of the first study note that without a control group, they could not rule out cardiotoxicity from COVID-19 as opposed to hydroxychloroquine and azithromycin. Editorialists, meanwhile, say the findings “underscore the potential risk associated with widespread use” of these treatments in COVID-19. They add, “Understanding whether this risk is worth taking in the absence of evidence of therapeutic efficacy creates a knowledge gap that needs to be addressed.”
_
Study-11
Hydroxychloroquine or chloroquine with or without a macrolide for treatment of COVID-19: a multinational registry analysis, May 2020:
A large registry study in the Lancet found hazards associated with use of hydroxychloroquine and chloroquine for COVID-19. Researchers compared roughly 15,000 hospitalized for COVID-19 who were given hydroxychloroquine or chloroquine with or without a second-generation macrolide with 81,000 who weren’t given these treatments. All of the hydroxychloroquine and chloroquine groups had higher rates of in-hospital mortality (16-24%) than the control group (9%). They also had higher rates of ventricular arrhythmia during hospitalization (4-8%) versus controls (0.3%).
The Lancet and the New England Journal of Medicine have retracted this study because a number of the authors were not granted access to the underlying data. The retractions may breathe new life into the antimalarial drugs hydroxychloroquine and chloroquine, relentlessly promoted by Mr. Trump as a remedy for Covid-19 despite a lack of evidence. On 3rd June 2020 after the journals noted concerns about the studies, the World Health Organization announced that it would resume trials of the medications.
But the retractions also raise troubling questions about the state of scientific research as the pandemic spreads. Thousands of papers are being rushed to online sites and journals with little or no peer review, and critics fear long-held standards of even the most discerning journals are eroding as they face pressure to rapidly vet and disseminate new scientific reports.
_
Study-12
A Randomized Trial of Hydroxychloroquine as Postexposure Prophylaxis for Covid-19, June 2020:
Hydroxychloroquine did not prevent symptomatic COVID-19 when given to adults after a moderate- to high-risk exposure, according to a randomized trial in the New England Journal of Medicine.
Over 800 asymptomatic North American adults (median age, 40) who reported a household or occupational exposure to a person with confirmed COVID-19 were randomized to receive hydroxychloroquine or placebo for 5 days, beginning within 4 days of exposure. Nearly 90% of the sample had high-risk exposures, defined as exposure within 6 feet for more than 10 minutes without a face mask or eye shield; the rest had moderate-risk exposures (wearing a mask but not a shield).
During 14 days’ follow-up, the incidence of illness compatible with COVID-19 (based on symptoms, confirmed by PCR testing only rarely) did not differ significantly between the hydroxychloroquine and placebo groups (12% and 14%, respectively). There was one hospitalization in each group. There were no deaths or arrhythmias.
An editorialist notes that “it is hard to be certain how many participants in the trial actually had COVID-19.” He adds, “The long delay between perceived exposure to SARS-CoV-2 and the initiation of hydroxychloroquine (≥3 days in most participants) suggests that what was being assessed was prevention of symptoms or progression of COVID-19, rather than prevention of SARS-CoV-2 infection.”
The advocacy and widespread use of hydroxychloroquine seem to reflect a reasonable fear of SARS-CoV-2 infection. However, it would appear that to some extent the media and poitical forces — rather than medical evidence — are driving clinical decisions and the global Covid-19 research agenda.
_
Study-13
UK Covid-19 trial ends hydroxychloroquine study because there’s no evidence the drug benefits patients, June 2020:
Researchers in the United Kingdom have put an abrupt stop to an arm of their Covid-19 trial that involves the antimalarial drug hydroxychloroquine. The Recovery trial, a large UK-based trial investigating potential coronavirus treatments, has stopped including hydroxychloroquine in its study due to there being “no evidence of benefit,” researchers announced recently. Other arms in the trial, which has enrolled more than 11,000 patients from 175 hospitals across the UK, will continue.
“We reviewed the data and concluded that there is no evidence of a beneficial effect of hydroxychloroquine in patients hospitalized with Covid and decided to stop enrolling patients to the hydroxychloroquine arm, with immediate effect, and that has been actioned this morning,” Martin Landray, deputy chief investigator of the trial and a professor at the University of Oxford, said.
As part of the trial, 1,542 Covid patients were randomly selected to receive hydroxychloroquine as a treatment compared with 3,132 patients who received the usual standard care. The data showed that after about 28 days, 25.7% of the patients who received hydroxychloroquine had died compared with 23.5% of patients who received usual care alone. “That is not statistically significant, but as you can see from the numbers, that result shows that there’s really no evidence of a benefit,” Landray said. ” I think we can say that this data convincingly rule out any meaningful mortality benefit,” Landray said. “Our conclusion is that this treatment does not reduce the risk of dying from Covid among hospital patients. That clearly has a significant importance for the way that patients are treated not only in the UK, but all around the world.”
________
________
Section-13
Does Lockdown (extreme social distancing of entire population) help or harm?
_
A lockdown is a requirement for people to stay where they are, usually due to specific risks to themselves or to others if they can move freely. The term “stay-at-home” is often used for lockdowns that affect an area, rather than specific locations. In the context of covid-19, lockdown is extreme social distancing of entire population, a containment strategy to control covid-19 outbreak which involves closing companies, shops, restaurants, theatres, mass transit, schools etc.; disallowing gathering of people at any event including religious prayers; and encouraging work & study from home. Whether lockdown helps or harms need to be debated and whether collateral damage is worse than the damage caused by the virus itself also need to be debated.
The implementation of extreme measures of social distancing, including mobility restrictions, banning of mass gatherings, closure of schools and work activities, isolation and quarantine, helped control the first wave of COVID-19 pandemic in China.
The world has experienced many pandemics (SARS, MERS, the 2018 flu epidemic) that died out without requiring economic shutdowns. The flu of 2017-18 caused 80,000 deaths in the US but no shutdown was ordered. In the case of Covid-19, the Imperial College, London, projected an explosive virus spread that would kill millions unless tackled on a war footing. This caused panic and shutdowns the world over. Governments didn’t want to be accused of killing people. An exception was socialist Sweden, which encouraged social distancing but avoided any shutdown. Compared with European countries with shutdowns, Sweden’s infection and death rates are more. Sweden has counted 4,542 deaths and 40,803 infections in a population of 10 million, while Denmark, Norway and Finland have imposed lockdowns and seen far lower rates. Denmark has seen 580 deaths, Norway has had 237 deaths and Finland 321 as of June 4, 2020. The high death toll in Sweden was mainly because homes for the elderly had been unable to keep the disease out. Sweden alone has saved its economy while avoiding a huge medical disaster, and medically outperformed many shutdown countries. Countries have decreed shutdowns ranging from mild to very stringent. These are causing the greatest economic collapse since the Great Depression.
_
SARS-CoV-2 is not remotely as lethal as the Spanish Flu of 1918-19 that killed the fit and young as virulently as the elderly and infirm. It infected 500 million people and killed 50 million, equivalent to 220-250 million dead today. Yet authorities did not close down whole societies and economies in 1918. In other deadly pandemic episodes also we suffered but endured. To overcome these hesitations of history and experience, the threat from SARS-CoV-2 had to be inflated to beyond all previous calamities in order to panic countries into drastic action. Instead of evidence-based policy, many governments have resorted to policy-based evidence to justify the lockdown. Those who ask for evidence to justify the biggest lockdown in history are shamed as wanting to kill grandparents. Today, almost all lockdown governments are struggling with public justifications to declare victory and lift the lockdown. Modelers still want none of it and the apocalyptic warnings are back, despite no massive rise in cases and deaths in countries and US states that have ended lockdowns.
______
Now I will narrate studies which show that lockdown is helpful:
_
Study-1
The goal: R0 <1
The purpose of a lockdown, explains a new study from the Imperial College London COVID-19 Response Team, is to reduce reproduction – in other words, to reduce the number of people each confirmed case infects. The goal is to keep reproduction below one (R0 <1) – with each case infecting fewer than one other person, on average.
The authors of the study say there are two routes to try to get there:
- Mitigation, “slowing but not necessarily stopping epidemic spread – reducing peak healthcare demand while protecting those most at risk of severe disease from infection.” This is done by isolating suspected cases and their households, and social distancing the elderly and people at highest risk of serious illness.
- Suppression (containment), or basically, lockdown, which “aims to reverse epidemic growth, reducing case numbers to low levels” by social distancing the entire population “indefinitely” and closing schools and universities.
The study’s models show that, painful as lockdown may be for many of us, it works. Without any lockdown or social distancing measures, we can expect peak mortality in approximately three months. In this scenario, 81% of the UK and US populations would be infected, with 510,000 dying in the UK and 2.2 million dying in the US. In contrast, isolating confirmed and suspected cases and social distancing the elderly and vulnerable would “reduce peak critical care demand by two-thirds and halve the number of deaths.” To get closer to the goal of R0 <1, they say, “a combination of case isolation, social distancing of the entire population and either household quarantine or school and university closure are required.” The study finds this “intensive policy is predicted to result in a reduction in critical care requirements from a peak approximately three weeks after the interventions are introduced and a decline thereafter while the intervention policies remain in place.” While the word “indefinitely” isn’t one we want to hear, it’s possible long-term suppression could be the best way to reduce infections and deaths – at least until a vaccine is available.
_
Study-2
Expected impact of lockdown in Île-de-France and possible exit strategies, April 2020:
More than half of the global population is currently under strict forms of social distancing, with more than 90 countries in lockdown, including France. Estimating the expected impact of the lockdown, and the potential effectiveness of different exit strategies is critical to inform decision makers on the management of the COVID-19 health crisis. Authors use a stochastic age-structured transmission model integrating data on age profile and social contacts in the Île-de-France region to (i) assess the current epidemic situation, (ii) evaluate the expected impact of the lockdown implemented in France on March 17, 2020, and (iii) estimate the effectiveness of possible exit strategies. The model is calibrated on hospital admission data of the region before lockdown and validated on syndromic and virological surveillance data. Different types and durations of social distancing interventions are simulated, including a progressive lifting of the lockdown targeted on specific classes of individuals (e.g. allowing a larger proportion of the population to go to work, while protecting the elderly), and large-scale testing. Authors estimate the basic reproductive number at 3.0 (95% confidence interval) prior to lockdown and the population infected by COVID-19 as of April 5 to be in the range 1% to 6%. The average number of contacts is predicted to be reduced by 80% during lockdown, leading to a substantial reduction of the reproductive number 0.68 [0.62-0.73]. Under these conditions, the epidemic curve reaches ICU system capacity and slowly decreases during lockdown. Lifting the lockdown with no exit strategy would lead to a second wave largely overwhelming the healthcare system. Extensive case-finding, testing and isolation are required to envision social distancing strategies that gradually relax current constraints (larger fraction of individuals going back to work, progressive reopening of activities), while keeping schools closed and seniors isolated. As France faces the first wave of COVID-19 pandemic in lockdown, intensive forms of social distancing are required in the upcoming months due to the currently low population immunity. Extensive case-finding and isolation would allow the partial release of the socio-economic pressure caused by extreme measures, while avoiding healthcare demand exceeding capacity. Response planning needs to urgently prioritize the logistics and capacity for these interventions.
_
Study-3
‘Suppress and lift’: Hong Kong and Singapore say they have a coronavirus strategy that works, April 2020: Despite setbacks, Hong Kong’s and Singapore’s targeted strategies for fighting COVID-19 may yet succeed—and provide a model for other countries emerging from their first wave of cases. Until recently, the two cities had managed to keep their case numbers remarkably low while avoiding the extreme lockdowns implemented in China and many other countries. Both fought outbreaks through aggressive testing, isolating infected people, and tracing and quarantining their contacts. For everyone else, it was almost business as usual, with a bit of social distancing.
But case numbers spiked in the second half of March, and some observers feared the strategy had failed. Hong Kong had just 149 confirmed cases on 15 March; the tally reached 1005 by end of March. Singapore’s number grew from 226 on 15 March to 2532 by end of March. Neither city is seeing the explosive growth Italy, Spain, and many areas of the United States have witnessed. Their health care systems have not been overwhelmed. But both ramped up their responses. Hong Kong recently imposed restrictions on restaurants and closed bars entirely. Singapore has closed schools and nonessential businesses and instructed residents to stay home—a dramatic escalation.
In Hong Kong, the rate of new cases has already slowed. University of Hong Kong public health specialist Gabriel Leung, who advises the city’s government, says if the trend continues, “we might be able to breathe a little bit easier” and relax the new regulations. He thinks what Hong Kong and Singapore are practicing may become the new normal in many countries: a “suppression and lift” strategy in which governments aim to alternately drive down new infections to a low level, then loosen the reins while watching for any resurgence.
When the pandemic first emerged, both Hong Kong and Singapore had certain advantages. After suffering major outbreaks of severe acute respiratory syndrome in 2003, they had built up response capabilities and laid preparedness plans. They are small and have few land borders, making it easier to control incoming travel. Each has a single government, avoiding the tensions between national and local authorities that plague the responses elsewhere. And, Leung says, “Both the Hong Kong and Singapore governments do care deeply [about scientific evidence] and listen to scientists.”
The two cities based their policies on detailed data about the state of their epidemics, gathered by extensive testing of contacts of confirmed cases and of people who enter hospitals with unexplained respiratory illnesses. Physicians can order tests for other patients based on their own clinical or epidemiological judgments. As a result, Singapore has done roughly 12,800 tests per million population; Hong Kong, 13,800, according to respective health authority statistics—some of the highest testing rates in the world.
Both cities hospitalize those who test positive, regardless of whether they have symptoms, to prevent them from infecting others. Close contacts of cases and all recent returnees must self-quarantine at home for 2 weeks. (Both cities have banned almost all noncitizens from entering.) In Hong Kong, quarantined people are fitted with electronic wristbands that work with smartphones to track their whereabouts. In Singapore, they must respond to mobile phone text messages that reveal their location several times a day. Violators face fines and jail terms. Those very tight controls allowed both cities to impose relatively minor restrictions on the uninfected. Singapore defied conventional wisdom by keeping schools open; movie theaters and bars could stay open if they kept patrons separated by 1 meter. In Hong Kong, bars and restaurants remained open. (The city did close its schools, however, and civil servants were ordered to work from home, a move followed by many businesses.)
The rise in numbers in late March was a warning sign. “We try to project what might happen over the next couple weeks if we do not do anything,” Vernon Lee, an infectious disease epidemiologist at Singapore’s Ministry of Health, said during a 3 April Brookings Institution webinar. So, both cities ramped up countermeasures. Since 28 March, restaurants in Hong Kong have been limited to 50% of normal capacity, with no more than four to a table, and they must check patrons’ temperatures at the door and provide hand sanitizer. Karaoke rooms and mahjong parlors were closed on 1 April, and bars on 3 April. (Each measure was to be in force for 14 days, but all have been extended until 23 April.) Singapore closed its schools on 8 April and barred eat-in dining. It has ordered all nonessential businesses to close or have employees work from home, and asked all residents to remain at home as much as possible. The city’s restrictions now resemble those adopted by New York and the United Kingdom. Singapore, too, expects to go back and forth between different levels of restrictions, Lee said during the webinar, which might be the most sustainable strategy in the long run. Minimally intrusive policies, such as encouraging personal hygiene and telecommuting, are relatively easy to keep up, he noted, but it’s harder to limit the size of gatherings, cancel entertainment, and close schools and businesses for very long. Experts in both cities believe setbacks are inevitable. As Lee put it, “This is not a sprint over the next month, it’s a marathon that we do not know how long will last.”
_
Study-4
Lockdown may help flatten COVID-19 curve in India, says study, April 02 2020:
The first 21-day lockdown may help reduce the projected number of symptomatic novel coronavirus cases in India by nearly 83 per cent till day 20 from the beginning of the intervention, thereby flattening the COVID-19 curve, scientists say. The modelling study by researchers from Shiv Nadar University in Uttar Pradesh considered the optimistic scenario, where cases are isolated immediately within one or two days since showing symptoms. “We also assumed 80 per cent to 90 per cent of the population resorted to social distancing,” Samit Bhattacharya, Associate Professor at Shiv Nadar University said. “In this optimistic scenario, we projected number of symptomatic cases can decline by almost 83 per cent by day 20 from the beginning of the lockdown — 3,500 against 30,790 — and deaths — 105 against 619 — as well,” Bhattacharya said.
The researchers estimated the number of symptomatic cases during the 21-day lockdown by considering a scenario where the basic reproduction ratio (R0) is 2.2, with super-spreading events triggered by COVID-19 carriers following the 20/80 rule, and an assumption of 30 per cent symptomatic cases. They said the super spreading 20/80 rule means out of total infected persons, 20 per cent of them contribute in spreading 80 per cent of infections in healthy population. India, with a population density of 412 people per square kilometer, and an average range of 4.5 to 5 people in each family which typically has one person above 60 years of age is undoubtedly predisposed to the easy spread of highly transmissible COVID-19, the researchers said. A flattened COVID-19 curve for the next two or three months is difficult to comprehend, the scientists said. All measures that provide few opportunities for the virus to spread must be continued, which not only limit any individual’s infection hazard, but also protect the entire community, they added. These measures may include, avoiding large gatherings, 14-day quarantine for suspected cases of infection, systematic surveillance, and expanded testing for the identification of COVID-19 infections, continued work at home for employees, the researchers said. Practices such as respiratory hygiene, hand washing, and other protective activities at an individual level may help maintain a flattened COVID-19 curve, they added.
_
Study-5
Physical distancing, face masks, and eye protection to prevent person-to-person transmission of SARS-CoV-2 and COVID-19: a systematic review and meta-analysis: June 2020:
Physical distancing of at least 1 meter (3.3 feet) is associated with lower risk for spread of coronaviruses, according to a meta-analysis in the Lancet.
Researchers examined 44 studies on the effects of nonpharmaceutical interventions on the risk for transmitting SARS-CoV, SARS-CoV-2, and MERS-CoV in healthcare and non-healthcare settings. Risk for transmitting the viruses was lower when exposure was at 1 meter or more, compared with less than 1 meter (adjusted odds ratio, 0.18). Risk was lower with increasing distance. N95 masks provided greater protection than surgical face masks, but both were protective. Specifically for SARS-CoV-2, mask use was associated with a 60% reduced risk for infection, compared with no mask use. Eye protection was also associated with lower infection risk.
The researchers say the analysis provides “the best available evidence that current policies of at least 1 m physical distancing are associated with a large reduction in infection, and distances of 2 m might be more effective.”
_
Study-6
Anti-contagion policies & interventions: June, 2020:
The effect of large-scale anti-contagion policies on the COVID-19 pandemic:
Estimating the effects of non-pharmaceutical interventions on COVID-19 in Europe:
Two studies in Nature estimate the benefits of various nonpharmaceutical interventions to help control COVID-19. In the first, researchers examine the effects of over 1700 policies — such as travel restrictions, school closures, and quarantine of positive cases — across China, France, Iran, Italy, South Korea, and the United States. In the absence of policy actions, researchers estimate that early infections of COVID-19 exhibit exponential growth rates of roughly 38% per day. Researchers find that anti-contagion policies have significantly and substantially slowed this growth. Using statistical modeling, they estimate that the policies prevented 62 million confirmed infections — or roughly 530 million total infections — across the six countries. In the second study, researchers estimate that 3.2–4.0% of the populations of 11 European countries have been infected with SARS-CoV-2. Researchers estimate that, for all the countries they consider, current interventions have been sufficient to drive the reproduction number R0 below 1 (probability R0 < 1.0 is 99.9%) and achieve epidemic control. They conclude that nonpharmaceutical interventions — especially lockdowns — markedly kept the numbers down and suggest that “continued intervention should be considered to keep transmission of SARS-CoV-2 under control.”
______
______
Now I will narrate studies which shows that lockdown (extreme social distancing) is unhelpful or harmful:
_
Study-1
Controlling epidemic spread by social distancing: Do it well or not at all: August 2012:
Network models have been successfully used to describe the spread of many infectious diseases, ranging from human through animal to plant diseases. In these models, individuals are represented as nodes and potential contacts between individuals as edges of the underlying network. Much work has been devoted to studying how networks are assembled and to analysing the effect of network topology on disease spread and potential control strategies. However, the structure of interactions between individuals is most commonly assumed to be fixed and so represents an ‘average’ behavioural pattern. Thus, conventional epidemiological models either treat human behaviour as external to the disease system or even ignore it completely.
The structure of real-life networks is, however, far from static and often responds to epidemic spread at both individual and at population level. Thus, for example, governments often introduce control measures aimed at disrupting disease transmission either locally or on long-range links. Targeted social distancing may be promoted by governments and public health bodies as a strategy for the control of epidemics, for example in the form of school or workplace closures. The effectiveness of such measures is typically assessed by macroeconomic cost-benefit analysis, often based upon large-scale Computational General Equilibrium models.
Social distancing also arises spontaneously as individuals respond to news about disease spread, obtained from media reports, public announcements, rumours or individual experience. Recognising the importance of behavioural responses, epidemiological modellers have begun to consider transmission via adaptive networks, whereby the structure of the network is modified depending on the state of individuals. Thus, changes in contact network structure can arise as a result of human responses to disease, such as a reduction in social contacts. Such models have shown that social distancing can be effective at reducing the attack rate of an epidemic and that it is a plausible explanation for certain phenomena arising in real epidemics, such as multiple outbreaks or waves of infection.
Existing studies have, however, tended to neglect the associated cost to both society and individuals resulting from the actions of individuals leading to severing social links. Social contacts are necessary for economic activity: employees must go to work, students must go to school, and traders and customers must interact in order for an economy to function. Social contacts are also important to individuals for non-monetary reasons, such as interactions with family and friends. Awareness of an epidemic therefore presents each individual with a private choice between investing in social contacts and risking infection, or reducing the contacts and losing the social or economic benefits. This can have a severe impact on both individual and societal well-being as it has been noted that for example ‘(..) fear of exposure can result in significant worker absenteeism’.
Background:
Existing epidemiological models have largely tended to neglect the impact of individual behaviour on the dynamics of diseases. However, awareness of the presence of illness can cause people to change their behaviour by, for example, staying at home and avoiding social contacts. Such changes can be used to control epidemics but they exact an economic cost. The aim is to study the costs and benefits of using individual-based social distancing undertaken by healthy individuals as a form of control.
Methods:
Authors’ model is a standard SIR model superimposed on a spatial network, without and with addition of small-world interactions. Disease spread is controlled by allowing susceptible individuals to temporarily reduce their social contacts in response to the presence of infection within their local neighbourhood. Authors ascribe an economic cost to the loss of social contacts, and weigh this against the economic benefit gained by reducing the impact of the epidemic. They study the sensitivity of the results to two key parameters, the individuals’ attitude to risk and the size of the awareness neighbourhood.
Results:
Depending on the characteristics of the epidemic and on the relative economic importance of making contacts versus avoiding infection, the optimal control is one of two extremes: either to adopt a highly cautious control, thereby suppressing the epidemic quickly by drastically reducing contacts as soon as disease is detected; or else to forego control and allow the epidemic to run its course. The worst outcome arises when control is attempted, but not cautiously enough to cause the epidemic to be suppressed. The next main result comes from comparing the size of the neighbourhood of which individuals are aware to that of the neighbourhood within which transmission can occur. The control works best when these sizes match and is particularly ineffective when the awareness neighbourhood is smaller than the infection neighbourhood. The results are robust with respect to inclusion of long-range, small-world links which destroy the spatial structure, regardless of whether individuals can or cannot control them. However, addition of many non-local links eventually makes control ineffective.
Conclusions:
These results have implications for the design of control strategies using social distancing: a control that is too weak or based upon inaccurate knowledge, may give a worse outcome than doing nothing.
__
Study-2
Social distancing effects:
Each of three social distancing measures enacted in Germany led to a decline in COVID-19 cases that became detectable 2 weeks after its implementation, according to a short-term modeling study in Science. Of the three measures — in sequence: canceling large events, school closures, and, lastly, contact banning and closure of nonessential stores — only the third stopped exponential growth of the epidemic. The authors write, “Lifting restrictions too much will quickly lead to renewed exponential growth and … we would be effectively blind to this worsened situation for nearly two weeks in which … transmission will be uninhibited.”
Important point: canceling large events and school closure could not stop exponential growth of the epidemic.
_
Study-3
Taking the right measures to control COVID-19: March, 2020 Lancet:
In the face of the rapidly spreading disease and a large number of infected people, there is an urgent need for effective infection prevention and control measures. However, some of the measures that have been introduced have no scientific basis and have proven to be ineffective.
First, although COVID-19 is spread by the airborne route, air disinfection of cities and communities is not known to be effective for disease control and needs to be stopped. The widespread practice of spraying disinfectant and alcohol in the sky, on roads, vehicles, and personnel has no value; moreover, large quantities of alcohol and disinfectant are potentially harmful to humans and should be avoided.
Second, in the use of personal protective equipment, we should try to distinguish different risk factors, adopt different epidemic prevention measures, and reduce the waste of personal protective equipment, as these resources are already in short supply. Although surgical masks are in widespread use by the general population, there is no evidence that these masks prevent the acquisition of COVID-19, although they might slightly reduce the spread from an infected patient. High-filtration masks such as N95 masks and protective clothing (goggles and gowns) should be used in hospitals where health-care workers are in direct contact with infected patients.
Third, the practice of blocking traffic and lockdown of villages is of no value for the prevention and control of COVID-19. Since the outbreak of COVID-19, some countries have suspended flights to and from China, and prevented Chinese people from travelling to their countries; both of these actions violate WHO International Health Regulations. Similarly, in community prevention and control of the disease, the measures taken by individual villages and communities to seal off roads are of no value. Such measures could result in civil unrest and reduce compliance with infection prevention and control advice.
Fourth, public health education must be based on scientific evidence to reduce the anxiety and distress caused by misinformation. In particular, epidemiological findings need to be reported in a timely and objective manner so that they can be accurately assessed and interpreted. The risk of transmission with brief contact (less than 15 min face-to-face contact) or infection onset after 14 days of exposure to a known infected person (the estimated maximum incubation period) is low and should not be over-exaggerated. Misinformation spreads panic among the general population and is not conducive to implementation of epidemic control measures.
Fifth, WHO has made it clear that there are currently no known effective treatments for COVID-19 and does not recommend the use of antiviral drugs, antibiotics, glucocorticoids, or traditional Chinese medicine. Despite this, there have been reports of the use of oseltamivir, lopinavir/ritonavir, prednisone, antibiotics, and traditional Chinese medicine for the treatment of patients with COVID-19. Care should be taken to not give patients drugs of unknown efficacy, which might be detrimental to critically ill patients with COVID-19; clinical trials are urgently required in this context.10 Likewise, the development of a vaccine is an urgent public health priority.
_
Study-4
Physical interventions to interrupt or reduce the spread of respiratory viruses:
Cochrane Systematic Review, July 2011:
Authors included 67 studies including randomized controlled trials and observational studies with a mixed risk of bias. A total number of participants is not included as the total would be made up of a varied set of observations: participant people and observations on participants and countries (the object of some studies). Any total figure would therefore be misleading. Respiratory virus spread can be reduced by hygienic measures (such as handwashing), especially around younger children. Frequent handwashing can also reduce transmission from children to other household members. Implementing barriers to transmission, such as isolation, and hygienic measures (wearing masks, gloves and gowns) can be effective in containing respiratory virus epidemics or in hospital wards. Authors found no evidence that the more expensive, irritating and uncomfortable N95 respirators were superior to simple surgical masks. It is unclear if adding virucidals or antiseptics to normal handwashing with soap is more effective. There is insufficient evidence to support screening at entry ports and social distancing (spatial separation of at least one meter between those infected and those non‐infected) as a method to reduce spread during epidemics.
Authors’ conclusions:
Implications for practice:
The following effective interventions should be implemented, preferably in a combined fashion, to reduce transmission of viral respiratory disease:
- frequent handwashing with or without adjunct antiseptics;
- barrier measures such as gloves, gowns and masks with filtration apparatus; and
- suspicion diagnosis with isolation of likely cases.
_
Study-5
Scientists say one-time lockdown will not bring pandemic under control, April 2020:
Physical distancing measures may need to be in place intermittently until 2022, scientists have warned in an analysis that suggests there could be resurgences of Covid-19 for years to come. The paper, published in the journal Science, concludes that a one-time lockdown will not be sufficient to bring the pandemic under control and that secondary peaks could be larger than the current one without continued restrictions. One scenario predicted a resurgence could occur as far in the future as 2025 in the absence of a vaccine or effective treatment.
Marc Lipsitch, a professor of epidemiology at Harvard and co-author of the study, said: Infections spread when there are two things: infected people and susceptible people. Unless there is some enormously larger amount of herd immunity than we’re aware of … the majority of the population is still susceptible. Predicting the end of the pandemic in the summer [of 2020] is not consistent with what we know about the spread of infections.
New treatments, a vaccine, or increasing critical care capacity could alleviate the need for stringent physical distancing, according to the paper in Science. “But in the absence of these, surveillance and intermittent distancing may need to be maintained into 2022,” the authors conclude.
The overall numbers of cases in the next five years, and the level of distancing required, were found to depend crucially on the overall current levels of infection and whether all those who are infected gain immunity and, if so, for how long. The authors cautioned that these are big unknowns and that a precise prediction of the long-term dynamics is not possible.
If immunity is permanent, Covid-19 could disappear for five or more years after the first outbreak, the paper suggests. If people have immunity for about a year, as is seen for some other circulating coronaviruses, an annual outbreak cycle would be the most likely outcome. Asked to speculate on which of these scenarios was more likely, Lipsitch said: “Reasonable guesses are that there might be partial protection for close to a year. On the long end, it might be several years of good protection. It’s really speculative at this point.”
Under all scenarios considered, however, the models found that a one-time lockdown would result in a resurgence after restrictions are lifted. Serological surveys, assessing the proportion of the population carrying protective antibodies, will be crucial to establish whether people have long-lasting immunity.
Mark Woolhouse, a professor of infectious disease epidemiology at Edinburgh University, said: “This is an excellent study that uses mathematical models to explore the dynamics of Covid-19 over a period of several years, in contrast to previously published studies that have focused on the coming weeks or months. It is important to recognise that it is a model; it is consistent with current data but is nonetheless based on a series of assumptions – for example about acquired immunity – that are yet to be confirmed. The study should therefore be regarded as suggesting possible scenarios rather than making firm predictions.”
_
Study-6
6ft distancing might not be enough to stop droplet transmission of COVID-19:
Respiratory droplets from COVID-19 patients can reach far beyond the current social distancing guidelines of 6 feet, warns a new study. Saliva droplets can travel large distances, depending on environmental conditions such as wind speed, temperature, pressure and humidity, according to the study published in Physics of Fluids on May 19 2020. Researchers, Talib Dbouk and Dimitris Drikakis from University of Nicosia in Cyprus, have found that with even a slight breeze of 4 kph, saliva travels 18 feet in 5 seconds.
_
Study-7
Influence of wind and relative humidity on the social distancing effectiveness to prevent COVID-19 airborne transmission: May 2020 study:
It has been confirmed that the coronavirus disease 2019 (COVID-19) can transmit through droplets created when an infected human coughs or sneezes. Accordingly, 1.83-m (6-feet) social distancing is advised to reduce the spread of the disease among humans. This is based on the assumption that no air circulation exists around people. However, it is not well investigated whether the ambient wind and relative humidity (RH) will cause SARS-CoV-2 laden droplets to transport farther in the air, and make the current social distancing policy insufficient. To provide evidence and insight into the “social distancing” guidelines, a validated computational fluid-particle dynamics (CFPD) model was employed to simulate the transient transport, condensation /evaporation, and deposition of SARS-CoV-2 laden droplets emitted by coughs, with different environmental wind velocities and RHs. Initial droplet diameters range from 2 to 2000 μm, and the wind velocities range from 0 to 16 km/h, representing different wind forces from calm air to moderate breeze. The comparison between a steady-state wind and a gust with a constant frequency has also been performed. Ambient RHs are 40% and 99.5%. The distances between the two virtual humans are 1.83 m and 3.05 m (6 feet and 10 feet). The facial covering effect on reducing the airborne transmission of the cough droplets has also been evaluated. Numerical results indicate that the ambient wind will enhance the complexity of the secondary flows with recirculation between the two virtual humans. Microdroplets follow the airflow streamlines well and deposit on both human bodies and head regions, even with the 3.05-m (10-feet) separation distance. The rest of the microdroplets can transport in the air farther than 3.05 m (10 feet) due to wind convection, causing a potential health risk to nearby people. High RH will increase the droplet sizes due to the hygroscopic growth effect, which increases the deposition fractions on both humans and the ground. With the complex environmental wind and RH conditions, the 6-feet social distancing policy may not be sufficient to protect the inter-person aerosol transmission, since the suspending micro-droplets were influenced by convection effects and can transport from the human coughs/sneezes to the other human in less than 5 seconds. Due to the complex real-world environmental ventilation conditions, a social distance longer than 1.83 m (6 feet) needs to be considered. Wearing masks should also be recommended for both infected and healthy humans to reduce the airborne cough droplet numbers.
______
______
Now I will discuss pros/cons of the largest lockdown in the history: Total Indian Lockdown:
India has chosen to lock down entire country from march 25 to protect Indians from the dangerous Covid-19 virus. Even China has not chosen total lockdown of entire country. India has launched what by any standard is the most draconian and complete nation-wide lockdown of any country affected by Covid-19. This is unusual for several reasons. First, reported infections in India as of March 27, 2020 are 747 out of a total population of 1.3 billion. Of these, 20 have died, and 66 have recovered. What is more, of all the active cases, each and every one of them has shown only mild symptoms. By any metric, India has a far less serious COVID-19 crisis than many advanced and emerging countries. It has been suggested that the low reported infection rate might reflect a very low testing rate in India. It is theoretically possible therefore that the infection rate in India is much higher; but if this is true, then it raises another puzzle, why isn’t an already ill prepared public health system overwhelmed with people showing up with COVID-19 like symptoms? Why aren’t thousands of people on ventilators? Given India’s large elderly population and many a kind of respiratory problems due to pollution and other reasons, why aren’t thousands of people on ventilators and in overcrowded hospitals? Several hundred Covid-19 patients were on ventilator by end of May 2020 in India. The other noteworthy feature of the Indian situation is a very low fatality rate when computed as a percentage of all reported cases, as low as 2.6 percent. Contrast this with fatality rates as staggeringly high as 10 percent in Italy and in the US of 1.5 percent, just a little lower than India.
On the face of it, the Indian data suggest no reason for panic, especially given India’s early and aggressive action in closing international borders to travellers from affected regions — much before such action was undertaken in places like the US and Europe. The panic in India and elsewhere emanates from statistical and epidemiological models which predict massive fatality rates if draconian action is not taken to curb the spread of COVID-19. It turns out that these models are very likely wrong and have overstated the probable number of deaths from the virus. Good public policy is always based on the best science and most recent and reliable evidence. Unfortunately, it is not at all clear that science or evidence were the basis of India’s lockdown.
_
Locking up healthy people in their homes and putting wholesale populations under house arrest is perverse. Coronavirus panic merchants and fearmongers have wrecked entire economies based on flimsy evidence and with little public scrutiny. Lockdowns have no ‘historical scientific basis’. Has any one paper caused so much global pain as the non-peer reviewed paper from Imperial College London, on which lockdown policies are based? Its alarmist predictions of 5,10,000 UK and 2.2 million US deaths without stringent shelter-in-place orders relied on mathematical modelling short of hard data. John Ioannidis, a statistics professor in Stanford’s School of Medicine, dismisses the modelling as ‘speculation and science fiction’. Chemistry Nobel laureate Michael Levitt says ‘being a factor of 1,000 too high is perfectly OK in epidemiology’ because ‘they see their role as scaring people’. Many experts contest the accuracy or even validity of the Imperial College model. A shutdown “flattens the curve” of infections. But that does not guarantee fewer deaths — they may merely be spread over 18 months rather than four. Data is too limited and suspect to prove or disprove the Imperial College model. Maybe the disease is far less lethal and fast-spreading than the model predicts. In 1999, EU scientists suggested 5,00,000 people could die from the UK mad cow disease. In 2002 ICL’s professor Neil Ferguson – epidemiology’s policy panjandrum-in-chief – estimated up to 50,000 human deaths from the disease. By 2013, 177 deaths were recorded from it. In 2005 Ferguson said up to 200 million deaths from avian flu; 455 people had died by 2019.
The coronavirus is remarkably infectious, but not very lethal. Indeed 30% of all new cases are asymptomatic. On May 5, the global mortality from Covid-19 was at 2,55,486; India’s confirmed death toll was 1,568. The global death toll from influenza and pneumonia, pro-rated for India’s six-week lockdown (March 25–May 5), would be around 3,67,000. India’s pro-rated death toll from all causes would be 1 million, including influenza and pneumonia 75,000, TB 54,000, diarrhoea 50,000, road accidents 32,000, suicides 24,000. So statistically, the entire country has been preoccupied with only 1 coronavirus death out of 638 total deaths. No matter which way we look at it, this equation just doesn’t compute.
_
India’s social, family, housing and water-cum-sanitation realities are a nightmare for any highly infectious and very lethal pandemic. A tight lockdown is impossible in Indian conditions. India’s low numbers of cases and deaths suggest Covid-19 was never a serious public health threat. Due to extensive range of infectious diseases afflicting Indians since childhood, their immune system is better prepared to fight Covid-19 than those of Americans and Europeans. India’s age pyramid is the opposite of the West’s, with many young who are the least vulnerable to coronavirus. Hot environment having temperature 40 degree Celsius in April/May/June is unsuitable for survival of SARS-CoV-2 on environmental surfaces. Evidence suggests that people come in with non-Covid-19 symptoms and pick up the virus in the hospital itself. Yet India is uniquely vulnerable to lockdown shocks because of the overwhelming dominance of the informal sector and migrant daily wage labourers. Instead of self-harm from the harsh lockdown, India could have invested to urgently upgrade the failing public health system, ensuring permanent gains in lives saved.
_
There are three things all nations need to do to get out of coronavirus lock-down:
Vaccine and/or treatments, reliable infection data and mass testing.
And India does not have any of them.
The U.S. will need to administer 20 million tests for the novel coronavirus each day by mid-summer in order to fully remobilize the economy in a safe fashion, according to new report from a Harvard panel of more than 45 experts in health, science and economics. The new report, released by Harvard University’s Edmond J. Safra Center for Ethics recently emphasized the need for a massive scaling up of testing coupled with a robust contact-tracing program in order to reopen the U.S. in a way that avoids future shutdowns. Its top recommendations include a call for the nation to deliver 5 million tests per day by early June in order to ensure a safe reopening of portions of the economy. The figure far exceeds testing recommendations from other health experts. Former Food and Drug Administration (FDA) Commissioner Scott Gottlieb has said that the country will need to initially conduct up to 3 million tests per week to reopen. A separate estimate from Harvard University researchers says the U.S. must conduct between 500,000 and 700,00 tests per day by mid-May to begin reopening. Testing at a rate of 20 million each day would cost about $15 billion per month, according to the report. Though the authors argue that the cost would fall over time and that it pales in comparison to the overall economic cost of continued stay-at-home orders. Their call for 20 million daily tests is in line with recommendations from Nobel Prize-winning economist Paul Romer, who said that the U.S. needs to administer 20 million to 30 million tests per day. Can India even dream of 20 million tests per day to end total lockdown?
At May end, India has tested around 1,540 people per million of its population but still far lower than the tests per million in other countries. In the US, Spain, Russia, the UK, and Italy, the corresponding numbers are 31,080; 52,781; 42,403; 32,691; and 45,246 respectively.
One big reason for the self-created exit trap is that the original mission of flattening the curve so the health system could cope with a slowed spread of the virus, has morphed into the more ambitious but impossible mission of eliminating the virus.
______
Benefits of Indian lockdown:
Case growth in India has been modest so far. It is fair to say that the lockdown is working to a large extent and they have saved some lives. The Indian government said that the lockdown has helped avert 54,000 deaths and 2 million cases of Covid-19. And since lives have no price on them, all this is worth it. The logic is sound. If lives are priceless, they’re worth saving at any cost — that’s the current mantra.
Except, Indians have never really applied this principle when it comes to saving lives from causes other than Covid-19. For instance, in 2019, according to a UN report, over 800,000 Indian infants died. The key causes were preventable — poor nutrition, sanitation and healthcare. If they spent ‘whatever it takes’ on these measures, they surely could save all of these lives. About 440,000 people die due to tuberculosis every year in India despite free treatment available to them, and tuberculosis is airborne. Nobody talks about lockdown to save lives from tuberculosis. About 150,000 lives are lost every year due to road traffic accidents in India. How about stopping all traffic all over India for 1 year? Won’t it save 150,000 lives?
Global experience suggests that alcohol-related deaths are 5% of the total, far more than Covid is likely to cause. Yet India has relaxed liquor sales to get extra revenue, and the Supreme Court has even advocated home delivery of liquor! Beedis are mass killers yet taxed lightly to protect jobs. If we can live with deadly diseases like TB and malaria, with deaths from alcohol, tobacco, transport and workplace accidents, it may be no riskier to live with Covid, staving off economic disaster.
The media frenzy around corona, Indians’ own panic regarding this disease, a desire to be seen as a responsible country in the eyes of the international community are making India look at corona differently than almost anything else they have in the past.
But there is a silver lining to lockdown. The lockdown has substantially reduced deaths from traffic and workplace accidents. Murders have fallen as criminals stay locked down.
_______
Harms of Indian lockdown:
- Indian lockdown to limit COVID-19 transmission has unintended consequences for the poorest and most vulnerable. A major economic downturn has costs too. Unemployment and bankruptcies will lead to a rise in all of the following — depression, suicide rates, domestic violence, crime, terrorism. All these directly cost lives, if not just great economic hardship and pain. As India remain in lockdown, many cases of cardiac diseases, cancers, diabetes are going undetected and those who already have such diseases are running pillar to post to get treatment. All these will cost lives.
Doctors say patients coming for other ailments including heart disease, strokes and cancer have fallen dramatically. People with symptoms avoid hospitals, fearful of catching Covid in the crowds there. Emergency department volume is down nearly 50% as the United States struggles with the Covid-19 epidemic. There is increasing evidence that patients with medical emergencies are avoiding the emergency department because of fear of contracting Covid-19, leading to increased morbidity and mortality. The entire medical system has shifted focus so overwhelmingly to Covid that other diseases are being neglected. All “nonessential surgeries” have been halted, and most ICU beds are reserved for Covid. This attempt to check Covid has unwittingly increased deaths from other causes. A Yale University study finds that from early March to April 4, the US had 15,400 excess deaths. The share of Covid in excess deaths was only 53% for the US, ranging from 77% in Michigan to just 18% in Maryland. In the UK ‘up to 1,50,000’ extra non-Covid-19 people, including 18,000 cancer patients, could die because the coronavirus fixation has caused neglect of other killer diseases. Increased suicides could kill 10 times as many Australians as the virus. The number of people suffering from acute hunger could almost double to 265 million from the worldwide impact on agricultural production and distribution. A study in South Africa shows the lockdown will kill 29 times more people than it saves. What will India’s balance be between lives saved and sacrificed?
- Infosys founder NR Narayana Murthy, in a recent webinar, said that a lengthy lockdown could kill more people in the country than the virus itself. He felt that the country must accept the Coronavirus as a new ‘normal’ and the government should allow the able-bodied to get back to work while also protecting the vulnerable section of the society at the same time. He said that around 190 million Indians are employed in the informal sector and the lockdown might have already impacted their livelihood. What is important for us to understand is that India cannot continue in this situation for too long. Because at some point in time, deaths due to hunger will far outweigh deaths due to coronavirus.” In low-income countries dominated by daily wage laborers working in the informal economy, people “fear hunger may kill us before coronavirus.”
- The Financial Times, London, analysed excess mortality in March and April — the excess of deaths in these two months compared with the average for five preceding years — for several countries, mostly European. It found excess mortality was a whopping 49%, but Covid caused barely half the excess. Perhaps the non-Covid deaths included some undetected Covid deaths. But in the main they were caused by the lockdown’s side effects. Excess mortality was 60% in Belgium, 51% in the Netherlands, but only 12% in Sweden. Now, Sweden was the only European country that refused to lock down, and kept going while advocating social distancing, frequent hand washing and constant sanitisation. This suggests that India’s lockdown, the strictest in the world, may have killed the economy without saving lives, because any reduction in Covid deaths may have been offset by excess mortality caused by the lockdown. India urgently needs analysis of its own excess mortality.
India must save not just lives but enterprises, which provide livelihoods. Half of India’s productive capacity has been locked down. India has 65 million enterprises, of which only 4 million are formally registered. The unregistered ones account for the bulk of employment and being killed en masse by the lockdown. If you cannot save these enterprises by restarting the economy, you will kill both enterprises and people.
- Moody’s Investors Service has slashed its estimate of India’s GDP growth during the 2020 calendar year to 2.5 per cent, from an earlier estimate of 5.3 per cent and said the coronavirus pandemic will cause unprecedented shock to the global economy. Acuite Ratings & Research Ltd estimated that the lockdown will cost the Indian economy almost US$ 4.64 billion (over Rs 35,000 crore) every day.
- At a Princeton University webinar recently, economics Nobel laureate Angus Deaton did not mention India by name, but he highlighted the danger of poor countries getting the worst of both worlds. Deaton said countries with strong administrations and health systems could enforce social spacing, comprehensive testing, isolation and treatment. This could check the epidemic. But in poor countries with weak administrative and medical capacity, shutdowns would not check the disease. Social distancing was impossible in densely populated urban slums, crowded bazaars and huts where several people slept. Virus testing capacity was weak, so detection, isolation and treatment were highly incomplete, and the disease would spread despite shutdowns. Deaton says deaths attributed to pandemics are exaggerated by “harvesting”: many who die are infirm people who would have died anyway in the next two years. He says this is why mortality rates always plunge the year after a pandemic. India should rapidly ease the Covid shutdown to revive the economy. Otherwise it may suffer the worst of both worlds — economic collapse without checking the virus.
The IMF predicts India’s GDP growth will drop to 1.9%, as bad as in 1991 when India went bust. If social distancing does not work and the economy fails to revive in the second half of 2020, the IMF says growth will be deeply negative, the worst performance in independent India. This economic disaster will create massive misery that will exacerbate illness and deaths. So, a prolonged shutdown may kill and make more people miserable than it saves.
The long-term impacts of the lockdowns will be deadly for the world’s poorest billion people over the next decade. The World Bank and the World Trade Organization warn of dramatic decelerations and contractions in GDP, with a resulting ballooning of poverty. Oxfam warns the pandemic could push another half billion people into poverty. The United Nations estimates the global economic downturn could cause “hundreds of thousands of additional child deaths in 2020.” A study by Johns Hopkins School of Public Health warns infant mortality could increase by 1.2 million this year in poor countries and maternal mortality by 56,700 because of ruptured health services. Professors Jay Bhattacharya and Mikko Packalen estimate the lockdown’s long-term global impact could “end up taking nearly six million young lives in the coming decade” in developing countries. India should remember that it is a developing country and comparing with the West vis-à-vis Covid-19 is unhelpful.
- The lockdown to reduce covid-19 spread have been both a demand and a supply shock to the economy. Indians cannot spend because of social distancing and the physical restrictions mean factories are running at their lowest capacity. The fact that a lockdown curtails economic activity is evident. But some economists now believe that the cost of a lockdown is higher than what they had previously estimated. Nomura Financial Advisory and Securities (India) Private Ltd puts India’s 2020 GDP growth at a negative 0.5% and Barclays estimates zero growth for the year.
- I am distressed by the plight of the 140 million migrant workers affected by Indian national lockdown as they were forced to leave the cities where they worked at just a few hours’ notice, unable to pay for rent or food. The perpetual extensions of lockdown period and closure of almost all the industries triggering the halt of related activities like construction, transport and movement of goods has left these labours perplexed and confused. The fear of getting stuck up and fast depletion of finances with them has led to an unprecedented exodus towards their native places. This is horrible and disastrous as will lead to spread of the pandemic in other areas and adversely affect in starting of economic activities and the industries in the area which they will leave. The lockdown in India represents a massive logistical and implementation challenge given the population size and its density, to stop the spread of the virus but government must ensure that measures responding to COVID-19 are neither applied in a discriminatory manner nor exacerbate existing inequalities and vulnerabilities. Lacking jobs and money, and with public transportation shut down, millions of migrants who have no job security or protection, were forced to walk often hundreds of miles back to their home villages – with some dying on the journey. On the top of it, reports and images emerged of police officers apparently beating migrants – with batons, for breaking quarantine rules and spraying some on the road, with disinfectant. India’s Supreme Court said that the migrants be treated in a humane manner, including by providing them with enough food, water, beds and supplies as well as psychosocial counselling in shelters that are run by volunteers and not security forces.
_______
_______
Section-14
Are we neglecting herd immunity?
_
Herd immunity is a form of indirect protection from infectious disease that occurs when a large percentage of a population has become immune to an infection, whether through previous infections or vaccination, thereby providing a measure of protection for individuals who are not immune. In a population in which a large proportion of individuals possess immunity, such people being unlikely to contribute to disease transmission, chains of infection are more likely to be disrupted, which either stops or slows the spread of disease. The greater the proportion of immune individuals in a community, the smaller the probability that non-immune individuals will come into contact with an infectious individual, helping to shield non-immune individuals from infection. When most people become immune to an infectious disease, it cannot jump to the remaining uninfected people. The whole ‘herd’ becomes immune. For example, immunizing children with the pneumococcal vaccine has greatly reduced the number of older adults hospitalized for pneumococcal disease. Herd immunity does not apply to all diseases, just those that are contagious, meaning that they can be transmitted from one individual to another. Tetanus, for example, is infectious but not contagious, so herd immunity does not apply.
The SARS-CoV-2 virus would have difficulty reestablishing itself in the community if a significant portion of people, between 50% and 70%, were infected and are now immune. But even in Wuhan — which accounted for more than half China’s 81,000 cases — the number of those people infected and are now immune to the disease is probably less than 10% — which means there are lots of people still vulnerable to infection. A vaccine would increase the percentage of immune people, but no vaccines are expected for at least a year.
_
Lockdowns and social-distancing can’t last forever. If a Covid-19 vaccine does not materialize soon, we’ll need to build ‘herd immunity’ through exposure to the virus. It’s a high-risk strategy with strong arguments for and against it. Herd immunity became a joke in March when British PM Boris Johnson fell sick with the coronavirus. Until then, he had pooh-poohed social-distancing. The UK was among the few countries considering a herd immunity strategy at the time. But now, Sweden claims its capital, Stockholm, could have herd immunity in a few weeks. “About 30% of people in Stockholm have reached a level of immunity,” Karin Olofsdotter, Sweden’s ambassador to the US said. Once more people have immunity, people in Stockholm could socialize, clasp hands and hug friends with only a small risk of infection. So many of them would have got infected and recovered that the virus would have a hard time finding new hosts. Sweden got there without lockdown. It trusted citizens to behave responsibly. Schools, malls and restaurants remained open. Family members of suspected cases weren’t quarantined. Kids could attend school even if someone at home was sick. It has paid a cost for this in terms of higher infection and death rates than its neighbors, but they are not as high as the doomsayers predicted. Maybe because Sweden is sparsely populated and its typical ‘household’ is a single person. The same response to Covid-19 might have proved disastrous in most other countries. But though it has got a bad rap, herd immunity is our only hope out of the Covid crisis. Lockdowns can’t last forever, and social-distancing is against human nature.
_
There’s a consensus that the pandemic will only end with the establishment of so-called herd immunity. The consensus ends on the way to get there. Most experts are counting on a vaccine to make us immune safely. Exposing everyone to the virus is too risky, they say. Hospitals will collapse under the rush of patients. Many millions could die. We are delaying the inevitable, says the opposite camp. “These measures of social-distancing mean we will find ourselves with Corona for a longer period,” an Israeli expert says. And the infection rates recorded under lockdown are unrealistic anyway, Jeff Howe, associate professor of journalism at Northeastern University, writes in The Boston Globe. When people go back to work in a few days or weeks, those numbers are going to shoot up.
Is herd immunity through exposure our best bet, then? No, says the World Health Organization: we don’t know enough about this virus. WHO expects recovered patients to have “some level of protection,” but doesn’t know how much. Does it leave you with lifelong immunity, or is it like the other coronaviruses that cause the common cold multiple times in a year? If it’s like them, intentional infection is a pointless risk.
Besides, building immunity through exposure is unjust to the old and disadvantaged, Australian epidemiologist Gideon Meyerowitz-Katz writes in The Guardian. “It requires us to sacrifice the vulnerable on the altar of the economy in truly vast numbers.” Herd immunity proponents say the elderly and people with pre-existing and chronic medical conditions could be isolated. Meyerowitz-Katz doesn’t agree. “The idea that we can only infect young people is simply incorrect. Firstly, because that’s not how society functions, but also because it will create clusters of low immunity where the disease can still spread.” In Stockholm, for instance, the elderly in care homes have borne the brunt of the virus.
The issue with achieving herd immunity via natural infections is that, very likely, a huge number of vulnerable people, such as people with weak immune systems, pregnant or elderly people, will get sick and die. Again, this is why achieving high levels of vaccine-mediated immunity is crucial to protecting them. Ideally, we would want a safe and effective vaccine to help us achieve immunity instead. That being said, as the pandemic develops, herd immunity will probably kick in at some later point and help control infection in the short to mid-term. But this should not be the sole goal for SARS-CoV-2 control. Rather, as the World Health Organization has outlined, aggressive testing and isolation measures are the best ways to slow the pandemic down.
Theresa Tam, Canada’s chief public health officer, adds another warning. Even a young person might get severely sick or get into the ICU and death isn’t the only thing we need to worry about. We don’t know anything about the long-term health complications the virus might cause. Cases of damage to the kidneys, liver, heart and brain have already come to light.
CNET says talk of herd immunity is futile at this stage because less than 1% of the world’s population has been infected so far, and already more than 350,000 people have died. Infecting 60-85% of people to create herd humanity would have an unimaginable human cost.
Epidemiologist Gideon Meyerowitz-Katz opposing a herd-immunity strategy agrees that “some unknowably large number of us will die in the process,” but adds that we shouldn’t extrapolate the current death rates. For one, hospitals have a better understanding of the virus now and can handle more patients. Secondly, more than 40 drugs are being trialed against Covid-19. If even one of them clicks, more patients will recover with shorter hospital stays, and the health system will be able to cope with the increasing number of patients.
To that, Bloomberg adds the 1% infection figure probably vastly underestimates the true number of cases. The number of patients who didn’t develop any symptoms, and weren’t tested or counted, is many times larger. So, perhaps, we are closer to herd immunity than the data suggests. Also, infection fatality rate is only 0.26% now and will reduce further, so many millions won’t die in the process of developing herd immunity.
The debate continues……
_______
_______
Section-15
Does weather modify spread of SARS-CoV-2?
_
Coronaviruses are a family of so-called “enveloped viruses”. This means they are coated in an oily coat, known as a lipid bilayer, studded with proteins that stick out like spikes of a crown, helping to give them their name – corona is Latin for crown. Research on other enveloped viruses suggests that this oily coat makes the viruses more susceptible to heat than those that do not have one. In colder conditions, the oily coat hardens into a rubber-like state, much like fat from cooked meat will harden as it cools, to protect the virus for longer when it is outside the body. Most enveloped viruses tend to show strong seasonality as a result of this. Research has already shown that SARS-Cov-2 can survive for up to 72 hours on hard surfaces like plastic and stainless steel at temperatures of between 21-23C (70-73F) and in relative humidity of 40%. A closely related coronavirus that caused the SARS outbreak in 2003 has also been found to survive best in cooler, drier conditions. For example, dried SARS virus on smooth surfaces remained infectious for over five days at between 22-25C and with a relative humidity of 40–50%. The higher the temperature and humidity, the shorter the virus survived.
______
Survival Under Different Conditions of Humidity and Temperature:
Some decades ago, a study estimated the survival rates of the HCoV 229E under different conditions of temperature and humidity. Results are reported in Table below.
|
Temperature |
20 °C |
6 °C |
||||
|
Time |
15 min |
24 h |
72 h |
6 days |
15 min |
24 h |
|
30% relative humidity |
87% |
65% |
>50% |
n.d. |
91% |
65% |
|
50% relative humidity |
90.9% |
75% |
>50% |
20% |
96.5% |
80% |
|
80% relative humidity |
55% |
3% |
0% |
n.d. |
104.8% |
86% |
(n.d.: not done)
High relative humidity seemed less favorable to the virus, unless the temperature came down to 6 °C. At this temperature, the survival of the HCoV 229E was significantly enhanced whatever the rate of relative humidity.
_
Sensitivity of SARS-CoV to temperature has also been assayed. The exposure of the virus to a temperature of 56 °C over 30 min reduced virus titer under an undetectable level, except if SARS-CoV is associated with proteins, such as 20% fetal calf serum (FCS), which bring a protection for the virus. In this case, the temperature needs to reach 60 °C over 30 min to bring virus titer below the detection limit. This emphasizes the importance of organic material in which viruses could be embedded in the real conditions and could protect the virus, mostly from disinfection procedures. When the virus was placed at 4 °C, there was no loss of infectivity. Another study confirms the viral stability at 4 °C, and also at 20 °C and 37 °C for at least 2 hours, but SARS-CoV lost its infectivity after 90, 60 and 30 min exposure at 56 °C, 67 °C and 75 °C, respectively.
______
Can a warmer climate reduce the spread of COVID-19 and other viruses?
With influenza, there is a seasonal pattern – it spikes up in the winter and goes down in the summer. But is it the virus itself or are there other factors? The four factors to look at are the environment, so the temperature and humidity. Then the human factor: we tend to stay indoors, closer to one another [in winter months], and that increases transmissibility. The third is our immune system. There’s some hypotheses that our immune system is lowered in colder months because those of us in the northern hemisphere, we don’t see the sun as much and the sun helps generate something called vitamin D, which is an immune-system booster. The fourth thing is the ability for the virus itself to replicate given the number of susceptible hosts – as the proportion of susceptible contacts declines, the epidemic peaks, and eventually declines.
We have to take all those factors into account. Coronaviruses are enveloped viruses and the envelope itself tends to be a bit more fragile with increased heat and increased humidity. But that’s not the case for all enveloped viruses.
Studies that came out of the Middle East around MERS-CoV, the last coronavirus epidemic, found that it did prefer colder temperatures and lower humidity. With the SARS one, it tended to follow that as well. But it did not go away because of warmer weather, but rather because of measures that were put into place to control that epidemic, such as social distancing and isolating cases and quarantining their contacts. And that was the major reason we saw the SARS epidemic go away; SARS did not go away because of the warmer temperature effect. So, with the new virus, the SARS-CoV-2, which causes COVID-19, we could expect it to behave like other coronaviruses.
Even if it behaves the same as the influenza virus in terms of these factors, that doesn’t eliminate transmissibility, it might just reduce it somewhat. And one major difference between SARS-CoV-2 and influenza is that SARS-CoV-2 is a novel virus – no one in the world has any immunity to it. So in the summer months in the northern hemisphere with influenza, the transmissibility goes down for a number of factors, and that’s enough to shut off transmission. And that may be partly because a lot of the population has immunity already, because of vaccination or partial immunity from previous infection. With SARS-CoV-2, even if transmissibility is reduced in the summer, it is very unlikely that’s going to have enough of an effect that the virus will disappear, because there are enough susceptible people to sustain direct person to person transmission. In countries like India where temperature is 40 deg Celsius in summer, the survival of SARS-CoV-2 is markedly reduced in environment and hence person to environment to person transmission is reduced. The greater the time the virus remains stable in the environment, the greater its capacity to infect other people and become epidemic. While Sars-Cov-2 has quickly spread all over the world, the major outbreaks have mainly occurred in places exposed to cool and dry weather.
_
Conflicting studies:
In the first study to look at the effect of weather on covid-19, posted online in February, researchers at Harvard University looked at the effects of temperature and humidity on the virus’s transmission in China, Thailand, Singapore, Japan, South Korea and Taiwan, based on weather reports and data on covid-19 incidence between 23 January and 10 February. They found no significant difference in transmission rates between cold and dry provinces of China and tropical ones, as well as Singapore, concluding that higher temperature and humidity “will not necessarily lead to declines in case counts”.
However, another study appeared the next day, which analysed data from Wuhan, the Chinese city where the coronavirus emerged. Alarmingly, it found that the virus seems to spread better in summery weather, with an optimum temperature of 19˚C, humidity of 75 per cent and less than 30 millimeters of monthly rain. Even more worryingly, the researchers found that cold air destroys the virus. They recommended that, as the weather warms, containment measures should be ramped up.
Since then, plenty studies have been posted online. Most have found the opposite.
For example, one analysis looked at all 80,981 cases of covid-19 across mainland China between 20 January and 29 February. It found that the optimum temperature for virus transmission is 10˚C, and that lower or higher temperatures suppress it. It found no link at all to humidity.
In an experiment using SARS-CoV-2 in a lab solution, increasing temperature decreased the amount of viable virus that could be detected, according to an April 2 study in the Lancet Microbe. No infectious virus remained after 30 minutes at 56° Celsius (133° Fahrenheit). And just five minutes at 70° C was enough to inactivate the pathogen. But these temperature highs are rare, if not impossible, in the lower atmosphere.
One early study of the outbreak, posted March 30 at medRxiv.org, suggested that for every 1 degree C increase in atmospheric temperature at relatively high levels of humidity, daily confirmed cases decreased by 36 to 57 percent in China’s Hubei Province. That pattern did not hold across mainland China, though.
Another study, released March 19 and later updated on the preprint repository SSRN, found that 90 percent of global transmission through March 22 occurred when temperatures were between 3° and 17° C. However that study, by a computational neuroscientist and environmental engineer at MIT, did not account for variables such as countries’ testing capacities or policy responses.
A study conducted 10 years ago by Kate Templeton, from the Centre for Infectious Diseases at the University of Edinburgh, UK, found that three coronaviruses – all obtained from patients with respiratory tract infections at hospitals and GP surgeries in Edinburgh – showed “marked winter seasonality”. These viruses seemed to cause infections mainly between December and April – a similar pattern to that seen with influenza. A fourth coronavirus, which was mainly found in patients with reduced immune systems, was far more sporadic.
A key study of the common coronaviruses – HCoV-NL63, HCoV-OC43 and HCoV-229E – was published by scientists at University College London. By analysing samples collected several years ago they found high rates of coronavirus infections in February, while in summer they were very low. Other studies have also shown coronaviruses are seasonal in behaviour in temperate climates. The study’s lead author, Rob Aldridge, sounded a note of caution, however. “We could see continued but lower levels of coronavirus transmission in summer but this may reverse in the winter if there is still a large susceptible population at that point,” he said.
An unpublished analysis comparing the weather in 500 locations around the world where there have been Covid-19 cases seems to suggest a link between the spread of the virus and temperature, wind speed and relative humidity. Another unpublished study has also shown higher temperatures are linked to lower incidence of Covid-19, but notes that temperature alone cannot account for the global variation in incidence. Further as-yet-unpublished research predicts that temperate warm and cold climates are the most vulnerable to the current Covid-19 outbreak, followed by arid regions. Tropical parts of the world are likely to be least affected, the researchers say.
A study from the University of Maryland has shown that the virus has spread most in cities and regions of the world where average temperatures have been around 5-11C (41-52F) and relative humidity has been low.
Another study examined every global confirmed case up to 29 February. It found that higher temperatures are associated with lower disease incidence. But the researchers say any conclusions are provisional due to limited data. “We are currently revising the analysis with more recent data,” says lead researcher Melanie Bannister-Tyrrell of Ausvet, an epidemiology consultancy in Australia. “We prefer to reserve comment until we have the revised analysis available.”
This warning is echoed by biologist Francois Balloux at University College London. “Seasonality is difficult to predict,” he says. Keeping tracking of covid-19 cases over time and as seasons change could create a more accurate picture.
The fact that there is an ongoing epidemic in parts of the southern hemisphere also gives some public health experts cause to worry. “If, for example, we look at the epidemic in Australia – where it is still their summer, moving towards their autumn – there are a lot of cases and they’re having an acceleration of an epidemic there,” says Jimmy Whitworth at the London School of Hygiene and Tropical Medicine. “So I take from that that warm weather is not going to be highly protective for us.” But, he adds, “this is an unfamiliar virus, so we don’t know”.
It is possible, however, that the virus will eventually become seasonal like flu, says virologist Michael Skinner at Imperial College London. “It will probably become seasonal when it eventually settles down to the normal patterns of transmission we see for the other human respiratory coronaviruses, in a population that consists of immune and immunologically naive individuals. “That does not mean that it will follow seasonal dynamics during the larger epidemics – there may be just too many people infected so that most transmission is short range and less subject to environmental constraints,” says Skinner.
For now, the World Health Organization says that the virus can be transmitted in all areas, “including areas with hot and humid weather”.
Pandemics often don’t follow the same seasonal patterns seen in more normal outbreaks. Spanish flu, for example, peaked during the summer months, while most flu outbreaks occur during the winter.
______
COVID-19 pandemic unlikely to ebb as weather warms: April 08, 2020:
Although some pundits have suggested that the COVID-19 pandemic will dissipate with coming warm temperatures and high humidity in the Northern Hemisphere, the virus is unlikely to be seasonal in nature, according to a paper published by the National Academy of Sciences, Engineering, and Medicine. In the paper, the National Academies’ Standing Committee on Emerging Infectious Diseases and 21st Century Health Threats said that the number of well-controlled studies showing reduced survival of the coronavirus in elevated temperatures and humidity is small and urged caution not to over-interpret these results because of varied and questionable data quality.
Even if warmth were unfavorable for COVID-19, “given the lack of host immunity globally, this reduction in transmission efficiency may not lead to a significant reduction in disease spread without the concomitant adoption of major public health interventions,” they wrote. “Given that countries currently in ‘summer’ climates, such as Australia and Iran, are experiencing rapid virus spread, a decrease in cases with increases in humidity and temperature elsewhere should not be assumed.” They added that neither the coronaviruses that cause severe acute respiratory syndrome (SARS) and Middle East respiratory syndrome (MERS) nor the flu strains of previous pandemics have shown a seasonal pattern. “There have been 10 influenza pandemics in the past 250-plus years—two started in the northern hemisphere winter, three in the spring, two in the summer and three in the fall,” they said. “All had a peak second wave approximately six months after emergence of the virus in the human population, regardless of when the initial introduction occurred.”
_
In the weather-related study, researchers at Fudan University in Shanghai gathered data on 17 cities inside Hubei province and 207 outside with at least 10 confirmed COVID-19 cases as of Mar 9 from the National Health Commission and the Provincial Health Commissions of China. The underlying hypothesis was that spread of the coronavirus may diminish in summer, when higher levels of vitamin D improve immune responses, there is more UV exposure, and children are not clustered together in schools. The investigators calculated the R0 (R-naught) for 12 cities inside Hubei and 50 outside with more than 50 cases as of Feb 10, the peak of the pandemic in China. The R0 reflects how many people each infected person will in turn infect.
Using multiple regression methods, the investigators evaluated the associations between daily mean temperature, relative humidity, and UV radiation and the spread of the virus from early January to early March in the 224 cities. After adjusting for relative humidity and UV radiation, temperature had no significant link to cumulative incidence rate (chi-square = 5.03, P = 0.28) or R0 (chi-square = 0.93, P = 0.92) in cities inside or outside of Hubei, indicating that coronavirus transmission would not change with rising temperatures. Neither was UV radiation significantly associated with cumulative incidence rate (chi-square = 5.50, P = 0.24) or R0 (chi-square = 0.91, P = 0.92) after adjusting for temperature and relative humidity, indicating that spread would not change with increasing UV exposure.
The authors identified no significant association between relative humanity, maximum temperature, and minimum temperature with cumulative incidence rate or R0. “In summary, our study does not support the hypothesis that high temperature and UV radiation can reduce the transmission of COVID-19,” they wrote. “It might be premature to count on warmer weather to control COVID-19.”
_
Susceptible supply limits the role of climate in the early SARS-CoV-2 pandemic, May 2020:
Pandemic in the summer:
The warmth and humidity of the summer months may not offer substantial relief from the COVID-19 pandemic, according to a modeling study in Science. Researchers used data on two coronaviruses closely related to SARS-CoV-2 to predict the course of the pandemic over the coming months. They found that “while variations in weather may be important for endemic infections, during the pandemic stage of an emerging pathogen the climate drives only modest changes to pandemic size.” Instead, the population’s level of immunity has a much greater influence on an outbreak’s trajectory. The researchers conclude that “both tropical and temperate locations should prepare for severe outbreaks of [COVID-19] and that summertime temperatures will not effectively limit the spread” of the infection.
_______
_______
Temperature and humidity do reduce covid-19 transmission according to following studies:
_
Study-1
Sunlight Kills Coronavirus – US Dept of Homeland Security Study: April 2020:
Preliminary results from a study by the US Department of Homeland Security has shown that Sunlight kills Coronavirus. Lab experiments showed that the coronavirus does not survive long in high temperatures and high humidity, and is quickly destroyed by sunlight, providing evidence from controlled tests.
The unpublished research by the U.S. Department of Homeland Security (DHS) found that sunlight coupled with high relative humidity, of over 40%, can potentially prevent the spread of COVID-19. The experiment was carried out in a controlled environment. A droplet of saliva from a cough or sneeze was kept under observations under varying conditions related to temperature, humidity and sunlight. Tests ultimately revealed how viruses in the saliva reacted to changes in ambient weather conditions.
The results showed:
- Virus lives longer at low humidity and inactivates faster at higher humidity
- Virus lives longer at low temperatures and inactivates faster as temperature increases
- Sunlight destroys the virus quickly
_
Study-2
Role of temperature and humidity in the modulation of the doubling time of COVID-19 cases: March 2020:
In this study, an exponential model relating the number of accumulated confirmed cases and time was considered. The rate of COVID-19 spread, using as criterion the doubling time of the number of confirmed cases, was used as dependent variable in a linear model that took four independent meteorological variables: temperature, humidity, precipitation and wind speed. Only China cases were considered, to control both cultural aspects and containment policies. Confirmed cases and the 4 meteorological variables were gathered between January 23 and March 1 (39 days) for the 31 provinces of Mainland China. Several periods of time were sampled for each province, obtaining more than one value for the rate of disease progression. Two different periods of time were tested, of 12 and 15 days, along with 3 and 5 different starting points in time, randomly chosen. The median value for each meteorological variable was computed, using the same time period; models with adjusted R square above > 0.75 were selected. The rate of progression and doubling time were computed and used to fit a linear regression model. Models were evaluated using alpha=0.05.
Results indicate that the doubling time correlates positively with temperature and inversely with humidity, suggesting that a decrease in the rate of progression of COVID-19 with the arrival of spring and summer in the north hemisphere. A 20ºC increase is expected to delay the doubling time in 1.8 days. Those variables explain 18% of the variation in disease doubling time; the remaining 82% may be related to containment measures, general health policies, population density, transportation or cultural aspects.
_
Study-3
Will Coronavirus Pandemic Diminish by Summer? April 2020
“Based on the current data on the spread of 2019-nCoV [or SARS-CoV-2, which causes the illness COVID-19], authors hypothesize that the lower number of cases in tropical countries might be due to warm humid conditions, under which the spread of the virus might be slower as has been observed for other viruses,” Bukhari and Jameel wrote in the research paper. But, they cautioned, “The underlying reasoning behind this relationship is still not clear.” “Our key findings are that so far at absolute humidity levels above 10 g/m^3, the spread of the cases appears to be slower than at places with absolute humidity levels less than 10 g/m^3,” Jameel said. Their research found that countries with warmer and more humid climates, like Singapore, Malaysia, Thailand, and other southeast Asian countries saw a lower growth rate. Meanwhile, countries and states experiencing high growth rates, including Italy, South Korea, and, in the U.S., New York and Washington states, “exhibit weather patterns similar to original hotspots of Hubei and Hunan with mean temperatures between 3 and 10 C (37.4 and 50 F) in February and March.” “While we identified weather-related effects, we highly stress on using the proper quarantine measures even in warmer humid regions, to effectively reduce the transmission of 2019-nCoV and protect the vulnerable against it,” the authors wrote in the paper. “To date, the most effective way to reduce the transmission of this virus is social distancing. Without this,” Jameel said, “no weather would help anyone in any part of the world.”
_
Study-4
The role of climate during the COVID‐19 epidemic in New South Wales, Australia, May 2020:
A study conducted in Sydney during the early epidemic stage of COVID-19 has found an association between lower humidity and an increase in locally acquired positive cases. Researchers discovered a 1 percent decrease in humidity could increase the number of COVID-19 cases by 6 percent. The research led by Professor Michael Ward, an epidemiologist in the Sydney School of Veterinary Science at the University of Sydney, and two researchers from partner institution Fudan University School of Public Health in Shanghai, China, is the first peer-reviewed study of a relationship between climate and COVID-19 in the southern hemisphere.
“The pandemic in China, Europe and North America happened in winter so we were interested to see if the association between COVID-19 cases and climate was different in Australia in late summer and early autumn,” Professor Ward said. “When it comes to climate, we found that lower humidity is the main driver here, rather than colder temperatures,” Professor Ward said. “It means we may see an increased risk in winter here, when we have a drop in humidity. But in the northern hemisphere, in areas with lower humidity or during periods when humidity drops, there might be a risk even during the summer months. So vigilance must be maintained.” Professor Ward said there are biological reasons why humidity matters in transmission of airborne viruses. “When the humidity is lower, the air is drier and it makes the aerosols smaller,” he said. “When you sneeze and cough those smaller infectious aerosols can stay suspended in the air for longer. That increases the exposure for other people. When the air is humid and the aerosols are larger and heavier, they fall and hit surfaces quicker.”
_
Study-5
Likelihood of survival of coronavirus in a respiratory droplet deposited on a solid surface feature: May 2020:
One of the many questions researchers have about COVID-19 is how long the coronavirus causing the disease remains alive after someone infected with it coughs or sneezes. Once the droplets carrying the virus evaporate, the residual virus dies quickly, so the survival and transmission of COVID-19 are directly impacted by how long the droplets remain intact. Cities where cough or sneeze droplets took a shorter time to dry out due to higher temperature and lower humidity had a lesser spread of Covid-19 infection, a study by two professors from IIT-Bombay has found.
In a paper in Physics of Fluids, researchers examine the drying time of respiratory droplets from COVID-19-infected subjects on various surfaces in six cities around the world. These droplets are expelled from the mouth or nose when someone with COVID-19 coughs, sneezes or even speaks moistly. The droplet size is on the order of human hair width, and the researchers examined frequently touched surfaces, such as door handles and smartphone touchscreens.
Using a mathematical model well established in the field of interface science, the drying time calculations showed ambient temperature, type of surface and relative humidity play critical roles. For example, higher ambient temperature helped to dry out the droplet faster and drastically reduced the chances of virus survival. In places with greater humidity, the droplet stayed on surfaces longer, and the virus survival chances improved.
The researchers determined the droplet drying time in different outdoor weather conditions and examined if this data connected to the growth rate of the COVID-19 pandemic. Researchers selected New York, Chicago, Los Angeles, Miami, Sydney and Singapore and plotted the growth rate of COVID-19 patients in these cities with the drying time of a typical droplet. In the cities with a larger growth rate of the pandemic, the drying time was longer. “In a way, that could explain a slow or fast growth of the infection in a particular city. This may not be the sole factor, but definitely, the outdoor weather matters in the growth rate of the infection,” said Rajneesh Bhardwaj, one of the authors. “Understanding virus survival in a drying droplet could be helpful for other transmissible diseases that spread through respiratory droplets, such as influenza A,” said Amit Agrawal, another author. “The likelihood of survival of the virus increases roughly by five times under humid conditions compared to dry conditions,’’ said Bhardwaj.
On the eve of monsoons, which is accompanied by high humidity levels of over 80% in Mumbai, Agrawal feared the city could see a surge in infections. “In Mumbai and cities in Kerala, if humidity is one of the main factors determining the infection, we could expect things to worsen.”
But several doctors were not convinced. The high humidity levels and the monsoon could actually work in Mumbai’s favour, said a civic doctor. “The virus-carrying droplet ejected by a patient will be dragged down due to the higher humidity levels and not remain suspended in air. The rains would then wash it away,” said the doctor.
______
______
Section-16
Are children immune to covid-19?
Children can definitely catch COVID-19, though reports suggested fewer cases in children compared with adults. Available reports suggest that SARS-CoV-2 infection in children appears to be unusual. Among 44.672 confirmed cases, Chinese Centre of Disease Control and Prevention report showed 416 paediatric confirmed cases in 0–9 years age group (0.9%) with no fatalities and 549 cases in 10–19 years age group (1.2%) with 1 fatality (0.2%). Latest Italian report showed similar results with 318 (0.5%) confirmed cases in 0–9 years age group and 386 (0.7%) confirmed cases in 10–19 years age group. No children were recovered in the intensive care unit and no deaths were reported.
_
Clinical and epidemiological features of 36 children with coronavirus disease 2019 (COVID-19) in Zhejiang, China: an observational cohort study: March 2020:
This study shows that paediatric patients with COVID-19 have a simple transmission mode, either by close contact with infected adults or by exposure to epidemic areas. Although fever, dry cough, and mild pneumonia are common manifestations, nearly half of patients have neither obvious symptoms nor abnormal radiological findings. The proportion of asymptomatic cases indicates the difficulty in identifying paediatric patients without clear epidemiological information. This finding suggests a dangerous situation if community-acquired infections occur.
_
COVID-19 in Children in the United States: April 2020:
This CDC report provides a summary of pediatric patients with COVID-19 in the U.S.
Researchers examined almost 150,000 laboratory-confirmed cases of COVID-19 between February 12 and April 2. Of these, 2572 (1.7%) were <18 years old. For cases with available information, findings include:
- Median age was 11 years (range, >1 to 17 years).
- 73% of children had the classic COVID-19 symptoms (fever [56%], cough [54%], shortness of breath [13%]) versus 93% of adults.
- Other symptoms noted in children included sore throat (24%), headache (28%), and myalgias (23%), all at lower frequencies than reported in adults.
- Hospitalizations were lower for children (5.7%) than for adults aged 18 to 64 years (10%), including fewer intensive care unit admissions.
- 68% of children had no symptoms (there was incomplete symptom reporting).
- 23% of children had an underlying condition, including asthma, immunosuppression, and cardiovascular disease.
Consistent with findings from other countries, U.S. children appear to have fewer symptoms and less-frequent need for hospitalization than adults.
_____
Severe illness in children:
Of 48 children with COVID-19 admitted to 14 U.S. pediatric ICUs between mid-March and early April, over 80% had underlying medical conditions, a JAMA Pediatrics study finds. The most common underlying conditions were immune suppression/cancer, followed by obesity and diabetes. Roughly three quarters presented with respiratory symptoms, and nearly 40% overall required invasive ventilation. At follow-up, two patients (ages 12 and 17 years) had died; 15 were still hospitalized. Among those discharged, the median length of ICU stay was 5 days and the median length of hospital stay was 7 days. Of note, severe COVID-19 in children was relatively rare: 46 pediatric ICUs were studied, but just these 14 (30%) reported cases.
______
Severe Acute Respiratory Syndrome Coronavirus 2 (SARS-CoV-2) Infection in Children and Adolescents, A Systematic Review: April 2020:
In this systematic review of 18 studies with 1065 participants, most pediatric patients with SARS-CoV-2 infection presented with fever, dry cough, and fatigue or were asymptomatic; 1 infant presented with pneumonia, complicated by shock and kidney failure, and was successfully treated with intensive care. Most pediatric patients were hospitalized, and symptomatic children received mainly supportive care; no deaths were reported in the age range of 0 to 9 years. Most children with COVID-19 presented with mild symptoms, if any, generally required supportive care only, and typically had a good prognosis and recovered within 1 to 2 weeks.
_
Will children reveal their secret? The coronavirus dilemma: European Respiratory Journal 2020:
Epidemiological evidences show that SARS-CoV-2 infection in children is less frequent and severe than adults. Authors can speculate that high ACE2 receptor concentrations, trained immunity and a constitutional high lymphocyte count in children may partially explain the mild disease observed in this group of patients. The increase concentration of ACE2 receptors in lung pneumocytes in children may have a protective effect on severe clinical manifestations due to SARS-CoV-2 infection. Both frequent viral infections and vaccines in children could induce an innate immune system enhanced state of activation, which would result in more effective defence against different pathogens. In children with SARS-CoV-2, peripheral blood lymphocytes remain mostly in normal range, suggesting less immune dysfunction. In healthy children, this could be related to the fact that lymphocytes, especially NK cells, are constitutionally in greater amount than healthy adults. Lymphocyte count is very high in the first months of life and decreases in later childhood and in adolescence. Moreover, lymphocytes could be higher in children even due to frequently experienced viral infections in childhood, as the result of an everlasting immune system activation in the first years of life.
_
ACE2 gene expression in children’s noses:
ACE2 gene expression in the nasal epithelium is lowest in children younger than 10 years old and then increases with age, according to findings in JAMA. The researchers — noting that ACE2 is the receptor that SARS-CoV-2 uses to enter host cells — write, “Lower ACE2 expression in children relative to adults may help explain why COVID-19 is less prevalent in children.” Their findings were based on a retrospective analysis of ACE2 expression in nasal epithelium samples taken from roughly 300 patients in a New York City health system in 2015-2018.
_
Why does the virus seem to affect children differently? Why do children infected with novel coronavirus fare better than adults?
- Lower ACE2 expression in nasal epithelium in children relative to adults may help explain why COVID-19 is less prevalent in children.
- Because children have fewer chronic cardiovascular and respiratory conditions, they are more resilient to severe coronavirus infection than elderly adults.
- Children, with immature immune systems, appear to be less capable of mounting cytokine storms to fight off viral infections and it is cytokine storm that leads to ARDS and death.
- Children are exposed to a large number of novel respiratory infections especially those in nursery or school, and this might result in them having higher baseline levels of antibodies against viruses than adult.
______
______
Section-17
Relapse or reinfection or false negative tests:
_
Immunity after any infection can range from lifelong and complete to nearly nonexistent; and our immune responses to this virus aren’t likely to be permanent or perfect. There may be many unanswered questions about how our bodies fight off SARS-CoV-2 infection, but one broader point is very clear: Adaptive immunity is not an on/off switch. Instead of treating it as such, we should learn to think in terms of an immunity continuum. At one end is what’s called sterilizing immunity, in which exposure to a pathogen tends to induce a lifelong, fail-safe protection from it. That’s the case with measles. At the other end is no immunity at all, where a history of prior illness doesn’t seem to matter—or, indeed, where it could even make things worse. Having an immune response to one strain of the virus causing dengue fever, for example, can worsen your reaction to the other types.
Experts say that SARS-CoV-2 likely falls somewhere in the middle, such that people who get exposed are neither sterilized against further illness nor left utterly defenseless. Instead, they enter into a state you might think of as “immunishness,” an intermediate level of protection that dwindles over time. The robustness of this immunish state—whether it prevents all reinfection or merely makes a second round of sickness less intense—and the period of time for which it lasts will depend on multiple factors, such as a patient’s genetics and sex (women tend to have stronger immune reactions than men), the strength of their initial immune response, and the characteristics of the virus itself as it continues to evolve.
_
If we want to know the duration of this immunity, whatever its strength, we’ll need to learn more about how the most relevant antibody levels change in the months or years post-infection. Previous studies of older, less dangerous coronaviruses seem to suggest that protection is short-lived: Antibody levels fall off significantly within a few months and continue to decline. A small study from 1990 re-exposed nine patients who had developed a mild cold to the same coronavirus a year later. Two-thirds of them developed a new bout of the infection, though they were contagious for a shorter period the second time around. The pattern may well be very different for SARS-CoV-2. Other research finds that decay rates for immunity can vary quite a bit from person to person, even in response to the same pathogen (or vaccine) exposure.
_
How sick you get with Covid-19 the first time may also make a difference. Those who recover from severe cases could end up with stronger immunity than those who were asymptomatic. Research from pathologist and immunology researcher Scott Boyd’s group at Stanford suggests that people in this category make higher levels of antibodies to the virus. There’s also a bit of preliminary evidence suggesting that at least some people may not develop much immunity at all on first exposure. Data from 175 patients in China who had only mild symptoms showed that about one-quarter of them developed only a weak immune response, as measured by antibody levels, while about 5 percent showed no measurable response at all.
_
A report from South Korea found that 91 patients who’d recovered from SARS-CoV-2 tested positive later, suggesting either that they’d been reinfected or that the first infection was reactivated. There have also been reports of possible reinfection in China and Japan. One explanation for these incidents is that they’re not a sign that people are being infected, recovering, and then becoming infected again, but rather that the testing had been problematic. For instance, tests might be turning up false negatives and then later picking up signs of the initial infection. One intriguing possibility is that previous exposure to other coronaviruses offers a bit of protection. An old study of milder coronaviruses suggests this could be true. Tulane University virologist Robert Garry and his research group have seen some patients with Covid-19 mount the sort of immune response you’d expect from someone experiencing a second exposure to the same pathogen. “Obviously they weren’t infected with SARS-CoV-2 before,” Garry says, but it may be that the new virus is similar enough to the seasonal coronaviruses that cause the common cold that it triggers a memory response. This could explain why Covid-19 cases seem to be less severe in children than adults: Maybe kids are more likely to have had recent exposure to the other coronaviruses.
_
COVID-19 reinfection not a concern, Monkey Study Suggests: March 2020:
Concerns about SARS-CoV-2 infection have reached an all-time high in the United States and around the globe. With increasing numbers of COVID-19 cases, hospitalizations, and deaths—and “social distancing” now a household word—the possibility of being infected is on everyone’s mind. As if that weren’t enough to worry about, the surfacing of multiple personal accounts—primarily out of China and Japan—of patients who recovered after infection only to fall ill a second time, have some worried about the possibility of reinfection.
Now, a collaboration of Chinese scientists has dug deeper into whether or not reinfection with SARS-CoV-2 is possible with a small monkey study. The team looked at whether or not non-human primates, rhesus macaques, can become reinfected with SARS-CoV-2. The work was posted on the preprint server bioRxiv on March 14 in a paper titled, “Reinfection could not occur in SARS-CoV-2 infected rhesus macaques.” Their conclusion: there may be no reason to worry about reinfection.
The study used four, adult Chinese rhesus macaques. After intratracheal infection, the monkeys were analyzed on schedule, including measurements such as body weight, body temperature, lung x-rays, sampling of sera, nasal/throat/anal swabs, and primary tissues. The rhesus monkeys were successfully infected, as measured by weight loss, viral replication mainly in the nose, pharynx, lung, and gut, as well as moderate interstitial pneumonia. In order to identify the distribution of the virus in the body, and to analyze histopathological changes in the infected monkeys, one of the monkeys was euthanized seven days after infection. Lesions occurred mainly in the lung, confirmed by H&E and anti-spike protein of SARS-CoV-2 staining. The monkey was determined to have mild to moderate interstitial pneumonia. In addition, the chest x-ray at seven days post-infection showed that the upper lobe of the right lung had varying degrees of the localized infiltration and interstitial markings, showing the mild to bilateral ground-glass opacification.
The team then waited until the remaining three monkeys’ symptoms were alleviated. The monkeys were cleared of the infection by meeting the clinical discharge evaluation criteria (absence of clinical symptoms and two negative RT-PCR test results). Two of the three remaining monkeys were rechallenged at 29 days post-infection with the same dose of the SARS-CoV-2 strain. One monkey was untreated and monitored as a control. The team measured the amount of virus in the monkeys at five days post-reinfection. The viral loads in 96 nasopharyngeal and anal swabs tested negative. One of the two reexposed monkeys was euthanized to analyze the viral replication and histological changes. No viral replication in all tissues was observed. In addition, no pathological damage and viral antigen in lung tissues were found in the sacrificed monkey.
Taken together, the monkeys that had been reexposed to SARS-CoV-2 were like the control monkey—with no recurrence of COVID-19. Further, these data suggest that primary SARS-CoV-2 infection could protect from subsequent exposures which will have important implications for vaccine design.
How do these data position themselves with the reports suggesting that discharged patients (as many as 14%) tested positive after recovery? One explanation then, is that patients were simply not fully recovered, despite meeting discharge criteria. Another could be attributed to the “false negative” RT-PCR test results before their discharge. The unsuccessful rechallenge in this particular study suggests that the positive tests from previously recovered and discharged patients are likely not due to reinfection and that there may be more complicated reasons for the result.
_____
COVID-19 relapse?
As the whole world puts up a collective fight against the novel coronavirus disease (COVID-19) pandemic, some worrying news has cropped up from across Asia — patients who tested negative of the disease are getting infected with the virus (SARS-CoV-2) again. Such cases have been reported from South Korea, China and Japan. Three probable explanations are being proffered to explain the trend.
- The first explanation suggests that patients who tested negative are being reinfected. This is unusual as people who have already contracted the disease build antibodies against the pathogen that offers protection for at least some time. Researchers from China addressed the possibility of reinfection by conducting experiments on rhesus monkeys discussed above. However, this might not be that simple. As of now, we have no idea how long the immunity from the disease can last. In case of common cold — also caused by members of the coronavirus family — resistance is provided only for a few months. A review of available information on this subject by the Norwegian Institute of Public Health found very limited evidence on immunity after infection with SARS-CoV-2. Two studies showed sustainable immunoglobulin (IgG) levels one to two years after SARS-CoV infection, but it is uncertain whether this finding can be generalized to SARS-CoV-2. It is also uncertain whether sustained levels of antibodies will provide full protection against reinfection.
Researchers at the School of Basic Medical Sciences, Fudan University, Shanghai studied blood samples from patients who had been released after treatment and found that nearly a third had low levels of antibodies. In some patients, the antibodies could not be detected at all. The titers (concentration) of antibodies varied according to age. Older patients had more antibodies than the younger ones. The study was published in medRxiv on March 30, 2020 and has not been peer-reviewed. This could mean that if the real virus cannot induce an antibody response, the weakened version used in a vaccine may not work.
- The second reason offered on the front was reactivation of the virus in some patients. South Korea’s Centre for Disease Control (CDC) claimed the virus reactivated in some patients. It said it would study this further. “The most likely explanation is that people have simmering virus replication for an unusually long time and this can occasionally result in late reactivation. Most available data stated that the length of virus detection varies from person to person, so it isn’t surprising that some people might continue to produce the virus and get sick,” says Dave O’ Connor, professor at the Department of Pathology and Laboratory Medicine, University of Wisconsin-Madison. This explanation, too, is worrisome as this could possibly mean that herd immunity would not work against the pandemic.
- The third possibility is the tests declaring the patients to be free of the virus are giving false negative reactions. This means that other than improving diagnostic tests, there is a need to improve sampling techniques. “It is not known for sure what is happening, but it is likely that the virus is still growing at some site in the body, perhaps the lower lung or intestines, which is harder to sample and is giving a false negative for the virus,” said Benjamin Neuman, professor of biological sciences at Texas A&M University, Texas.
However, it could also be that patients are testing positive because of residual viral ribonucleic acid in their bodies. In the Chinese city of Shenzhen, researchers found that 38 of 262 patients tested positive after they were discharged from hospitals. People they came in contact with did not test positive for the virus. The study was published on the preprint server Medrxiv on March 26, 2020. Nearly 300 people in South Korea who have recovered from COVID-19 have tested positive a second time, leading to speculation of reinfection. It is possible that the second positive tests after recovery could be related to inactive virus RNA in patients’ cells. RNA fragments still can exist in a cell even if the virus is inactivated. It is more likely that those who tested positive again picked up virus RNA that has already been inactivated. The coronavirus’ biological interactions with human DNA strands show its lack of ability to “create chronic infections.”
______
______
Section-18
Ventilators vs. nasal/facemask oxygen?
_
Severe cases are most common in older adults (those older than 60 years, and especially those older than 80 years). Many developed countries do not have enough hospital beds per capita, which limits a health system’s capacity to handle a sudden spike in the number of COVID-19 cases severe enough to require hospitalisation. This limited capacity is a significant driver behind calls to “flatten the curve” — to lower the speed at which new cases occur and thus keep the number of persons sick at any one time lower. One study in China found 5% were admitted to intensive care units, 2.3% needed mechanical support of ventilation, and 1.4% died. Around 20–30% of the people in hospital with pneumonia from COVID-19 needed ICU care for respiratory support.
_
Frightening Hypoxemia (low oxygen levels):
First of all, almost all of severe patients present with frighteningly low oxygen levels. Normal oxygen levels are anything above SpO2 95%, and patients come with levels as low as the 70% and some patients present to hospital with oxygen levels in the 50s and even lower. What’s more perplexing, sometimes these patients have oxygen levels that low and have absolutely no symptoms.
Frighteningly Quick Deterioration:
Secondly, when these patients with COVID-19 crash, they crash very quickly and crash very hard. Each patient is a ticking time-bomb, and they could be doing fine for several hours, and then — suddenly — they are gasping for air with plummeting oxygen levels and a plummeting blood pressure. Despite getting multiple interventions, including going on a ventilator, they suffer cardiac arrest and die.
This disease is unlike anything doctors have ever seen. COVID-19 has confounded critical care specialists the world over. It has upended decades of critical care gospel, and it has left very smart clinicians, scientists, researchers and regular bedside doctors — scratching their heads. Each patient acts differently to the virus, and we need to treat each patient differently. What works for one, may not work for another, and this is different than what we have been used to.
Not every patient needs a ventilator right away. Early on, clinicians taking care patients with COVID-19 were recommending “early intubation,” which means placing patients on a ventilator if conventional oxygen treatment did not work. They were not wrong. At the same time, we have learned that some patients can avoid going on a ventilator if we can treat them with high amounts of oxygen with high flow rates. We have had great success using this treatment modality in keeping multiple patients from requiring a ventilator. In addition, we have found that, if patients can lie on their stomach themselves, this has helped many of them avoid having to go on a ventilator. A lot of research is being conducted on this treatment, but we have found good success with it in patients. While a ventilator can be life-saving, and you would not hesitate to use it on any patient who can’t breathe, it can also damage the lungs, and it is important to try everything in our arsenal first before we place someone on a ventilator. Indeed, multiple guidelines have now come out saying the same thing.
We need to aggressively correct any dehydration. It has long been a teaching that the patients with the severe lung disease called ARDS, or Acute Respiratory Distress Syndrome, need to get as little fluids as possible. This is appropriate, because too much fluid in the body can cause the lungs to fill up with fluids and make the respiratory failure worse. At the same time, patients with COVID-19 typically come into the hospital and ICU very dehydrated. They have had fevers for several days, which causes dehydration itself, and they are not really eating and drinking (because they are sick). So, if we do not give them fluids, we are setting them up for kidney failure. As a result, you have to be more liberal with fluids — all while not giving too much — and you can prevent kidney failure.
_
As doctors learn more about treating Covid-19, and question old dogma about blood oxygen and the need for ventilators, they might be able to substitute simpler and more widely available devices. An oxygen saturation rate below 93% (normal is 95% to 100%) has long been taken as a sign of potential hypoxia and impending organ damage. Before Covid-19, when the oxygen level dropped below this threshold, physicians supported their patients’ breathing with noninvasive devices such as continuous positive airway pressure (CPAP, the sleep apnea device) and bilevel positive airway pressure ventilators (BiPAP). Both work via a tube into a face mask. In severe pneumonia or acute respiratory distress unrelated to Covid-19, or if the noninvasive devices don’t boost oxygen levels enough, critical care doctors turn to mechanical ventilators that push oxygen into the lungs at a preset rate and force: A physician threads a 10-inch plastic tube down a patient’s throat and into the lungs, attaches it to the ventilator, and administers heavy and long-lasting sedation so the patient can’t fight the sensation of being unable to breathe on his own. But because in some patients with Covid-19, blood-oxygen levels fall to hardly-ever-seen levels, into the 70s and even lower, physicians were intubating them sooner. Data from China suggested that early intubation would keep Covid-19 patients’ heart, liver, and kidneys from failing due to hypoxia. This had been the whole thing driving decisions about breathing support: Knock them out and put them on a ventilator.
However, now many physicians are starting simple. Most hospitals are using simpler, noninvasive strategies first including the apnea devices and even nasal cannulas. It doesn’t require sedation and the patient [remains conscious and] can participate in his care. But if the oxygen saturation gets too low you can achieve more oxygen delivery with a mechanical ventilator. The question is whether ICU physicians were moving patients to mechanical ventilators too quickly. Almost the entire decision tree is driven by oxygen saturation levels. In patients who are on ventilators due to non-Covid-19 pneumonia or acute respiratory distress, a blood oxygen level in the 80s can mean impending death, with no room to give noninvasive breathing support more time to work. Physicians were using their experience with ventilators in those situations to guide their care for Covid-19 patients. The problem is that because physicians had never seen Covid-19 before, they based clinical decisions on conditions that may not be good guides. This is entirely new disease making ventilator protocols developed for other conditions less than ideal.
_
Some doctors are questioning the way ventilators are being used for people with serious cases of COVID-19. Doctors and scientists studying the mortality rate of COVID-19 patients on mechanical ventilators say the available data is tricky to assess. Some studies put the death rate for coronavirus patients put on ventilators as low as 25%. But many reports much higher rates, ranging anywhere from about 50% to as high as 98% in one instance. For example, in a UK study of 98 COVID-19 patients who received “advanced respiratory support,” which included invasive ventilation and tracheostomy, 66% died, according to the nation’s Intensive Care National Audit and Research Center (ICNARC). New York City hospitals have reported an even higher COVID-19 ventilator death rate. Roughly 80% or more of patients placed on ventilators there have died. The agency reports that typically only about 40% to 50% of patients on ventilators for non-COVID-19-related lung problems die. The percentage is high compared with the prognosis for some other medical procedures because, in general, doctors hold off on administering invasive ventilation until it is medically necessary, which means the illness is already quite serious before intubation.
What’s more, doctors noticed disturbing patterns they had never seen before. COVID-19 patients on ventilators sometimes showed extremely low blood-oxygen concentrations during ventilation. Despite doctors’ best efforts, they reported seeing concentrations of oxygen in blood at 10% to 20%, and sometimes even lower. Though data continue to emerge, some doctors feel enough already exists to justify new approaches to treating the most serious COVID-19 cases.
_
Proposing ‘Oxygen First’ Strategy:
If you think of the lungs as a balloon, typically when people have ARDS or pneumonia, the balloon gets thicker. So not only do you lack oxygen, but the pressure and the work to blow up the balloon becomes greater. So one’s respiratory muscles become tired as they struggle to breathe. And patients need pressure. But if the balloon is not actually thicker but thinner, so they’d suffer from a lack of oxygen. But it is not that they suffer from too much work to blow up the balloon. In other words, some COVID-19 patients have little trouble “blowing up the balloon” of their lungs, yet still suffer from low oxygen. For patients of COVID-19 who show these symptoms, you can apply an “oxygen first” treatment method. This means getting patients’ blood-oxygen levels as high as possible, and doing so using the lowest air pressure possible.
Many studies have confirmed that high-flow nasal cannula (HFNC) can reduce the endotracheal intubation rate and mortality in patients with respiratory failure. However, this therapy of COVID-19 cannot improve the pathophysiology of ventilation-perfusion defects and atelectasis, which can be proved by autopsies, i.e., small airways are blocked by mucus plugs. Awake prone position could improve the mismatch of ventilation-perfusion and open the atelectatic lungs by adequate sputum drainage. A study found that awake prone position combined with HFNC therapy could be used safely and effectively in severe COVID-19 patients, and it may reduce the conversion to critical illness and the need for tracheal intubation.
_
In Non-intubated COVID-19 Patients, Tolerating the Prone Position may be associated with Better Outcomes:
Patients with novel coronavirus disease (COVID-19) who can tolerate the prone position may have better outcomes, according to two small studies in JAMA. The first included 24 COVID-19 patients in France who were receiving oxygen supplementation for hypoxemic acute respiratory failure. All patients were awake, non-intubated, and breathing spontaneously. Overall, 17% did not tolerate prone positioning for more than an hour, 21% tolerated it for 1–3 hours, and the remainder tolerated it for over 3 hours. One quarter of all patients responded to prone positioning — that is, they experienced at least a 20% increase in partial pressure of arterial oxygen (PaO2) during pronation. Of these six, just half maintained this response after resupination. Overall, at 10 days, five patients required invasive ventilation; four were those who had not tolerated prone positioning for more than an hour. In the second study, conducted in Italy, 15 patients received noninvasive ventilation in the prone position outside the ICU for roughly 3 hours. All patients experienced a reduction in respiratory rate during and after pronation, relative to baseline. All patients also had improved oxygenation during pronation, and most did so after pronation as well. At 14 days, one patient had been intubated and one had died.
_
The prone position can improve oxygenation and can potentially result in less injurious ventilation. Because of a higher density of pulmonary vessels in the dorsal lung region (independently of gravity), the change of ventilation distribution while prone (i.e., relative increase in ventilation in the dorsal nondependent areas) results in improved V̇/Q̇ matching and oxygenation. Prone position during invasive mechanical ventilation improved oxygenation in large randomized clinical trials (RCTs) of patients with ARDS. However, better oxygenation was not associated with improved survival in trials with short duration of prone positioning. The prone position during spontaneous and assisted breathing in patients with acute hypoxemic respiratory failure may become a therapeutic intervention in the near future.
____
____
Final thoughts:
- The dominant mode of transmission is through respiratory droplets and aerosols especially by asymptomatic infected individuals, so everybody wearing masks in public places is essential to control spread of covid-19.
- Close and prolonged contact is required for transmission. The risk of transmission is therefore highest within the house, enclosed congregations and public transport. The chances of getting infected through short interaction are low.
- Elderly and people with pre-existing diseases are most at risk of death. Therefore, reducing their exposure will reduce deaths significantly.
- Lastly, the death rate is much lower than earlier estimated. It is likely below 0.26 % worldwide, which is far lower than deaths due to other coronaviruses that caused diseases like SARS and MERS.
From this new understanding, Covid-19 is not as dangerous as we thought before. Please don’t misunderstand; this is still a horrible disease, and we need to take all the necessary precautions. However, these final thoughts show us a path to reopen the economy.
______
______
Moral of the story:
_
- Viruses are the most abundant biological entities on the planet and there are an estimated 1031 viruses on earth. As obligate intracellular parasites, viruses must invade host cells to initiate infection whether in cultured tissues or in the body of the host. Infections in humans normally require extensive viral replication in order to be detected due to the limited sensitivity of diagnostic methods.
_
- COVID-19 is the respiratory disease caused by the SARS-CoV-2 virus that has caused outbreaks worldwide. SARS-CoV-2 belongs to the betacoronavirus genus, which includes the SARS-CoV coronavirus, MERS coronavirus, and two other human coronaviruses, HCoV-OC43 and HCoV-HKU1. The SARS-CoV and MERS coronaviruses cause severe illness with approximate case fatality rates of 9 and 36% respectively, but the transmission of both has remained limited. HCoV-OC43 and HCoV-HKU1 infections may be asymptomatic or associated with mild to moderate upper respiratory tract illness; these HCoVs are considered the second most common cause of the common cold. The betacoronaviruses can induce immune responses against one another: SARS-CoV infection can generate neutralizing antibodies against HCoV-OC43 and HCoV-OC43 infection can generate cross-reactive antibodies against SARS-CoV.
_
- Surveillance of coronaviruses in wild animals has led to the discovery of diversity of coronaviruses in bat and avian species, which suggests that these animals are the natural reservoirs of the viruses. All HCoVs have a zoonotic origin. Whereas bats are the evolutionary reservoir host of 229E, NL63, SARS-CoV, MERS-CoV, and SARS-CoV-2, parental viruses of OC43 and HKU1 have been found in rodents. Coronaviruses are naturally hosted and evolutionarily shaped by bats. Indeed, it has been postulated that most of the coronaviruses in humans are derived from the bat reservoir.
The natural host of SARS-CoV-2 may be the bat Rhinolophus affinis as SARS-CoV-2 showed 96.2% of whole-genome identity to Bat CoV RaTG13; and is not very similar to the genomes of SARS-CoV (about 79%) or MERS-CoV (about 50%). However, SARS-CoV-2 and Bat CoV RaTG13 differ significantly in their receptor-binding domains (RBD) in the spike (S) proteins. Although RaTG13 bat virus remains the closest to SARS-CoV-2 across the genome, some pangolin coronaviruses exhibit strong similarity to SARS-CoV-2 in the RBD, including all six key RBD residues. So pangolins may have provided a partial spike gene to SARS-CoV-2. In other words, through mutation or recombination, SARS-CoV-2 evolved from bat and pangolin corona viruses.
_
- The receptor-binding domain (RBD) in the spike protein is the most variable part of the coronavirus genome. The exact contours of SARS-CoV-2’s spikes allow it to stick far more strongly to ACE2 than SARS-classic did, and it’s likely that this is really crucial for person-to-person transmission. The spike protein which helps SARS-CoV-2 bind to ACE2 has undergone several mutations that has increased its affinity to the human ACE2 by nearly 10-15 times compared to SARS-CoV S-protein, making it highly infectious. The second notable feature of SARS-CoV-2 is a polybasic cleavage site at the junction of S1 and S2, the two subunits of the spike protein (S). Coronavirus spikes consist of two connected halves, and the spike activates when those halves are separated; only then can the virus enter a host cell as S1 and S2 separation leads to fusion of the viral and cellular membranes. In SARS-classic, this separation happens with some difficulty. But in SARS-CoV-2, the bridge that connects the two halves can be easily cut by an enzyme called furin, which is made by human cells and—crucially—is found across many tissues. This is probably important for some of the really unusual things we see in this virus. For example, most respiratory viruses tend to infect either the upper or lower airways. In general, an upper-respiratory infection spreads more easily, but tends to be milder, while a lower-respiratory infection is harder to transmit, but is more severe. SARS-CoV-2 seems to infect both upper and lower airways, perhaps because it can exploit the ubiquitous furin. This double whammy could also conceivably explain why the virus can spread between people before symptoms show up—a trait that has made it so difficult to control. Perhaps it transmits while still confined to the upper airways, before making its way deeper and causing severe symptoms.
_
- Notable SARS-CoV-2 features including the optimized RBD and polybasic cleavage site are observed in related coronaviruses in nature and SARS-CoV-2 acquired these via recombination or mutation. Pangolin coronaviruses exhibit strong similarity to SARS-CoV-2 in the RBD, including all six key RBD residues. This clearly shows that the SARS-CoV-2 spike protein optimized for binding to human-like ACE2 is the result of natural selection. The evidence for natural evolution was supported by data on SARS-CoV-2’s backbone — its overall molecular structure. If someone were seeking to engineer a new coronavirus as a pathogen, they would have constructed it from the backbone of a virus known to cause illness. But scientists found that the SARS-CoV-2 backbone differed substantially from those of already known coronaviruses and mostly resembled related viruses found in bats and pangolins. The novel coronavirus contains genetic features that suggest it encountered a living immune system rather than being cultivated in a petri dish. All these suggest that SARS-CoV-2 is not the product of purposeful manipulation. Overall, the analysis suggests the virus jumped from animal to humans sometime in November 2019. The genomic sequences of SARS-CoV-2 viruses isolated from a number of patients share sequence identity higher than 99.9%, suggesting a very recent host shift into humans.
_
- Mutations enable viruses to escape host immunity and to develop drug resistance. Over the length of its 30,000-base-pair genome, SARS-CoV-2 seems to have a mutation rate of less than 25 mutations per year, whereas the seasonal flu has a mutation rate of almost 50 mutations per year. Given that the SARS-CoV-2 genome is almost twice as large as the seasonal flu genome, it seems as though the seasonal flu mutates roughly four times as fast as SARS-CoV-2. The significantly slower mutation rate of SARS-CoV-2 gives us hope for the potential development of effective long-lasting vaccines against the virus.
_
- There aren’t really different strains of SARS CoV-2. A strain is a genetic variant characterised by different forms of surface proteins. The virus mutates so slowly that the so-called virus strains are fundamentally very similar to each other and mutations are referred as strains. The SARS-CoV-2 is so good at transmitting itself between human hosts that it is under no evolutionary pressure to evolve.
_
- For COVID-19, viral load means how many viral genomes are detected in a nasopharyngeal swab from the patient. Viral load also means number of viral genomes in tissues and body fluids. The viral load reflects how well a virus is replicating in an infected person. SARS-CoV-2 has been detected in upper and lower respiratory tract samples from patients. High viral loads and successful virus isolation from early throat swabs (in first week of symptoms) suggested potential virus replication in upper respiratory tract tissues. Therefore, virus transmission via respiratory secretions in the form of droplets (>5 microns) or aerosols (<5 microns) appears to be likely. Viral loads detected in asymptomatic patients are moderate suggesting that transmission of the virus is possible regardless of the presence of symptoms. These findings not only confirm the contagious nature of asymptomatic patients but help to explain SARS-CoV-2 high rates of transmissibility.
The more virus you possess (increased viral load in tissues like lungs), the more you shed and the more virus you shed, the more likely you are to infect others. Patients with severe COVID-19 shed virus longer and in higher copy numbers.
_
- SARS-CoV-2 virus can be detected 2-3 days prior to symptom onset in upper respiratory tract samples, and the virus can persist for about 20 days in most cases; it is detectable until death in non-survivors.
_
- About 25 to 30 % people infected with SARS-CoV-2 are asymptomatic. The phenomenon of asymptomatic transmission is a puzzling feature of the virus that’s allowed the pandemic to spread wider and faster than previous outbreaks as the transmission of SARS-CoV-2 from these people to susceptible groups would be difficult to prevent. The number of people infected with SARS-CoV-2 is underestimated as published numbers typically only include confirmed diagnoses — most of which represent individuals showing moderate to severe symptoms. Therefore, the mortality rate of the infection is actually much lower than the official diagnosed case data would suggest.
_
- Not all people exposed to SARS-CoV-2 are infected and not all infected patients develop severe respiratory illness. The symptomatic secondary attack rate is 0.45 to 0.55 percent among close contacts of confirmed patients; and among household members, the rate is 5 to 10 percent. The risk of transmission with more indirect contact (e.g., passing someone with infection on the street, handling items that were previously handled by someone with infection) is not well established and is likely low. Close and prolonged contact is required for transmission. The risk of transmission is therefore highest within the house, enclosed congregations and public transport. The chances of getting infected through short interaction are low.
_
- On the basis of previous work on SARS and MERS coronaviruses, we know that exposure to initial higher doses are associated with a worse outcome and this may be likely in the case of Covid-19 as well. That means that health care workers that care for Covid-19 patients are at a particularly high risk as they are more likely to be exposed to a higher number of viral particles, particularly when there is a lack of personal protective equipment (PPE).
_
- Because of a longer incubation period, more asymptomatic spread, and a higher reproductive number (baseline R0 between 2 and 3), COVID-19 appears to spread more easily than influenza. School closure, a major pillar of the response to pandemic influenza A, is unlikely to be effective for Covid-19 given very low rate of infection among children.
_
- The pandemic and post-pandemic transmission dynamics of SARS-CoV-2 will depend on factors including the degree of seasonal variation in transmission, the duration of immunity, the degree of cross-immunity between SARS-CoV-2 and other coronaviruses, as well as the intensity and timing of control measures.
_
- Viruses do not replicate outside living cell but infectious virus may persist on contaminated environmental surfaces and the duration of persistence of viable virus is affected by ambient temperature, relative humidity, and the size of the initial inoculum. SARS-CoV-2 is viable for few hours to few days on different surfaces (copper 4 hours and plastic 3 days). Data on the transmissibility of coronaviruses from contaminated surfaces to hands are not found. However, it could be shown with influenza A virus that a contact of 5 second can transfer 31.6% of the viral load to the hands.
_
- The environmental stability of SARS-CoV-2 is similar to that of SARS-CoV; therefore differences in the epidemiologic characteristics of these viruses probably arise from other factors, including high viral loads in the upper respiratory tract of SARS-CoV-2 and the potential for persons infected with SARS-CoV-2 to shed and transmit the virus while asymptomatic.
_
- Soapy water is better than alcohol-based sanitizer for disinfecting hands of SARS-CoV-2.
_
- SARS-CoV-2 can pass from one individual to another through exhaled droplets & aerosols, contamination of surfaces, and possibly through faecal-oral contamination.
_
- Airborne transmission result in large clusters of infection in a short period, vividly demonstrated by Covid-19. Since SARS-CoV-2 spreads through aerosols besides other routes, measure to limit aerosol transmission must be put in practice; e.g. room ventilation, avoiding air recirculation, open space, sanitization of protective apparel, proper use & disinfection of various surface areas and minimizing the number of people sharing the same environment. I keep windows of my clinic room open and use fan to disperse aerosols if any.
_
- Scientists have identified genes for as many as 29 proteins, which carry out a range of jobs from making copies of the coronavirus to suppressing the body’s immune responses. Coronaviruses are particularly adapted to evade immune detection and dampen human immune responses. This partly explains why they tend to have a longer incubation period, 2-11 days on average compared to influenza, 1-4 days. The longer incubation period is probably due to their immune evasion properties, efficiently escaping host immune detection at the early stage of infection.
_
- Whether someone infected with SARS-CoV-2 develops asymptomatic infection, mild pneumonia or overwhelming acute respiratory distress syndrome with concurrent fulminant sepsis does not depend on variation caused by genomic changes in the virus but by host factors like age and degree of lymphocytopenia and the number of CD3, CD4, and CD8 T cells. Both age and lymphocytopenia & number of CD3, CD4, and CD8 T cells correlate with dysfunctional immune response. In other words, it is not the virus and its genetic variations that determine severity of illness but host immune response.
The people that do the worst, the ones where it leads to death, almost invariably will have exaggerated host response — the cytokine storm. The elderly and immunocompromised are particularly vulnerable to this type of response as their underactive immune system suddenly kicks into hyperdrive and becomes overactive. Interestingly the people who have the most suppressed immune responses seem to develop the most aberrant immune responses in the later stages of disease.
_
- The definitive test for SARS-CoV-2 is the real-time reverse transcription polymerase chain reaction (RT-PCR). RT-PCR remains the gold standard for diagnosing COVID-19, performed on specimen from respiratory tract. While its specificity is nearly 100 % from having no reported false positive cases or cross-reactivity with other viruses or estranged oligonucleotides, the sensitivity is as low as 60-70%. Studies have started performing two sequential RT-PCRs to ensure true negative cases. RT-PCR tends to present negative-to-positive at a mean of 5.1 days, and positive-to-negative at 6.9 days. The low sensitivity of RT-PCR may be from immature technology, variation of detection by manufacturers, low initial viral load, duration of illness at the time of testing and improper sampling. As expected, the asymptomatic, patients in the incubation period and those in the early stage of the disease have lower viral loads leading to false negative. False negative results can have devastating impacts on the current efforts to contain the SARS-CoV-2 outbreak as infected patients are mistakenly given the green light to return home, return to work and possibly infecting others.
_
- Pharyngeal swabs are widely used to determine the appropriateness of a patient’s discharge from the hospital and whether isolation continues to be required. However positive RT-PCR results for SARS–CoV-2 in sputum or feces after pharyngeal swabs became negative occurs commonly. These finding raise concern about whether patients with negative pharyngeal swabs are truly virus-free, or sampling of additional body sites is needed.
_
- Novel corona virus is consistently detected in saliva. There are several advantages in using saliva specimens for the diagnosis of SARS-CoV-2 instead of nasopharyngeal swab. First, saliva specimens can be provided by the patient easily without any invasive procedures. Therefore, the use of saliva specimens could reduce the risk of nosocomial SARS-CoV-2 transmission. Second, the use of saliva will allow specimen collection outside the hospitals where airborne-infection isolation rooms are not available, such as in outpatient clinics or in the community. Third, since healthcare workers are not required to collect saliva specimens, the use of saliva specimens will eliminate the waiting time for specimen collection, and hence the results would be available much sooner. Saliva is preferable to deep nasopharyngeal swabs for COVID-19 Testing.
_
- With RT-PCR as a reference, the diagnostic sensitivity of Chest CT imaging for COVID-19 is 97%. The needs of large number of people for RT-PCR test cannot be met due to shortages in test kit and it has 30% false negative results, so chest CT should be done in symptomatic patients when initial RT-PCR is negative or unavailable. Chest CT can decrease the chance of false-negative results in the RT-PCR assay. Chest CT is more sensitive than initial RT-PCR (98% vs. 71%, and 88% vs. 59%) according to two recent reports.
_
- Detection of IgM and IgG antibodies produced in response to SARS-CoV-2 infection can be used both for diagnosis and population surveillance. An accurate mortality rate of the disease and the level of herd immunity in the population can also be determined from the results of this test. Because of their scalability, serological assays can be used in large-scale, whole-population, testing to assess the overall immune response to the virus and identify asymptomatic carriers of the virus. The accuracy of antibodies test is sometimes as low as 20–30%. Not only do they miss infections, but most tests “detect” antibodies in some people who don’t have infection. Therefore, laboratory tests that detect antibodies to SARS-CoV-2 need further validation to determine their accuracy and reliability. The IgM/IgG serological assays are designed to complement RT-PCR in the diagnosis of SARS-CoV-2 infections and not replace it. A serologic test for antibodies against the SARS-COV-2 nucleocapsid protein shows optimal specificity and sensitivity at day 14 after symptom onset. Whether presence of antibodies to SARS-CoV-2 confers immunity to subsequent infection by this virus in humans is unclear.
_
- There is a difference between infectivity and detectability of virus. Viral RNA detection does not necessarily indicate the presence of infectious virus, be it surface, fluid or air. RT-PCR detects viral RNA but cannot determine viability of virus. Isolation of virus in virus culture is needed to show the infectivity of the virus. Another proof of viral replication is to conduct RT-PCR tests to identify viral subgenomic messenger RNAs (sgRNA) directly in clinical samples. Viral sgRNA is only transcribed in infected cells and is not packaged into virions, therefore indicating the presence of actively infected cells in samples.
Detectable viral RNA does not always correlate with isolation of infectious virus, and there may be a threshold of viral RNA level below which infectivity is unlikely. In a study with mild COVID-19, infectious virus was not detected from respiratory specimens when the viral RNA level was <106 copies/ml. In another study, all PCR-positive samples with cycle threshold (Ct) values between 13 and 17 were also culture-positive. Rates of positive cultures from specimens with higher Ct values (i.e., lower viral RNA copies/ml) decreased progressively and none of samples with Ct of 34 or higher was culture-positive.
_
- Many reports suggested that discharged patients (as many as 14%) tested positive after recovery. Relapse or reinfection are unlikely. One explanation then, is that patients were simply not fully recovered despite meeting discharge criteria. Another could be attributed to the “false negative” RT-PCR test results before their discharge. It could also be that patients are testing positive after recovery because RT-PCR picked up viral RNA that has already been inactivated i.e. non-viable virus. Non-viable virus particles are not infectious.
_
- Testing is our window onto the pandemic and how it is spreading. Without testing we have no way of understanding the pandemic. Tests allow us to identify infected individuals and enables isolation & treatment of those infected, and the tracing and quarantining of their contacts. Without data on COVID-19 we cannot possibly understand how the pandemic is progressing. Without data we cannot respond appropriately to the threat; neither as individuals nor as a society. Nor can we learn where countermeasures against the pandemic are working.
Testing coverage means tests per thousand people. It gives indication of testing relative to population size. The number of tests per confirmed case gives indication of testing relative to the size of the outbreak. A country that performs very few tests for each case it confirms is not testing widely enough for the number of confirmed cases to paint a reliable picture of the true spread of the virus despite having high testing coverage. When the number of confirmed cases looks low against the number of deaths, it is clear indication that the true number of cases is likely to be much, much higher due to limited extent of testing.
_
- Age is a risk factor for severe disease and death. The chance of death in confirmed COVID-19 cases is more than 13% for patients 80 years and older, compared to about 0.15% for patients in their 30s, and virtually 0% for patients under 20. The average age of those who have died from COVID-19 in Italy is 80.3 years old, and men are much more likely to die of it than women. Patients who develop serious or fatal COVID-19 are disproportionately likely to have at least one major underlying health condition, such as diabetes, hypertension, obesity, cardiovascular disease and chronic obstructive pulmonary disorder. Individual differences in genetic makeup may explain variable susceptibility to the novel coronavirus and the severity of the disease it causes in different people having same age and comorbidities.
_
- Machine learning tools selected three biomarkers that predict the mortality of individual patients more than 10 days in advance with more than 90% accuracy: high levels of lactic dehydrogenase (LDH), low lymphocyte count and high levels of high-sensitivity C-reactive protein (hs-CRP).
_
- Children seem to be relatively unaffected by this virus and large cohort studies report that 1-2% of COVID-19 patients are children. Epidemiological evidences show that SARS-CoV-2 infection in children is less frequent and less severe than adults. Most children with COVID-19 present with mild symptoms, if any, generally require supportive care only, and typically have a good prognosis and recover within 1 to 2 weeks. Lower ACE2 expression in nasal epithelium in children relative to adults, fewer chronic cardiovascular and respiratory conditions and inability to mount cytokine storms may be the reasons why SARS-CoV-2 seem to affect children differently.
_
- Angiotensin-converting enzyme 2 (ACE2) is the receptor for SARS CoV-2 entry in the host. Since patients with hypertension and diabetes mellitus have higher expression levels of ACE-2, and given that the same patient populations tend to have more severe COVID-19 phenotypes, it has been hypothesized that higher ACE-2 levels could potentially augment viral entry. Since treatment with ACE inhibitors and ARBs further increases ACE2 expression as per animal studies, the increased expression of ACE2 could facilitate infection with COVID-19. Researchers therefore hypothesized that diabetes and hypertension treatment with ACE2-stimulating drugs increases the risk of developing severe and fatal COVID-19. Some hypothesized that decreasing the levels of ACE2 in cells might help in fighting the infection, therefore proposed discontinuation of ACE inhibitors and angiotensin-receptor blockers (ARBs), both prophylactically and in the context of suspected Covid-19.
However, ACE2 has been shown to have a protective effect against virus-induced lung injury by increasing the production of the vasodilator and anti-inflammatory angiotensin 1–7, therefore, increased expression of ACE2 appears to be protective against acute lung injury. SARS-CoV-2 appears not only to gain initial entry through ACE2 but also to subsequently down-regulate ACE2 expression such that the enzyme is unable to exert protective effects in organs and unabated angiotensin II activity may be in part responsible for organ injury in Covid-19.
Covid-19 is particularly severe in patients with underlying cardiovascular diseases, and in many of these patients, active myocardial injury, myocardial stress, and cardiomyopathy develop during the course of illness. RAAS inhibitors (ACE inhibitors and ARBs) have established benefits in protecting the kidney and myocardium, and their withdrawal may risk clinical decompensation in high-risk patients.
Currently, almost all professional societies and regulatory bodies have recommended continuing standard ACE inhibitor and ARB therapy in patients with hypertension, diabetes and cardiovascular disease except for clinical reasons other than Covid-19.
Several studies do not provide evidence to support the hypothesis that ACE inhibitor or ARB use is associated with the risk of SARS-CoV-2 infection, the risk of severe Covid-19 among those infected, or the risk of in-hospital death among those with a positive test. In fact, there is evidence to show benefit rather than harm of RAAS blockers in Covid-19. Some studies have proposed angiotensin receptor blockers as tentative covid-19 therapeutic.
_
- In the absence of a known efficient therapy and because of the situation of a public-health emergency, it made sense to investigate the possible effect of hydroxychloroquine against SARS-CoV-2 since this molecule was previously described as a potent inhibitor of most coronaviruses, including SARS-CoV as well as many other RNA viruses. However, current data do not support the use of hydroxychloroquine for prophylaxis or treatment of Covid-19. Hydroxychloroquine is ineffective in the management of even mild COVID-19 disease. In fact, some studies showed increased mortality in patients receiving hydroxychloroquine. The advocacy and widespread use of hydroxychloroquine seem to reflect a reasonable fear of SARS-CoV-2 infection. Standards of the most discerning medical journals are eroding as they face pressure to rapidly vet and disseminate new scientific reports. It appears that to some extent the media and the political forces — rather than medical evidence — are driving clinical decisions and the global Covid-19 research agenda. We need multiple, large sample, prospective, randomized, controlled trials of hydroxychloroquine in patients with Covid-19 showing unequivocal benefit to advocate its use in treatment of Covid-19 worldwide.
_
- Patients are coming in hypoxia (SpO2 75% or less) without dyspnoea. As doctors learn more about treating Covid-19, and question old dogma about blood oxygen and the need for ventilators, they might be able to substitute simpler and more widely available devices. Oxygen therapy with high flow nasal canula in awake prone position can be used safely and effectively in severe Covid-19 patients, and it may reduce the conversion to critical illness and the need for tracheal intubation & mechanical ventilation.
_
- The greater the time the virus remains stable in the environment, the greater its capacity to infect other people and become epidemic. While SARS-Cov-2 has quickly spread all over the world, the major outbreaks have mainly occurred in places exposed to cool and dry weather. Both SARS-CoV and SARS-CoV-2 epidemics occurred in cold dry winter seasons celebrated with major holidays, and started in regions where dietary consumption of wildlife is a fashion. Cold temperature and low humidity might provide favorable environmental conditions for prolonged viral survival in these regions. Many developing nations with hot climates and young populations have escaped the worst, suggesting that temperature and demographics could be factors.
When humidity is lower, the air is drier and it makes the aerosols smaller. When you sneeze and cough those smaller infectious aerosols can stay suspended in the air for longer and travel farther. That increases the exposure for other people. When the air is humid and the aerosols are larger and heavier, they fall and hit surfaces quicker. In other words, lower humidity increases viral transmission. On the other hand, once the droplets carrying the virus evaporate, the residual virus dies quickly, so survival and transmission of SARS-CoV-2 is directly impacted by how long the droplets remain intact. Lower the humidity greater the chance of drying up of droplet and lesser the transmission. In nutshell, it is the temperature that is the final arbiter of viral survival irrespective of humidity higher or lower. Higher ambient temperature dries out the droplet faster and drastically reduce the chances of virus survival.
SARS-CoV-2 is a novel virus and no one in the world has any immunity against it except those who were infected with human seasonal corona virus recently. So although high temperature of summer could reduce its transmissibility, it is not enough to shut off transmission as there are enough susceptible people to sustain direct person to person transmission. Therefore reduction in transmission efficiency may not lead to a significant reduction in disease spread without the concomitant adoption of major public health interventions. Also, in the pandemic stage of an emerging pathogen, the weather drives only modest changes to pandemic size. Since Covid-19 has baseline R0 of 2–3, the warm months of summer might not necessarily reduce transmission below the value of unity as they do for influenza A, which typically has baseline R0 of around 1.4-2.
All said and done, to say that weather has no effect on Covid-19 is completely wrong.
_
- SARS-CoV-2 RNA consists of about 30,000 genetic bases or letters and it mutates about twice a month. These minor mutations tend not to change the potency of the virus. But they provide clues for genetic detectives to chart how they shift subtly over time, allowing them to create sprawling “family” trees, or phylogenies, that show how the coronavirus has spread from one part of the world or country to the next and, most important, detecting early signs of infection clusters. This genome analytic approach relies on tracking how viruses mutate over time as they spread from person to person. This genome work differs markedly from traditional epidemiology that focuses heavily on identifying infected patients and tracking all their contacts. Instead of talking to people about who they have been in contact with and shoe-leather epidemiology, researchers use the genetics of pathogens to see how they are spreading and how they are transmitting around the world. Changes in the pathogen help scientists follow cases without widespread testing. Researchers say their methods could be used to help identify undocumented infection sources; for example, people could unknowingly be spreading the coronavirus if they had a mild case and didn’t seek care, or if they had been missed by traditional surveillance because they weren’t tested. These “phylogenetic” methods could be applied to the very latest coronavirus genome sequencing to help predict future global hot spots of disease transmission and surge. Also, in places where testing and case-based surveillance are limited, genetic data will continue to provide clues about whether all these social distancing interventions are working.
Genome data analysis are limited by the amount of genome data that is available, and although the phylogenetic tree might suggest a connection, there are so many missing pieces in the transmission chain that there can be other explanations of what could have happened.
_
- Flattening the curve will not reduce the number of people who will become infected or even die from COVID-19. It is designed to keep it to levels that the health care system and society can handle. Flattening the curve prevents everyone from getting sick at once. The goal is not to eliminate coronavirus contagions. It’s to postpone them. The more we postpone cases, the better the healthcare system can function, the lower the mortality rate, and the higher the share of the population that will be vaccinated before it gets infected. Measures to flatten curve include interventions such as hand washing, social distancing, wearing masks, isolation, quarantine, encouraging working from home, closing schools and other institutions, placing hard limits on the size of crowds at events and disinfection.
Besides flattening curve, increasing healthcare capacity—called raising the line—such as by increasing bed count, personnel, and equipment, can help to meet increased demand. Approaches to increase critical care capacity have included rapid construction or repurposing of hospital facilities and consideration of increased manufacturing and distribution of ventilators.
_
- Strategies to control Covid-19 outbreak are mitigation and containment (suppression).
Mitigation strategy has aim of slowing down transmission but not necessarily stopping epidemic spread (reproduction number R0 not necessarily <1) with protection of more vulnerable groups and reducing the peak healthcare demand. Interventions in the mitigation strategy would be case isolation, quarantine of household contacts of a case and social distancing of the elderly (>70 years). Mitigation is making sure all the cases are identified, controlled, and isolated. It’s what Singapore, Hong Kong, Japan or Taiwan are doing so well: They very quickly limit people coming in, identify the sick, immediately isolate them, use heavy protective gear to protect their health workers, track all their contacts, quarantine them… This works extremely well when you’re prepared and you do it early on, and don’t need to grind your economy to a halt to make it happen.
Containment strategy has aim in which epidemic spread is reversed to reproduction number R0 <1. Containment requires heavy social distancing of all age groups. People need to stop hanging out to drop the transmission rate from the R0=2–3 that the virus follows without measures, to below 1, so that it eventually dies out. These measures require closing companies, shops, mass transit, schools, enforcing lockdowns…
In the mitigation strategy interventions have to be timely instituted to give chance for herd immunity to develop. With the containment strategy the more successful the interventions are applied the less possibility of herd immunity and hence another epidemic is expected later this year after relaxing the instituted interventions. Containment can be preferred but needs to be maintained for as long as the virus is circulating in the human population (or until a vaccine becomes available), as transmission otherwise quickly rebounds when measures are relaxed. Long-term containment to suppress the pandemic causes social and economic costs. Some studies concluded that the mitigation strategy, although associated with a herd immunity would result in overwhelming the healthcare system in both the UK and the USA and that it will never be able to completely protect those at risk from severe disease or death and the resulting mortality would therefore still be high. A combination of both containment and mitigation measures may be undertaken at the same time.
_
- Experience from China, Italy, and the United States demonstrates that COVID-19 can overwhelm even the healthcare capacities of well-resourced nations. The goal of social distancing is to reduce the peak intensity of the epidemic (“flatten the curve”), reducing the risk of overwhelming health systems and buying time to develop treatments and vaccines. For social distancing to have reversed the epidemic, the effective reproduction number must be declined by at least 50-60%, assuming a baseline R0 between 2 and 2.5. Social distancing measures may need to last for months to effectively control transmission and mitigate the possibility of resurgence.
Even in the absence of a widespread testing, social distancing, isolation, and sheltering-in-place can crush the exponential growth phase of an infectious disease. However, the problem is that even a small number of people who participate in large gatherings can infect enormous numbers of other people. The good actions of hundreds of infected individuals can all be undone by one infected individual — whether through malice or ignorance — who goes out in public and has close contact with a large number of others.
_
- Travel ban alone only delayed the spread of Covid-19 by 3–5 days. Therefore, travel ban must be paired with other measures to reduce transmission of virus.
_
- Quarantine measures alone reduce the number of people with the disease by 44% to 81%, and the number of deaths by 31% to 63%. Quarantine is most effective, and cost less, when it is started earlier. Combining quarantine with other prevention and control measures had a greater effect than quarantine alone.
_
- When social distancing is weak or based upon inaccurate knowledge, it may give a worse outcome than doing nothing.
_
- The measures taken by individual villages and communities to seal off roads are of no value. Such measures could result in civil unrest and reduce compliance with infection prevention and control advice.
_
- The 3-6 feet rule is based on a few studies from the 1930s and 1940s, which have since been shown to be wrong as droplets can travel farther than 6 feet, proved by many studies. Cochrane Systematic Review found insufficient evidence to support social distancing as a method to reduce spread of respiratory viruses during epidemics. It recommended frequent handwashing, gloves, gowns, masks and isolation of suspicious cases as effective interventions to reduce transmission of viral respiratory disease. A study found that with even a slight breeze of 4 kph, saliva travels 18 feet in 5 seconds. Another study found that the 6-feet social distancing policy may not be sufficient to protect the inter-person aerosol transmission, since the suspending micro-droplets are influenced by convection effects and can transport in the air farther than 3.05 m (10 feet) due to wind convection, causing a potential health risk to nearby people.
On the other hand, a meta-analysis in the Lancet found physical distancing of at least 1 meter (3.3 feet) is associated with lower risk for spread of coronaviruses. It also found that mask use was associated with a 60% reduced risk for infection, compared with no mask use.
I have seen that studies are conflicting in the management of Dengue. The best option is to use common sense and logic rather than puzzled by conflicting studies.
_
- Surgical face masks are made with non-woven fabric, which has better filtration and air permeability while remaining less slippery than woven cloth. The material most commonly used to make them is polypropylene, 20 or 25 grams per square meter (gsm) in density. Nonwoven fabrics are made of individual fibers or filaments that are bound together mechanically, thermally or chemically. They are not knit or woven together, like most cotton. The filters used in modern surgical masks and respirators are considered “fibrous” in nature—constructed from flat, nonwoven mats of fine fibers. Fiber diameter, porosity (the ratio of open space to fibers) and filter thickness all play a role in how well a filter collects particles. In all fibrous filters, three “mechanical” collection mechanisms operate to capture particles: inertial impaction, interception, and diffusion. In some fibrous filters constructed from charged fibers, an additional mechanism of electrostatic attraction also operates. Filters DO NOT act as sieves. The best mask is the one that has the highest filtration efficiency and lowest pressure drop. Fiber blend is used to balance filtration efficiency and pressure drop. Besides high filtration efficiency and low pressure drop, an important aspect of a facemask/respirator is how well it fits on the face and minimizes the degree of leakage around the facepiece. Studies have found that surgical masks appeared to be nearly as effective as N95 respirators to reduce transmission of not only seasonal coronaviruses, but also influenza. Masks should not be shared or reused. Surgical mask costs rupees 10 to16 per piece in India and need to replaced daily, so poor people cannot afford it.
_
- Lack of evidence on SARS-CoV-2 transmission dynamics has led to shifting isolation guidelines between airborne and droplet isolation precautions. Even when maximum containment policies were enforced, the rapid international spread of COVID-19 suggests that using arbitrary droplet size cut-offs may not accurately reflect what actually occurs with respiratory emissions. Recent work has demonstrated that exhalations, sneezes, and coughs not only consist droplets and aerosols following emission trajectories but, importantly, are primarily made of a multiphase turbulent gas cloud that entrains ambient air and traps and carries within it clusters of droplets with a continuum of droplet sizes. Moreover, throughout the trajectory, droplets of all sizes settle out or evaporate at rates that depend not only on their size, but also on the degree of turbulence and speed of the gas cloud, coupled with the properties of the ambient environment (temperature, humidity, and airflow).
Given various combinations of an individual patient’s physiology and environmental conditions, such as humidity and temperature, the gas cloud and its payload of pathogen-bearing droplets of all sizes can travel 23 to 27 feet (7-8 meter). So, 1 to 2-meter social distancing appear primitive. It may seem surprising that the current understanding of the routes of host-to-host transmission in respiratory infectious diseases are predicated on a model of disease transmission developed in the 1930s that, by modern standards, seems overly simplified and somewhat wrong. Implementing public health recommendations based on these older models may limit the effectiveness of the proposed interventions.
Even though we continue using dichotomy of large vs small droplets (aerosols) as routes of respiratory disease transmission, I am convinced that SARS-CoV-2 is transmitted by both droplets and aerosols. And aerosols are more dangerous than droplets as they can easily reach lower respiratory tract to cause severe Covid-19.
Depending on the design, masks can limit the spread of a disease from an infected person in what’s called source control, and/or they can protect the wearer from becoming infected. Masks can be worn to protect the wearer from getting infected or masks can be worn to protect others from being infected by the wearer. Protecting the wearer is difficult: It requires medical-grade respirator masks, a proper fit, and careful putting on and taking off. But masks can also be worn to prevent transmission to others, and this is their most important use for society. Luckily, blocking transmission outward at the source is much easier. It can be accomplished with something as simple as a cloth mask. Research shows that even a cotton mask dramatically reduces the number of virus particles emitted from our mouths — by as much as 99 percent except coughing violently. My mask protects you; your masks protect me. Even if 80 percent of people wear masks that are 60 percent effective, easily achievable with cloth, we can get to an effective R0 of less than one for Covid-19. When everybody wears masks, transmission probability is least. Even if only Covid-19 cases wear masks, probability of transmission is low but since asymptomatic and presymptomatic Covid-19 patients are more than 50% of total Covid-19 patients, and since we are mainly testing symptomatic patients, and since it is impossible to test everybody, and since 30% people will be false negative even if you test all covid patients, best option to control Covid-19 pandemic is wearing mask by everybody irrespective of social distancing. Wearing masks by everybody in public domain can prevent airborne transmission of SARS-CoV-2 but social distancing cannot prevent airborne transmission. In my view, when everyone wears masks in public spaces, social distancing becomes irrelevant. Wearing a mask by everybody protect everybody from droplet and airborne transmission compared to not wearing a mask; no matter surgical mask or cotton mask, and no matter distance between wearers. While cloth masks are sufficient for protecting others, people who are immunocompromised or elderly should wear surgical mask. Mask must be worn properly so that it comes all the way up, close to the bridge of nose, and all the way down under your chin, snugly fit around face without gaps. Of course, wearing mask must be paired with hand-washing.
_
- In the context of covid-19, lockdown is extreme social distancing of entire population, a containment strategy to control covid-19 outbreak which involves closing companies, shops, restaurants, theatres, mass transit, schools etc.; disallowing gathering of people at any event including religious prayers; and encouraging work & study from home. A key goal of such policies is to decrease the encounters between infected individuals and susceptible individuals and decelerate the rate of transmission. There is no doubt that lockdowns kept the numbers down but the issue is whether harms of lockdown are downplayed to justify lockdown. Instead of evidence-based policy, many governments have resorted to policy-based evidence to justify the lockdown. Those who ask for evidence to justify the biggest lockdown in history are shamed as wanting to kill grandparents. No government will be able to minimize both deaths from COVID19 and the economic impact of lockdown.
_
- As effective as lockdowns are, in countries lacking a strong social safety net and those where most people work in the informal economy, orders closing businesses and requiring people to shelter in place will be difficult to maintain for long. When people are forced to choose between social distancing and feeding their families, they are choosing the latter.
_
- India’s low numbers of cases and deaths compared to its population suggest Covid-19 was never a serious public health threat. The Indian government said that the total national lockdown has helped avert 54,000 deaths and 2 million cases of Covid-19. And since lives have no price on them, all this is worth it. The logic is sound. If lives are priceless, they’re worth saving at any cost. However, Indians have never really applied this principle when it comes to saving lives from causes other than Covid-19. For instance, 800,000 infants die every year due to lack of access to water, sanitation, proper nutrition and basic health services; and about 440,000 people die every year due to tuberculosis despite free treatment available to them. Tuberculosis is airborne and nobody talks about lockdown to save lives from tuberculosis. Alcohol and tobacco cause far more deaths than Covid-19 but nobody talks of lockdown of their manufacturing, supply and distribution networks.
_
- Indian total national lockdown to limit Covid-19 transmission has unintended consequences for the poorest and the most vulnerable. A major economic downturn and unemployment will lead to a rise in depression, suicide rates, domestic violence, crime and poverty. Those already poor will become extremely poor leading to malnutrition, stunted growth, illnesses and deaths. Lengthy lockdown could kill more people in poor country than the virus itself. Lockdown in poor countries cause them pick up the worst of both worlds — economic collapse without checking the virus. Countries with strong administrations and health systems could enforce social spacing, comprehensive testing, isolation and treatment. This could check the epidemic. But in poor countries with weak administrative and medical capacity, shutdowns would not check the disease. Social distancing is impossible in densely populated urban slums, crowded bazaars and huts where several people sleep. Virus testing capacity is weak, so detection, isolation and treatment are highly incomplete, and the disease would spread despite shutdowns. There is also possibility of civil unrest in some countries when they consider lockdown as was seen with Ebola. Lockdowns allow thriving autocratic systems under the pretence of controlling covid-19.
_
- Emergency department volume is down nearly 50% as the United States struggles with the Covid-19 epidemic. There is increasing evidence that patients with medical emergencies are avoiding the emergency department because of fear of contracting Covid-19, leading to increased morbidity and mortality. The entire medical system has shifted focus so overwhelmingly to Covid-19 that other diseases are being neglected. This attempt to check Covid-19 has unwittingly increased deaths from other causes.
_
- The long-term impacts of the lockdowns will be deadly for the world’s poorest billion people over the next decade. The number of people facing acute food insecurity could nearly double this year to 265 million due to the economic fallout of COVID-19 lockdowns. In low-income countries dominated by daily wage laborers working in the informal economy, people fear hunger may kill them before coronavirus. The United Nations estimates the global economic downturn could cause hundreds of thousands of additional child deaths in 2020. The lockdowns could push another half billion people into poverty worldwide.
_
- I am distressed by the plight of the 140 million migrant workers affected by Indian total national lockdown as they were forced to leave the cities where they worked at just a few hours’ notice, unable to pay for rent or food. Lacking jobs and money, and with public transportation shut down, millions of migrants who have no job security or protection, were forced to walk often hundreds of miles back to their home villages – with some dying on the journey.
_
- Lockdowns can’t last forever, and social distancing is against human nature. Almost all lockdown governments are now struggling with public justifications to declare victory and lift the lockdown. One big reason for the self-created exit trap is that the original mission of flattening the curve so the health system could cope with a slowed spread of the virus, has morphed into the more ambitious but impossible mission of eliminating the virus. If we do not find effective treatment; herd immunity through vaccination or exposure to virus is our only hope out of the Covid-19 crisis. However, whether vaccination or exposure to virus will provide lifelong immunity is uncertain. One-time lengthy lockdown will not bring pandemic under control in the absence of a vaccine, effective treatment or increased critical care capacity. In the absence of these, surveillance and wearing masks by everybody in public domain may need to be maintained up to 2022.
_
- Different countries have different Covid-19 transmission due to different demographics, culture, environment and the speed of government responses. Countries with the same culture and climate could have vastly different outcomes if one infected person attends a crowded social occasion, turning it into what researchers call a super-spreader event. There are some countries who do all the wrong things and still end up seemingly not as battered by the virus as one would expect and they are lucky. Remember, luck is a sign of imperfection in life. There are some variables in Covid-19 transmission which we don’t know yet and they fill up the luck factor.
_
- Initial studies reported an estimation of 3% CFR for Covid-19. CFR varies by location, and is typically changing over time. CFRs vary widely between countries, from 0.2% in Germany to 7.7% in Italy for Covid-19. The case fatality rate (CFR) reflects the percentage of diagnosed people who die from a disease, and the infection fatality rate (IFR) reflects the percentage of infected (diagnosed and undiagnosed) who die from a disease. The University of Oxford’s Centre for Evidence-Based Medicine estimates that the infection fatality rate for the pandemic as a whole is between 0.1 per cent and 0.39 per cent. According to the latest estimate by CDC the overall infection fatality rate is just 0.26 %. It seems more likely that the number might get even lower as we get more data. If these are true rates, and close & prolonged contact is required for transmission, then locking down the world with tremendous social and economic consequences could be counterproductive. It’s like an elephant being attacked by a house cat. Frustrated and trying to avoid the cat, the elephant accidentally jumps off a cliff and dies. Wearing masks by everybody in public domain, hand washing, PPE for health care workers, massive testing, isolation, quarantine, contact tracing and stay at home for elderly (>70 years) are sufficient to control Covid-19 without lockdown. Lockdown should not become lockdown of human mind.
______
Dr. Rajiv Desai. MD.
12 June, 2020
_____
Postscript:
Covid-19 is not a punishment by God to humans. No virus jumps from animals to human on its own. We cut the trees, we kill the animals, we disrupt ecosystems, and we shake viruses loose from their natural hosts. When that happens, they need a new host. Often, we are the new host. It is the destruction of biodiversity by humans that creates the conditions for new viruses and diseases such as Covid-19. For heaven’s sake don’t blame God for the misdeeds of humans.
_____
_____
Update on Covid-19
_
Section-1
Variant generation:
As of December 2021, there are five dominant variants of SARS-CoV-2 spreading among global populations: the Alpha Variant (formerly called the UK Variant and officially referred to as B.1.1.7), first found in London and Kent, the Beta Variant (formerly called the South Africa Variant and officially referred to as B.1.351), the Gamma Variant (formerly called the Brazil Variant and officially referred to as P.1), the Delta Variant (formerly called the India Variant and officially referred to as B.1.617.2), and the Omicron (B.1.1.529) variant identified initially in Botswana and South Africa.
According to Indian experts, morbidity and mortality in India as a consequence of explosive second wave, which started in March, 2021, is attributed largely to delta SARS-CoV-2 variant. The World Health Organization (WHO) blamed the second wave of the Covid-19 in India on the “premature” opening up of the society and relaxation of public health measures, as well as the emergence of new variants and unequal vaccine distribution.
_
Well, SARS-CoV-2 virus is not as intelligent as we think. It is a 60-100 nanometer particle which replicates into multiple identical particles inside another living cell. On its own, it cannot replicate. When it does replicate inside another living cell, its RNA genome is copied to generate identical particles. SARS-CoV-2 genome has 30,000 nucleotide bases. Just 30,000 letters of the alphabet of life are enough to create the entire SARS-CoV-2 virus, provided those letters find the machinery present in our cells to do the hard work. Those letters get copied, and copied, and copied with each new infection, in each new cell, and errors compound. Copying error is mutation. Viruses mutate constantly, and SARS-CoV-2 is not an exception. Viral mutations are evolutionary biologically hardwired to confer greater reproductive fitness to virus. Many mutations are point mutations that replace one nucleotide with another; others involve insertion or deletion of one or a few nucleotides. Mutation generates variants. So, generation of variants is a random copying mistake. Sheer by chance, some mutations assist in the replication of the virus, some may prevent the process of reproduction and other mutations are neutral. Only some mutations give the virus some advantage. Since the first copy of its genome was published on January 10th 2020, sequenced from a sample collected in Wuhan days earlier, some 5.6m SARS-CoV-2 genomes have been added to GISAID, a database. They have been arranged into 23 clades—groupings with a distinct common ancestor which differ from the original sequence and from all the others in at least one particular. Each clade has had the chance to outcompete the other versions, and almost all have failed. Most differences do not make much of a difference. Then again, some do—spectacularly so. The process of mutation, which generates genetic variation, is random, but selection is non-random. Selection favored variants that were better able to survive and reproduce. For example, delta variant is selected because it binds ACE2 receptor efficiently as compared to other competing mutants. Selection does not mean conscious selection. Virus does not have consciousness to select. Selection means delta variant replicated so efficiently in the host that its number increases exponentially in the host resulting in very high viral loads than those infected with the original Wuhan strain, allowing them to infect more people quickly. Over several weeks to months, it will become dominant variant in the population although other less efficient variants may still continue to infect minority population. By sheer chance, if another variant is created which is more efficient than delta variant, it will become dominant variant in the population. And so on. The reason a variant spread in one place and not another is thought to be largely environmental. For SARS-CoV-2 a crucial part of the environment is the immune system, and immune systems are different all over the world. How different genes, endemic infections, general levels of health, microbiomes and more end up stopping one variant from displacing another is largely uncharted territory. But not all variants stay local. First detected in India roughly a year ago, Delta displayed a level of transmissibility which saw it outcompete other strains almost everywhere, establishing itself as the dominant strain and often causing new waves of disease as it did so. The increased transmissibility of the delta was associated with, among others, a higher viral load, longer duration of infectiousness, and high rates of reinfection because of its ability to escape from natural immunity, resulted in the delta rapidly becoming the globally dominant variant.
_
No virus wants to kill host purposely because with death of host, virus also dies. All virus wants is to survive as species. That is why it is genetically coded to replicate. While undergoing replication, random errors occur which generated variants. No variant is generated purposely to harm humans. Now, the more the number of susceptible hosts, more the virus replicates. And more the virus replicates, more the chances of generating variants. Less the number of susceptible hosts, less the virus replicates and less the chances of generating variants. India has second largest population in the world with majority of people unwilling for covid appropriate behavior. So, India provided largest susceptible population for virus to replicate which resulted in generating delta virus, all by sheer chance. Delta virus which became threat to the world came into existence purely by chance because virus was given largest susceptible population to replicate continually for months. Once delta virus came into existence with great transmissibility due to efficient receptor binding, it spread tremendously as population was not following covid appropriate behavior. Had Indian population wore masks religiously in 2020-21, delta virus creation and spread would have been improbable. It was the responsibility of Indian regime & media to coerce people to wear mask but population pampering is the hallmark of Indian politics.
_
So don’t blame corona virus for creating variants that harm humans. All variants are generated randomly by chance due to availability of large susceptible population exhibiting covid inappropriate behavior. Let me give one example. How often do you get 3 Aces in a card game? Very rarely. Suppose you play card game daily for months, you may get 3 Aces simply because you have played countless number of games and rarity becomes reality. Delta variant is 3 Aces for corona virus generated by Indian population which allowed virus replication continually for months. Unmitigated transmission means rampant viral replication, which in turn means infinite opportunities for the emergence of new, more transmissible variants that could even escape natural or vaccine-induced immunity. The longer it takes to stem transmission of the virus, the more time these variants have to emerge and spread. This would occur far more in low-income countries, where people tend to live in close proximity and infection prevention strategies are difficult to implement because much of the populations rely on hand-to-mouth income (India being a case-in-point). In other words, delta variant evolved in India purely by chance due to availability of very large susceptible population. Once it came into existence, it was allowed to spread rapidly due to very large population living in close proximities and not wearing mask. R0 is the average number of susceptible people that each infected person is expected to infect. People infected with Delta pass the virus to between five and 9.5 people. This is higher than the original virus identified in Wuhan, China, which had an R0 between 2.3 and 2.7, and the Alpha variant which had an R0 between four and five. Delta can be as infectious as chicken pox, which has an R0 between 9 and 10.
_
Selection pressures are external agents which affect an organism’s ability to survive in a given environment. In the absence of selection pressure, viruses can remain stable in their host. As long as the virus can spread easily within a species, it does not need to change. However, when something exerts selective pressure on the viral populations, they can evolve rapidly. For example, vaccine induced immunity. Protection against Covid-19 is mediated in large part by an immune response directed against SARS-CoV-2 spike (S)-protein. The S-protein is responsible for virus-cell binding and is the target for virus-neutralizing antibodies (NAbs). NAbs induced by vaccination are protective against Covid-19. NAbs bind to the S-protein at a few sites, usually in or near the receptor-binding domain (RBD); in doing so, NAbs prevent the virus from attaching to the ACE2 receptor on human cells. Variants in the S-protein that increase its affinity for the ACE2 receptor are likely to increase virus transmission, an important problem in the context of a pandemic. Furthermore, the same or similar alterations can change the shape of the S-protein and impair or even destroy NAb binding sites. Hence, by extrapolation, vaccine efficacy might be compromised. These “escape mutations” typically arise when the virus is put under selective pressure by antibodies that limit but do not eliminate viral replication. Under these conditions, the virus might then find a way to escape this pressure and restore its ability to reproduce more efficiently. The scenario of virus evolution in the face of suboptimal immunity is the main reason against extending the interval between the first and second dose of a SARS-CoV-2 vaccine. Let me explain differently. In individuals with weakened immune systems, who cannot fight the virus effectively, the pathogen can “try out” new things (mutations) for a longer period of time. In the end, the variants that most effectively escape the body’s defences remain and replicates efficiently in people who have taken vaccine. Thus vaccine resistant mutant is born, all by chance, all because suboptimal immunity allowed virus to replicate generating random mutations, some of which can evade immunity purely by chance.
A research team from Imperial College London showed in a large study that having had Covid probably only offers 19% protection against Omicron and that was roughly in line with two doses of vaccine, which the team estimated were as much as 20% effective against Omicron. Why so? Because Omicron (B.1.1.529 variant) came into existence by replicating in vaccinated population. By mid-2021, large part of western world was fully vaccinated. If by chance, some of them have suboptimal immunity either due to genes or other diseases or immunosuppressive drugs, the virus replicates and generate mutations but due to presence of antibodies against spike protein, only those mutations that escape these antibodies can continue to replicate efficiently and since there was no mask mandate due complacency by vaccination, the virus got transmitted to another vaccinated person with suboptimal immunity. The same cycle repeats and by chance if any vaccinated individual had another coinfection with common cold corona virus, some recombination of genetic material occurred between SARS-CoV-2 and human common cold corona virus. Thus, Omicron was born by mutation and recombination in vaccinated population and later spread to unvaccinated population. If I were to name Omicron, I would name it Vaccine Virus. As it arose in vaccinated population, it will escape natural as well as vaccine induced immunity resulting in more reinfections and breakthrough infections. However, while Omicron has some 50 mutations, several of which overlap with those in the alpha, beta, gamma, or delta; it binds efficiently to upper respiratory track and bronchi rather than lung parenchyma, thus less lethal but more transmissible. Now the question comes, why it is more transmissible in U.K. than Africa? Because people of Africa have been exposed to human common cold corona viruses repeatedly as opposed to western population. Due to lower socioeconomic status, living in close proximities and poor personal hygiene, people of third world have been exposed to human corona viruses repeatedly. I doubt whether Omicron arose in Africa where most unvaccinated people live. Not wearing mask by vaccinated people with suboptimal immunity is the main reason for genesis & spread of Omicron. Omicron has been identified in most countries across the world and there are increasing cases of community transmission with no links to travel. Delta accounted for 99% of infections around the world but Omicron has become dominant in many countries. It appears that Omicron may become the most contagious virus in the history of mankind.
_
I reiterate, all variants including those having increased transmissibility and immune evasion are generated purely by chance provided sufficient susceptible hosts are available. If everybody wears masks, you are reducing susceptible population to minimum thereby limiting variant generation. Masking not only reduces transmission but also reduces variant generation. Of course, highly transmissible new variant can initiate a wave but that wave spreads due to availability of large susceptible population and that large susceptible population allows generation of even more dangerous variants. Susceptible population can be reduced by masking, vaccinating and naturally infecting people. We do not want everybody to be naturally infected worldwide as it would lead to tremendous morbidity and mortality far beyond capacity of health care systems of the world. Masking and vaccination reduce natural infections. In nutshell, masking and vaccination together, reduce susceptible population, reduce transmission, reduce natural infection and reduce generation of variants; all provided everybody wears masks and entire population is vaccinated rapidly & equitably. However, since vaccinating entire population rapidly and equitably is impossible and vaccine resistant Omicron variant is getting foothold, the only possible way we can control this pandemic is mask wearing by everybody till pandemic disappears.
_
The case fatality rate of the Delta variant is low for the general population, around 0.2%. Yet thousands died every day during 2nd wave in India because it spread very fast in population resulting in large number of new cases daily. Official figure was 400,000 new cases daily but actually at least 4 million people were infected daily. That resulted in thousands of deaths daily despite low case fatality rate. Delta makes up 99 % of all genomic sequences reported to public databases and has “outcompeted” other variants in most countries. Omicron variant may challenge Delta predominance but Omicron has lesser case fatality rate so far. But it can spread tremendously to cause significant mortality and wearing mask by everybody can halt it.
_
Section-2
Social distancing:
Somehow the world believes that I am against social distancing as a measure to control transmission of covid-19. All I said in my article the enigma of covid-19 is that “Wearing a mask by everybody protect everybody from droplet and airborne transmission compared to not wearing a mask; no matter surgical mask or cotton mask, and no matter distance between wearers.” Let me give one example. Suppose there is a snake in a room, what would you do? You would run away as far as possible so that the physical distance between the snake and you is so large that snake cannot bite you. Suppose there is a terrorist in a street, you would run away as far as possible so that he cannot shoot you. Physical distance helps you no matter the airborne virus, the snake or the terrorist. You don’t need any study to prove it. Greater the distance, greater the safety. But to say that 6 feet distance is safe to prevent infection is irrational no matter the study demonstrating it because this virus is predominantly airborne and can travel beyond 10 feet easily. No study is above logic. It is the logic that drives the study and not the other way around. If the whole world stays at home for 15 days, I mean all 8 billion people at home concurrently for 15 days; the pandemic would end. Is it possible or achievable? Physical distancing is not always possible and there will be times when we will need to come into contact with people in closed rooms, in offices, in shops, or in social settings. Masking is feasible, achievable and economical with excellent results without much harm except inconvenience to people with hearing loss. There is no logic in combining masking with 6 feet social distancing. Yes, if somebody is not wearing mask due to any reason, then, physical distancing of at least 10 feet is must to prevent transmission. Social distancing of 6 feet is irrational for airborne virus. A November 2021 study found that participation in a large, indoor, live gathering without physical distancing was not associated with increased SARS-CoV-2–transmission risk, provided a comprehensive preventive intervention including antigen-screening within 3 days, medical mask wearing, and optimised ventilation was provided. But nobody is talking about this study because experts & media are obsessed with social distancing. My guideline for airborne virus is “avoid crowding, good ventilation and everybody wear mask”. This will hold true for all future airborne pandemics & epidemics.
_
Section-3
Airborne transmission:
World health organisation (WHO) has accepted my contention discussed in my article the enigma of Covid-19 that airborne transmission result in large clusters of infection in a short period, vividly demonstrated by Covid-19. Proper ventilation in indoor environment can reduce the risk of airborne transmission of corona virus. Had world accepted my contention that covid-19 is predominantly airborne in June 2020, we could have promulgated better public health guidelines and reduce spread of corona virus. Anyway, I thank WHO for recognising my work.
_
Section-4
The covid virus origin:
Behind every pandemic is a tale of its murky origin. When HIV/AIDS emerged in the 1980s, it was alleged, with a little Soviet help, that the virus had been developed in an American lab. Between Washington’s inaction on the epidemic and its sordid past of shady experiments, proponents said the theory couldn’t be dismissed out of hand. When SARS emerged in 2003, so did fears of the severe acute respiratory syndrome’s unnatural origin. “It’s a very unusual outbreak,” bioweapons expert Ken Alibek told the New York Times at the time. “It’s hard to say whether it’s deliberate or natural.” One Russian scientist posited that “the propagation of the atypical pneumonia may well be caused by a leak of a combat virus grown in Asian bacteriological weapons labs.” And in recent years, efforts to eradicate Ebola have been hobbled by attacks on health care workers motivated, at least in part, by a belief that the virus is man-made.
_
A meta-transcriptomic study of 411 bat samples collected from a small geographical region in Yunnan province, China, between May 2019 and November 2020, identified 24 full-length coronavirus genomes, including four novel SARS-CoV-2-related and three SARS-CoV-related viruses. Rhinolophus pusillus virus RpYN06 was the closest relative of SARS-CoV-2 in most of the genome with a 94.48% sequence identity, although it possessed a more divergent spike gene. The other three SARS-CoV-2-related coronaviruses carried a genetically distinct spike gene that could weakly bind to the hACE2 receptor in vitro. These results clearly demonstrate that viruses closely related to SARS-CoV-2 continue to circulate in bat populations, and in some regions might occur at a relatively high frequency. SARS-CoV-2 most likely originated in nature and not in a laboratory, on the basis of early genetic analysis of the new virus and well-established evidence from previous emerging infectious diseases, including the coronaviruses that cause the common cold as well as the original SARS-CoV and MERS-CoV.
_
The lab leak theory says the furin cleavage site, a tiny string of amino acids on the virus, is key to understanding the novel coronavirus’s origin. But that cleavage site actually points toward the virus’s natural origin. You cannot, in a normal cell culture, maintain the furin cleavage site. When the Covid-19 virus is replicated in a cell culture in a lab, the furin cleavage tends to delete itself. A peer-reviewed paper, published in Nature, noted that habit and identified seven other papers that found a similar deletion. So, if virologists were using traditional methods and their preferred cell lines to try to force the virus to replicate, mutate, and change, the furin cleavage site would likely disappear. Lab leak theory proponents say this furin site is too well adapted for humans to be an accident. But the opposite is true. The cleavage site is imperfect, so odd, that it could have only been a freak of nature.
_
In a nutshell
There is strong scientific evidence to support the contention that SARS-CoV-2 evolved naturally.
_
Section-5
Virus transmissibility:
Two epidemiological parameters often characterize the transmissibility of infectious diseases: the basic reproductive number (R0) and the dispersion parameter (k). R0 describes, on average, how many individuals in a susceptible population will be infected by someone with that disease, and k details the variation in individual infectiousness. The smaller the k value, the greater the variation. That is, fewer cases cause the majority of infections, and a greater proportion of infections tend to be linked to large clusters via superspreading events. This phenomenon, called overdispersion in transmissibility, has been found in many infectious diseases, yet the factors that mediate it remain poorly understood. During the Covid-19 pandemic, transmission of SARS-CoV-2 has been highly overdispersed, as 60–75% of cases infect no one and, propelled by superspreading events, 10–20% of cases cause 80% of secondary infections. So inherently, most COVID-19 cases are minimally infectious, but highly infectious individuals are estimated to expel hundreds to thousands of virions per minute while talking, singing, or coughing. So we have to lockdown those individuals having RTPCR with very low cycle threshold (Ct) values; and ban crowding especially indoor. Locking down the entire nation is unwise and counterproductive. India is a classic case of biggest lockdown in the history; yet suffered historic devastating 2nd wave in post lockdown period due to covid inappropriate behaviour of population. It is easy to blame virus variants for waves but the buck stops at quantum of susceptible population and that to a certain extent depends on behavior of people i.e., wearing masks and getting vaccinated. A mathematical modelling study found that the risk of a large wave of COVID-19 hospital admissions resulting from lifting covid restrictions can be substantially mitigated if its timing is carefully balanced against vaccination coverage. However, with the delta variant, it might not be possible to fully lift covid restrictions without a wave of hospital admissions, even if vaccination coverage is high. Now with Omicron occurring in vaccinated population, masking is indispensable even if vaccination coverage is high.
_
Section-6
Vaccination:
Through a tremendous global effort, COVID-19 vaccine development milestones have been reduced from a period of 10 to 15 years to 1 to 2 years. There are 19 licensed vaccines, including mRNA vaccines, adenovirus-vectored vaccines, and inactivated virus vaccines. Humankind timely developed safe and efficacious SARS-CoV-2 vaccines that have prevented thousands of deaths worldwide. In Chile, the UK, and the USA, all of which have licensed different vaccines, a decreasing number of Covid-19 deaths have correlated with vaccine rollout. About 8.66 billion doses have been administered globally, by December 19, 2021. Countries and regions with the highest incomes are getting vaccinated more than 20 times faster than those with the lowest. Africa is a continent that cannot vaccinate its most vulnerable populations (e.g., older people and those with chronic conditions) and highly exposed health-care workers. The speed at which vaccines are administered is crucial. Every vaccine administered might translate into averted COVID-19 cases, hospitalizations, and deaths.
_
Some Covid-19 vaccines are as follows:
AstraZeneca = ChAdOx1 nCoV-19 = ChAd
Pfizer–BioNTech = BNT162b2 = BNT
Moderna = mRNA-1273 = m1273
Novavax = NVX-CoV2373 = NVX
Johnson & Johnson vaccine = JNJ-78436735 = Ad26.COV2.S
Bharat Biotech vaccine = BBV152 = Covaxin
_
Efficacy of vaccines:
Ongoing data continue to demonstrate that the vaccines are highly effective against Covid-19, although certainly not 100% effective. Studies show that the Pfizer-BioNTech and Moderna vaccines are, respectively, 95% and 94% effective against symptomatic COVID-19, while the Johnson & Johnson vaccine is 72% effective against clinically recognizable disease in the U.S. Two doses of the Oxford/AstraZeneca COVID-19 vaccine is around 85% to 90% effective against symptomatic disease. Two doses of Covaxin, an inactivated SARS-CoV-2 Indian vaccine (BBV152), offer 77.8% protection against symptomatic disease. Overall, multiple studies shows that COVID-19 vaccines are the best way to lower the number of COVID-19 cases, minimize severe illness, and slow the spread.
_
The continual emergence of SARS-CoV-2 variants has raised concern that COVID-19 vaccines could have reduced effectiveness against new variants. With Wuhan COVID-19 virus, vaccines showed reduced asymptomatic infection and therefore transmission. It had also been demonstrated that high levels of protection were conferred following the first dose. However, with the Delta variant, 2 doses are required for adequate protection, and there have been reports of transmission in vaccinated individuals. The picture emerging from various countries does suggest that vaccinated people are more likely to experience symptoms after catching the delta variant compared with earlier forms of the virus. Data published by the Israeli government suggest that the Pfizer BioNTech jab’s efficacy against symptomatic infection fell from 94% to 64% after the delta variant began spreading in the country. Figures from Public Health Scotland published in the Lancet also show a drop in protection against symptomatic illness, from 92% against the alpha variant, which was first detected in the UK, to 79% against delta among people with two doses of the Pfizer BioNTech vaccine. For the Oxford AstraZeneca vaccine, the reduction was from 73% to 60%. During May 1–July 25, 2021, among 43,127 SARS-CoV-2 infections in residents of Los Angeles County, California, 10,895 (25.3%) were in fully vaccinated persons, 1,431 (3.3%) were in partially vaccinated persons, and 30,801 (71.4%) were in unvaccinated persons. A survey in Mumbai found that 50% of hospitalized covid patients were vaccinated although 90 % of ICU covid patients were unvaccinated. But despite these drops in efficacy, vaccines in use (Pfizer BioNTech, AstraZeneca, and Moderna) all reduce the risk of death by more than 85%, regardless of variant. Even though we are seeing infections after vaccination — referred commonly to as ‘breakthrough infections’ — the effectiveness against severe disease is still substantial.
_
An important point to note that reduction in vaccine effectiveness against SARS-CoV-2 infections over time is also due to waning immunity with time in addition to delta/omicron variant escaping vaccine protection. Although the vaccines currently approved or available provide high levels of protection against severe illness and death, the increased transmission of the delta/omicron variant resulted in increasing numbers of breakthrough infections in fully vaccinated individuals. This coincided with evidence of waning of immunity in some vaccinated populations. Booster vaccines do enhance waning immunity and expand the breadth of immunity against SARS-CoV-2 variants of concern.
Another point to note that even if antibody levels in vaccinated individuals wane over time, it does not necessarily mean reduction in the efficacy of vaccines against severe disease. This could be because protection against severe disease is mediated not only by antibody responses, which might be relatively short lived for some vaccines, but also by long-lived memory responses and cell-mediated immunity. A November 2021 study found that ChAdOx1 nCoV-19 vaccine remained effective against moderate-to-severe COVID-19, even during a surge that was dominated by the highly transmissible delta variant of SARS-CoV-2 in India. Spike-specific T-cell responses were maintained against the delta variant. Such cellular immune protection might compensate for waning humoral immunity. Because 97 to 98% sequences of variants are identical to the original virus found in Wuhan, T-cell responses should work with variants. Alessandro Sette, an immunologist at the La Jolla Institute for Immunology and his colleagues have shown that T-cells preserve 93-97% of their targeting capacity when faced with a new variant.
Should the vaccines be updated?
Some scientists have argued that a vaccine update should target Delta – since it is so dominant worldwide, the thought was that all subsequent variants would come from Delta anyway. Well, Omicron shows us that we might not be able to predict where the next important variant will arise.
Another point to note that whatever advantage third dose boosters provide would not outweigh the benefit of using those doses to protect the billions of people who remain unvaccinated worldwide.
_
In a nutshell:
Get vaccinated as soon as possible no matter the variant, and once everybody (including pregnant women) is vaccinated with two doses, go for booster dose. Health care workers must be given booster dose immediately in view of omicron threat. So far, all studies done in children show that Covid-19 vaccines are very safe. Children and adolescents tend to have milder disease compared to adults, so unless they are part of a group at higher risk of severe Covid-19, it is less urgent to vaccinate them than older people, those with chronic health conditions and health care workers; but if sufficient vaccines are available, vaccinate them too. Although children have milder disease, better vaccinate them to reduce susceptible population which in turn will reduce variant generation.
_
Heterologous vaccine regimens against Covid-19:
Safety considerations associated with the Oxford–AstraZeneca COVID-19 ChAdOx1-S vaccine (AZD1222) have led many public health agencies to recommend a heterologous boost with an mRNA vaccine after prime vaccination with ChAdOx1-S instead of a homologous boost. The first results of a phase 2 trial from Spain and additional reports from observational studies suggest robust immune responses accompanied by acceptable reactogenicity after ChAdOx1-S prime and BNT162b2 (Pfizer–BioNTech) or mRNA-1273 (Moderna) boost vaccination. Given the strong immune response after heterologous prime-boost vaccination, mixing of vaccines has been suggested as a suitable strategy to contain emerging SARS-CoV-2 variants. Heterologous boosting with BNT162b2 has been shown to induce higher counts of spike-specific CD4+ and CD8+ T cells and, in particular, high titers of neutralising antibodies in a surrogate test against the SARS-CoV-2 variants of concern. Heterologous prime-boost strategies may offer immunological advantages to optimize the breadth and longevity of protection achieved with currently available vaccines.
Global emergence of SARS-CoV-2 variants makes it imperative to improve vaccine efficacy. Vaccine efficacy could be improved via a heterologous boost regimen using vaccines based on two different platforms as studies showed that immunogenicity was higher for heterologous schedules of adenovirus vector-based and mRNA-based vaccines compared with homologous prime-boost schedules. Rather than waiting for higher efficacy vaccines or newer vaccines, existing vaccines could be used in combination to improve immune response against variants. As protection against SARS-CoV-2 infection has waned after a two-dose schedule of COVID-19 vaccines, policy makers have begun to consider the implications for periodic or seasonal third dose, also known as a booster vaccination against COVID-19 to protect the most vulnerable patients, and mitigate health-care and economic impacts. Safety and immunogenicity of seven COVID-19 vaccines as a third dose (booster) following two doses of ChAdOx1 nCov-19 or BNT162b2 in a blinded, multicenter, randomised, controlled, phase 2 trial found that all study vaccines boosted antibody and neutralising responses after ChAd/ChAd initial course and all except one after BNT/BNT, with no safety concerns. Policy makers and national immunisation advisory committees should establish criteria for choosing which booster vaccines to use in their populations. For example in India, those who have taken two doses of covishield (AstraZeneca) vaccine can take booster dose covaxin and vice versa.
_
Vaccine inequity:
Vaccine inequity across countries is a matter of global concern. A study found that third dose of the BNT162b2 mRNA vaccine is effective in protecting individuals against severe COVID-19-related outcomes, compared with receiving only two doses at least 5 months ago. A research team from Imperial College London showed in a large study that two doses of vaccine is 20% effective against Omicron, and a booster dose helped dramatically, blocking an estimated 55% to 80% of symptomatic cases. If the practice of administering a third dose to all individuals older than 12 years becomes established in vaccine-rich countries, it can aggravate supply shortages for other countries. In this scenario, under-vaccinated populations could generate the conditions for the emergence of new variants, which might not only be more infectious but also exhibit greater immune escape, and those variants might enter vaccine-rich countries to trigger fresh waves of infection. Of course, vaccine inequity along with vaccine hesitancy is a double whammy. But with Omicron we have triple whammy. Vaccine inequity plus vaccine hesitancy plus vaccine resistance. Most of the 43 COVID-19 cases caused by the Omicron variant identified in the United States till December 12 were in people who were fully vaccinated, and a third of these had received a booster dose. 43 is a small number to arrive at a conclusion but only boosters will not protect the world. We will continue to live in fear until we fix the vaccine inequity. As countries discharge their responsibility to protect vulnerable individuals in their populations, they must ensure adequate supply to other countries. COVID-19 vaccine strategies must remain focused on severe disease, and that global equity in achieving high adult coverage (i.e., for those aged 18 years and older) of at least one dose is key to minimizing severe COVID-19. Remember, highest mortality is in unvaccinated population and not in unboostered population no matter the variant.
_
Serious side effects of vaccines:
Anaphylaxis to the mRNA COVID-19 vaccines is currently estimated to occur in 2.5 to 11.1 cases per million doses, largely in individuals with a history of allergy. Most individuals with anaphylaxis cases recovered without shock or endotracheal intubation. It’s critically important to emphasize that these allergic reactions are uncommon and substantially lower than the rate reported with penicillin. A careful review of all available safety data of more than 17 million people vaccinated in the European Union (EU) and UK with COVID-19 Vaccine AstraZeneca has shown no evidence of an increased risk of pulmonary embolism, deep vein thrombosis (DVT) or thrombocytopenia, in any defined age group, gender, batch or in any particular country. In fact, by not taking vaccines, people are prone to severe covid disease which often results in thrombosis. So blood clots are more likely by not taking vaccine rather than taking vaccine.
_
Section-7
Masking:
Whether it is the Wuhan virus or the Alpha variant or the Delta variant or the Omicron variant that we may be exposed to in any part of world, properly wearing a mask will protect us from the virus entering our nose or mouth through droplets or aerosol. Results from more than 30 studies from around the world that were analyzed in detail, showed a statistically significant 53% reduction in the incidence of Covid with mask wearing. I have stated in my Christmas message of 2020 that wearing masks by everybody in public domain remains the only pragmatic solution till effective vaccine arrives on mass scale; and taking Covid-19 vaccine doesn’t mean one can immediately stop wearing a mask due to various reasons; and Indian national TV channels refused to promote mask wearing as a measure to control Covid-19 just because I supported mask wearing. The result of not wearing mask by India was seen by everybody worldwide; the explosive and devastative 2nd wave from March to June 2021 in India. CDC issued guidelines for not wearing masks by vaccinated people. The result is seen by the whole world, explosive 3rd wave in July 2021 in the U.S. CDC was forced to reverses indoor mask policy, saying fully vaccinated people and kids should wear them indoors. Both India and U.S. are the two worst coronavirus-hit countries simply because they refused to wear masks. The studies which prompted CDC to lift mask mandate were misleading and misrepresented facts. I have been saying repeatedly that don’t merely go by studies but apply your mind. All experts say that they are looking at data but forget that data is collected by humans who are not infallible.
_
Section-8
Reinfection:
The presence or absence of protective immunity after infection with, or vaccination against, SARS-CoV-2 will affect transmission of the virus and severity of illness. The absence of pre-existing immunity to SARS-CoV-2 is thought to be responsible for the rapid spread of the virus globally and for the continuing pandemic. Therefore, greater understanding of the degree of protection against reinfection with SARS-CoV-2 is essential to refine appropriate intervention strategies. Multiple epidemiological and clinical studies, including studies during the recent period of predominantly delta (B.1.617.2) variant transmission, found that the risk of repeat SARS-CoV-2 infection decreased by 80.5–100% among those who had had COVID-19 previously. Although these studies show that protection from reinfection is strong and persists for more than 10 months of follow-up, but it is unknown how long protective immunity will truly last. Many systemic viral infections, such as measles, confer long-term, if not lifelong, immunity, whereas others, such as influenza, do not (due to changes in viral genetics).
It is known that SARS-CoV-2 infection induces specific and durable T-cell immunity, which has multiple SARS-CoV-2 spike protein targets (or epitopes) as well as other SARS-CoV-2 protein targets. The broad diversity of T-cell viral recognition serves to enhance protection to SARS-CoV-2 variants. However, a CDC study found that vaccination offers higher protection than previous COVID-19 infection. I want to repeat again and again that no study is above logic. How can vaccination by mRNA vaccine gives better protection than natural infection? mRNA vaccine generates spike protein which generates antibodies and T cells against it. Live virus infection generates antibodies and T cells against all viral proteins including spike protein.
Omicron has challenged reinfection logic of its predecessors. Omicron variant largely evades immunity from past infection or two vaccine doses according to the latest Imperial college modelling. The risk of reinfection with the Omicron variant is 5.4 times greater than that of the Delta variant simply because Omicron came into existence in vaccinated population with suboptimal immunity.
_
Section-9
Herd immunity:
Herd immunity is unlikely due to many reasons:
(1) It’s clear that vaccines do not prevent transmission to great extent.
The key to herd immunity is that, even if a person becomes infected, there are too few susceptible hosts around to maintain transmission — those who have been vaccinated or have already had the infection cannot contract and spread the virus. The COVID-19 vaccines developed by Moderna and Pfizer–BioNTech, for example, are extremely effective at preventing severe disease, but it is clear that they cannot protect people from becoming infected, or from spreading the virus to others. Currently approved vaccines provide high levels of protection against serious illness, but do not confer mucosal immunity to resist entry of the virus into the respiratory tract. Omicron is spreading rapidly in vaccinated population.
However, there are reasons to be optimistic about the vaccines’ effect on disease transmission. Infectiousness of breakthrough infections can be measured by viral densities. Higher SARS-CoV-2 viral density in the upper airways of people infected with the virus are thought to increase transmission to household members. If vaccines reduce viral density in those who do become infected despite vaccination, it would probably lead to lower infectiousness and less onward transmission. A study found that fully or partially vaccinated study participants had 40% less detectable virus in their nose and the virus was detected for 6 fewer days compared with those who were unvaccinated when acquiring the infection. Those vaccinated were 66% less likely to have a positive test result for more than 1 week than unvaccinated people with a SARS-CoV-2 infection. Another study found that those who develop COVID-19 despite being fully vaccinated are considerably less infectious for contact persons, who in turn are protected from infection if vaccinated.
(2) Vaccine roll-out is uneven
The speed and distribution of vaccine roll-outs matters for various reasons. A perfectly coordinated global campaign could have wiped out COVID-19 but in reality, it’s very unlikely that we will achieve that on a global scale. There are huge variations in the efficiency of vaccine roll-outs between countries, and even within them. Even for a country with high vaccination rates, such as Israel, if surrounding countries haven’t done the same and populations are able to mix, the potential for new outbreaks remains.
Vaccinating quickly and thoroughly can prevent a new variant from gaining a foothold. But the unevenness of vaccine roll-outs creates a challenge. You’ve got a fair bit of immunity, but you still have a fair bit of disease, and you’re stuck in the middle. Higher rates of immunity can create selective pressure, which would favour variants that are able to infect people who have been immunized. Vaccines will almost inevitably create new evolutionary pressures that produce variants in some people who have sub-optimal immunity, for example Omicron variant. Simultaneously, under vaccinated population allows virus replication unabashedly resulting in more dangerous variants, for example Delta variant.
So, we have double whammy. Sporadic variant from vaccinated (Omicron) and regular variant from unvaccinated population (Delta). But for any variant to get foothold, you need susceptible population. Masking by everybody reduces susceptible population. Best solution is masking while vaccinating population. Keep masking till 100 % population is vaccinated. Masking will reduce transmission greatly, reducing chance of vaccine resistant mutant to come up and spread.
(3) Immunity might not last forever
Calculations for herd immunity consider two sources of individual immunity — vaccines and natural infection. People who have been infected with SARS-CoV-2 seem to develop some immunity to the virus and more than 80% are protected from reinfection but how long that lasts remains a question. Given what’s known about other coronaviruses and the preliminary evidence for SARS-CoV-2, it seems that infection-associated immunity wanes over time, so that needs to be factored in to calculations. Even vaccine induced immunity wanes over time, so the need for third dose. A study found that antibodies that people make after they get the standard two inoculations of the Moderna mRNA vaccines are 50 times less effective against Omicron than they are against the original form of the virus. Omicron is spreading rapidly in vaccinated people and some of them had booster dose also. Even if we decide to give booster to entire population, it will take so much time that Omicron wave will be over by that time and another variant may be replacing omicron; not to mention vaccine inequity and hesitancy. We are caught in a zero-sum game. Masking with one or two or three dose vaccine is the only reasonable approach today. Of course, newer effective antiviral treatment may help us out.
(4) Vaccines might change human behaviour
The problem is that, as more people are vaccinated, they will increase their interactions, and that changes the herd-immunity equation, which relies in part on how many people are being exposed to the virus. The vaccine is not full proof. Imagine that a vaccine offers 90% protection: If before the vaccine you met at most one person, and now with vaccines you meet ten people, you’re back to square one. Vaccine induced change in human behaviour is the main cause of Omicron creation and transmission.
Given what is known about COVID-19 so far, reaching herd immunity through vaccines alone is going to be rather unlikely. It’s time for more realistic expectations. The vaccine is unlikely to completely halt the spread, so we need to think of how we can live with the virus. Even without herd immunity, the ability to vaccinate vulnerable people seems to be reducing hospitalizations and deaths from COVID-19. The disease might not disappear any time soon, but its prominence is likely to wane.
_
Section-10
Treatment of covid:
Two main processes are thought to drive the pathogenesis of Covid-19. Early in the clinical course, the disease is primarily driven by replication of SARS-CoV-2. Later in the clinical course, the disease appears to be driven by a dysregulated immune/inflammatory response to SARS-CoV-2 that leads to tissue damage. Based on this understanding, it is anticipated that antiviral therapies would have the greatest effect early in the course of the disease, while immunosuppressive/anti-inflammatory therapies are likely to be more beneficial in the later stages of COVID-19.
No therapy has been proven to be beneficial in outpatients with mild to moderate COVID-19 who are not at high risk for disease progression. My son developed mild covid and I advised paracetamol (acetaminophen) and vitamins. No antibiotics, no purported antivirals and no steroids. He recovered completely.
The pharmaceutical firm Merck announced recently that an antiviral pill molnupiravir which exerts its antiviral action through introduction of copying errors during viral RNA replication can reduce hospitalizations and deaths among people with COVID-19 by half and it has been approved by the UK medicines regulator. Pfizer’s novel oral antiviral PF-07321332/ritonavir combination drug that is specifically designed to inhibit the SARS-CoV-2-3CL protease enzyme reduces the risk of hospitalization or death by 89 percent when given within three days after the start of symptoms. These antiviral drugs may radically change covid management and save lives but we need more data. According to the latest findings Merck presented to the FDA, the pill reduced the risk of hospitalization and death by 30 percent only.
Inhaled budesonide improves time to recovery, with a chance of also reducing hospital admissions or deaths, in people with Covid-19 in the community who are at higher risk of complications.
In outpatients with mild to moderate Covid-19 who are at high risk for disease progression, anti-SARS-CoV-2 monoclonal antibody-based therapies may have the greatest potential for clinical benefit during the earliest stages of infection. For these patients, administering bamlanivimab plus etesevimab or casirivimab plus imdevimab are recommended.
Remdesivir, an antiviral agent, was the only drug that is approved by the FDA for the treatment of Covid-19. It is recommended for use in hospitalized patients who require supplemental oxygen. However, it is not routinely recommended for patients who require mechanical ventilation due to the lack of data showing benefit at this advanced stage of the disease.
Dexamethasone, a corticosteroid, has been found to improve survival in hospitalized patients who require supplemental oxygen, with the greatest benefit observed in patients who require mechanical ventilation. Therefore, the use of dexamethasone is strongly recommended only in this setting.
Adding tocilizumab, a recombinant humanized anti-interleukin-6 receptor monoclonal antibody, to dexamethasone therapy was found to improve survival among patients who were exhibiting rapid respiratory decompensation due to Covid-19.
It has become clear that efficacy and safety of antithrombotic treatments depend on timing with respect to illness severity and dose, and that the mechanism of action might also be important. For non-critically ill patients hospitalized with COVID-19, therapeutic-dose heparin appears beneficial, with a high probability of reducing the need for organ support and the progression to intubation and death, regardless of D-dimer results. By contrast, in critically ill patients, therapeutic-dose heparin did not improve outcomes and there was a high probability of harm. In patients estimated to be at high VTE risk and low bleeding risk, post-discharge low-dose rivaroxaban is effective at reducing thrombotic events and thrombotic-related death with a low risk of major bleeding.
_
Section-11
Education crisis:
The whole world is talking about economic crisis but in my view, education crisis is invisible but devastating. The current worldwide pandemic has wreaked havoc on education. Education is undeniably crucial in contributing to a country’s welfare and an individual’s growth, and it has been jeopardized by the emergence of Covid -19. Even before the COVID-19 pandemic, the world was living a learning crisis. Before the pandemic, 258 million children and youth of primary- and secondary-school age were out of school. And low schooling quality meant many who were in school learned too little. The Learning Poverty rate in low- and middle-income countries was 53 percent—meaning that over half of all 10-year-old children couldn’t read and understand a simple age appropriate story. Even worse, the crisis was not equally distributed: the most disadvantaged children and youth had the worst access to schooling, highest dropout rates, and the largest learning deficits.
_
The COVID-19 pandemic now threatens to make education outcomes even worse. The pandemic has already had profound impacts on education by closing schools almost everywhere in the planet, in the largest simultaneous shock to all education systems in our lifetimes. The damage will become even more severe as the health emergency translates into a deep global recession. The twin shocks of school closures and global recession could have long-term costs to education and development, if governments do not move quickly to counter them. The school closings shock will lead to learning loss, increased dropouts, and higher inequality; the economic shock will exacerbate the damage, by depressing education demand and supply as it harms households; and together, they will exact long-run costs on human capital accumulation, development prospects, and welfare. As of late April, schools have closed in 180 countries, and 85% of students worldwide were out of school. Without aggressive policy action, this will have immediate costs on both learning and health of children and youth. Learning inequality will increase, because only students from wealthier and more educated families will have the support to learn at home.
_
A study found that 240 million Indian children have missed school for over a year. Given this unprecedented closure of learning institutions, one of the most pressing tasks facing educators is to ensure that students’ learning is uninterrupted, but about 77% of Indian children have no access to online instruction and need to get back to schools offline. The digital divide is real and hurts the lower income groups grievously. Even for those who do have access to the right technology, online learning is not rewarding. I have taken so many lectures online but most students have no retention. They attend lectures but nothing goes into their minds. Ads, pop-ups, games, news, fun websites, social media, text messages, and more are constantly competing for student attention. These distractions can interfere with focusing and learning. Online learning requires motivation to complete tasks, stay engaged, and make progress but most students lack motivation.
_
The other factor, inseparable from education in the general Indian context, is health and nutrition. In India, schools provide good nutrition to disadvantaged children through the widely acclaimed mid-day meal program. Keeping schools closed for prolonged periods will certainly have an adverse impact on child nutrition. To the nation’s shame, physical growth and nourishment have been declining among India’s children for several years. The post-pandemic plight of the poor will multiply the damage. The Centre for Science and Environment estimates that 375 million children might suffer weight and growth loss.
_
The impact of the pandemic on K–12 student learning was significant, leaving students on average five months behind in mathematics and four months behind in reading by the end of the school year in the U.S. The fallout from the pandemic threatens to depress this generation’s prospects and constrict their opportunities far into adulthood. The ripple effects may undermine their chances of attending college and ultimately finding a fulfilling job that enables them to support a family. The cumulative effects of the pandemic could have a long-term impact on an entire generation of students. Education achievement and attainment are linked not only to higher earnings but also to better health, reduced incarceration rates, and greater political participation. Lower earnings, lower levels of education attainment, less innovation—all of these lead to decreased economic productivity. By 2040 the majority of this cohort of K–12 students will be in the workforce and a potential annual GDP loss of $128 billion to $188 billion is anticipated from pandemic-related unfinished learning.
_
We must safely reopen schools for in-person learning, with no crowding of students in class, proper ventilation and mask wearing. Some parents are still not convinced for in-person instruction to their children. Even if students re-enroll in effective learning environment, many will be several months behind academically and may struggle to reintegrate into a traditional learning environment. A potential starting point could be redoubling efforts to provide engaging, high-quality education in every classroom. Prioritizing education recovery is crucial to avoid a generational catastrophe.
_____
Dr. Rajiv Desai. MD.
December 23, 2021
______
182 comments on “The Enigma of COVID-19:”
Leave a Reply

I personally find that i value the responsive team and clear transparency. This site is reliable.
I was skeptical, but after half a year of cross-chain transfers, the scalable features convinced me.
I am sure this post has touched all the internet users, its really really nice paragraph on building up new website.|
Good respond in return of this matter with firm arguments and explaining the whole thing concerning that.|
I personally find that the testing new tokens tools are clear transparency and reliable uptime.
I personally find that the interface is quick deposits, and I enjoy using the API here.
I personally find that wow! This is a cool platform. They really do have the accurate charts. The mobile app makes daily use simple.
I was skeptical, but after several months of using the API, the wide token selection convinced me.
The using the mobile app tools are robust security and seamless withdrawals.
This platform exceeded my expectations with seamless withdrawals and intuitive UI.
The staking process is simple and the reliable uptime makes it even better.
Your style is unique compared to other people I’ve read stuff from. I appreciate you for posting when you have the opportunity, Guess I’ll just bookmark this web site.
Hi, constantly i used to check webpage posts here in the early hours in the break of day, as i enjoy to learn more and more.|
An impressive share! I have just forwarded this onto a coworker who was doing a little research on this. And he actually bought me breakfast due to the fact that I stumbled upon it for him… lol. So allow me to reword this…. Thank YOU for the meal!! But yeah, thanx for spending the time to discuss this matter here on your web page.
Hey there I am so thrilled I found your site, I really found you
by mistake, while I was researching on Askjeeve for something else,
Anyways I am here now and would just like to say many thanks for a fantastic post and a
all round interesting blog (I also love the theme/design), I don’t have time to read through it all at the moment but I have
bookmarked it and also included your RSS feeds, so when I have time I will be back to read a
lot more, Please do keep up the awesome job.
Greаt post. I was chеcking continuⲟusly this
blօg and I’m іmpreѕsed! Extremely useful іnfo particularly the last part 🙂
I care for ѕuch information a lot. I was looking for thіѕ cеrtain information for a
very lοng time. Thank yoᥙ and best of luck.
Аwesome blog! Do you have any tiρs for aspiring writers?
Ӏ’m pⅼanning to start my own website soon but I’m a little lost on evеrything.
Would you advise starting with a free platform like WordPress
or go for a paid option? There are so many choіces out there that I’m
completely overwhelmed .. Any tips? Kudos!
Keep on ԝorking, great joЬ!
exϲellent submit, very informative. I’m wondering why the opposite specіalists of this sector ⅾon’t notice this.
You should proceed your writing. I am confident, you have a hᥙցe reaɗers’ base alrеady!
What’s up to all, as I am genuinely eager of reading this website’s post to be updated on a regular basis. It includes pleasant material.|
I just couldn’t go aᴡay your site before ѕuggesting that I extremely enjoyed the սsual information an individual supply
on your visitors? Is ցonna Ƅe again often to check out new posts
Thanks for the article.Really thank you! Want more.
I eνerʏ time emailed this website post page to all my contacts, since if like to reаd it next my friends will too.
Appreciate you sharing, great blog.Really looking forward to read more. Great.
Very neat article.Much thanks again. Will read on…
I am so glad for your limitless support as well as love. I can constantly count on you to be there for me.
You provide important understanding right into the subject and also make outstanding links to various other topics.
A round of applause for your blog.Thanks Again. Much obliged.
I wanted to thank you for this great read!! I certainly loved every little bit of it. I have you book marked to check out new stuff you post…
I believe this is one of the such a lot significant info for me. And i’m satisfied reading your article. However wanna observation on some basic things, The website taste is ideal, the articles is actually nice : D. Just right process, cheers|
Being remarkable is easier than you think!
Amazingness can help you end up being much more effective and obtain even more out of life!