Dr Rajiv Desai
An Educational Blog
THE CYCLONE
THE CYCLONE:
_
_
Prologue:
I am not fond of weather analysis. Many times I inadvertently watch weather forecast on TV which I find quite boring. Nonetheless, after discussing earthquakes and tsunamis, I felt that I should discuss adverse weather events which also affect our lives. A storm is any disturbed state of atmosphere, and strongly implying severe weather; marked by strong wind, thunder, lightning and heavy precipitation (rain, ice etc). Storms are created when a center of low pressure develops, with a system of high pressure surrounding it. This combination of opposing forces can create winds and result in the formation of storm clouds. Storms generally lead to significant negative impacts to lives and property. The vertical wind shear in thunderstorm can cause airplane crashes. Severe weather is also responsible for plenty of helicopter crashes, and delay launch of space shuttles. There are various types of storms including tropical cyclone, thunderstorm, hailstorm, windstorm, tornadoes etc. Out of them, tropical cyclones and tornadoes stand out as causing maximum damage. Last month, tornadoes killed hundreds of people in America. I also felt that we must prevent nuclear meltdown form tornadoes and cyclones. So I decided to go into the details of weather.
_
Let us start with basics, the basics which will help us understand weather, weather storms and weather analysis.
_
The picture below shows earth’s rotation
Basics of time, length (distance) and place (location):
The Earth is a sphere flattened along the axis from pole to pole such that there is a bulge around the equator. This bulge results from the rotation of the Earth, and causes the diameter at the equator to be 43 km larger than the pole to pole diameter. The average diameter of this sphere is about 12,742 km, which gives approximately 40,003 km as circumference. At present, the Earth orbits the Sun once every 365.24 times it rotates about its own axis, which is equal to 365.24 solar days, or one solar year. Earth’s axis is the imaginary line which goes through the north and south poles and around which Earth spins. Earth’s axis is inclined 66.5 degrees from Earth’s orbital plane which means that it is tilted 23.5 degrees from a vertical 90 degrees.
_
A nautical mile is based on the circumference of the planet Earth. If you were to cut the Earth in half at the equator, you could pick up one of the halves and look at the equator as a circle. You could divide that circle into 360 degrees. You could then divide a degree into 60 minutes. A minute of arc on the planet Earth is 1 nautical mile. This unit of measurement is used by all nations for air and sea travel. A nautical mile is 1852 meters, or 1.852 kilometers. In other words, a nautical mile is 1.157 miles, or 6076 feet. To travel around the Earth at the equator, you would have to travel (360 multiply by 60) 21600 nautical miles, 24991 miles or 40003 kilometers.
_
A knot is a unit of measure for speed. If you are traveling at a speed of 1 nautical mile per hour, you are said to be traveling at a speed of 1 knot.
For wind speed
1 knot (kt) = 1.852 kilometer per hour (kph) = 1.157 miles per hour (mph)
1 mph = 0.864 kt
1 mph = 1.609 kph
1 mph = 0.4470 meters per second (m/s)
1 kt = 0.5148 m/s
1 kph = 0.277 m/s
_
Any location on Earth is described by two numbers–its latitude and its longitude. When looking at a map, latitude lines run horizontally. Latitude lines are also known as parallels since they are parallel and are an equal distant from each other. Each degree of latitude is approximately 69 miles (111 km) apart; there is a variation due to the fact that the earth is not a perfect sphere but an oblate ellipsoid (slightly egg-shaped). On a globe of the Earth, lines of latitude are circles of different size. The longest is the equator, whose latitude is zero, while at the poles–at latitudes 90° north and 90° south (or -90°) the circles shrink to a point. The vertical longitude lines are known as meridians. They converge at the poles and are widest at the equator (about 69 miles or 111 km apart). Zero degrees longitude is located at Greenwich, England (0°). The degrees continue 180° east and 180° west where they meet and form the International Date Line in the Pacific Ocean. Greenwich, the site of the British Royal Greenwich Observatory, was established as the site of the prime meridian by an international agreement. Every meridian must cross the equator. Since the equator is a circle, we can divide it–like any circle–into 360 degrees, and the longitude of a point is then the marked value of that division where its meridian meets the equator. To precisely locate points on the earth’s surface, degrees longitude and latitude have been divided into minutes (‘) and seconds (“). There are 60 minutes in each degree. Each minute is divided into 60 seconds. Seconds can be further divided into tenths, hundredths, or even thousandths. For example, the U.S. Capitol Washington is located at 38°53’23″N, 77°00’27″W (38 degrees, 53 minutes, and 23 seconds north of the equator and 77 degrees, no minutes and 27 seconds west of the meridian passing through Greenwich, England).
_
UTC stands for Universal Time Coordinated, what used to be called Greenwich Mean Time (GMT) is defined as the local time in Greenwich, England located at the zero meridian. This is the time at the Prime Meridian (0° Longitude) given in hours and minutes on a 24 hour clock. For example, 1350 UTC is 13 hours and 50 minutes after midnight or 1:50 PM at the Prime Meridian. As the Earth rotates around its axis, at any moment, one line of longitude –“the noon meridian “–faces the Sun, and at that moment, it will be noon everywhere on it. After 24 hours the Earth has undergone a full rotation with respect to the Sun, and the same meridian again faces noon. Thus each hour the Earth rotates by 360/24 = 15 degrees. When at your location the time is 12 noon, 15° to the east the time is 1 pm, for that is the meridian which faced the Sun an hour ago. On the other hand, 15° to the west the time is 11 am, for in an hour’s time, that meridian will face the Sun and experience noon. Now, 1 degree longitude on equator means 111 km in distance. So 15 degree would mean 1665 km. So when your location time on equator is 12 noon, it would be 1 pm at 1665 km east of you and 11 am at 1665 km west of you. Meteorologists have used UTC or GMT times for over a century to ensure that observations taken around the globe are taken simultaneously. However, longitude determines only the hour of the day–not the date, which is determined separately. The international date line has been established–most of it following the 180th meridian–where by common agreement, whenever we cross it the date advances one day (going west) or goes back one day (going east). That line passes through the Bering Strait between Alaska and Siberia, which thus have different dates, but for most of its course, it runs in mid-ocean and does not inconvenience any local time keeping.
_
Heat and temperature:
Heat and temperature are related and often confused. More heat usually means a higher temperature. Heat is energy. It is the total amount of energy (both kinetic and potential) possessed by the molecules in a piece of matter. Heat is measured in Joules. Temperature is not energy. It relates to the average (kinetic) energy of microscopic motions of a single particle in the system per degree of freedom. It is measured in Kelvin (K), Celsius (C) or Fahrenheit (F). When you heat a substance, either of two things can happen: the temperature of the substance can rise or the state of substance can change. I will give example. You have two bowls of water, one at 20 degree C and another at 90 degree C. The motion of the water molecules in the warmer bowl is greater than cooler bowl because temperature of warmer bowl is high. In other words, temperature denotes movement of atoms and molecules in a given matter. Greater the temperature, greater the movement. However, at 100 degree C, water starts boiling and transformed into vapor. The temperature remains same but the state changed from liquid to gaseous. The logic remains same. The water molecules in water vapor have far grater mobility than water in liquid state at 100 degree C. So heat energy in water vapor is greater than liquid water at 100 degree C and this increment of heat energy is the latent heat of vapor. Latent heat is defined as the energy released or required when a substance changes phases, such as gas to liquid in this case. If this latent heat energy is taken out of vapor, it is again converted back into liquid water. This latent heat energy can be utilized for storm generation.
_
I remember a simple formula from school days for conversion of Celsius (C) into Fahrenheit (F).
C/5 = F-32/9 __________C upon 5 is equal to F minus 32 upon 9.
So 50 degree Celsius is equal to 122 degree Fahrenheit. Celsius is also known as Centigrade.
_
Atmosphere and atmospheric pressure:
The Earth is surrounded by a blanket of air, which we call the atmosphere. The atmosphere of Earth is a layer of gases surrounding the planet Earth that is retained by Earth’s gravity. The atmosphere has no precise upper limit, but for all practical purposes the absolute top can be regarded as being at about 200 km. However, from a scientific point of view the atmosphere reaches up to 600-700 km. Life on Earth is supported by the atmosphere. The atmosphere absorbs the energy from the Sun, recycles water and other chemicals, and works with the electrical and magnetic forces to provide a moderate climate. The atmosphere also protects us from high-energy radiation and the frigid vacuum of space.
_
A planet’s climate is decided by its mass, its distance from the sun and the composition of its atmosphere. In fact, it is the distance from sun and mass of earth that determined during development of solar system, what kind of atmosphere the earth will have, water on earth and consequently life on earth. The corollary to this logic means that out of billions of stars in the sky, if any one of them of the size of sun has a planet of the size of earth at a distance from the star equivalent to distance of earth from the sun, then, such a planet could have atmosphere and water similar to earth and consequently life on it. Over the 4 plus billions of years in which Earth has had an atmosphere, its composition has changed significantly. The early atmosphere was largely ammonia and carbon dioxide plus some nitrogen, with little oxygen, but may have had more hydrogen. Today, atmosphere contains mainly nitrogen gas and oxygen gas. The picture below shows composition of atmosphere (air).
The nitrogen was derived originally as an escape from the Earth’s interior. Oxygen has increased its percentage over time largely through photosynthetic processes, starting about 1.5 billion years ago. Argon (derived from radioactive decay of potassium in rocks) is the next most abundant component, about 1%, but can sometimes be matched by water vapor (0.1 to 2 %). Carbon dioxide (CO2) and Ozone (O3) play small but important roles. Many of the other “trace” gases have either a biogenic origin, a volcanic origin, or result from human activity. The composition of air up to the outer limits of the stratosphere (out to about 70 km) is almost constant and homogeneous insofar as the three dominant species is concerned.
_
Mars is too small to keep a thick atmosphere. Its atmosphere consists mainly of carbon dioxide, but the atmosphere is very thin. The atmosphere of the Earth is a hundred times thicker. Most of Mars’ carbon dioxide is frozen in the ground. Mars’ average surface temperature is about -50 degree C. Venus has almost the same mass as Earth but a thicker atmosphere, composed of 96% carbon dioxide. The surface temperature on Venus is +460 degree C. Venus is hotter than earth and Mars is colder than earth because Venus is closer to sun than earth and Mars is away from sun than earth. Earth’s atmosphere is 78% nitrogen, 21% oxygen, and 1% other gases. Carbon dioxide accounts for just 0.03 to 0.04%. Water vapor, varying in amount from 0 to 2%, carbon dioxide and some other minor gases present in the atmosphere absorb some of the thermal radiation (heat in the form of infra-red rays) leaving the earth’s surface and re-emit back the heat in the form of infra-red rays to the earth’s surface. These radiatively active gases are known as greenhouse gases because they act as a partial blanket for the thermal radiation from the earth’s surface and enable it to be substantially warmer than it would otherwise be, analogous to the effect of a greenhouse. This blanketing is known as the natural greenhouse effect. Without the greenhouse gases, Earth’s average surface temperature would be roughly -20 degree C.
_
The atmosphere itself is a mixture of gases of different compositions; plus water as vapor, liquid, or solid; and suspended particles of various natures. These gases follow various rules of thermodynamics. Thus, the physics of meteorology becomes the physics of gas behavior as described by temperature, pressure, circulation, density stratification, and energy utilization and transformation. The main (predominant) source of energy powering atmospheric behavior and change is solar radiation from the Sun. Also contribution to thermal inputs (or exchange) is terrestrial heat flow; in and out movement of heat from water reservoirs (mainly, the ocean); contributions from man, animals, and plants; and chemical reactions within the atmosphere which can be exothermic or endothermic.
_
Subdivisions of earth’s atmosphere:
The picture below shows the main structural components of the atmosphere as a function of height above the surface of earth.
The lowest part of the atmosphere is called the troposphere. The gases in this region are predominantly molecular Oxygen (O2) and molecular Nitrogen (N2). All weather is confined to this lower region and it contains 90% of the Earth’s atmosphere and 99% of the water vapor. The highest mountains are still within the troposphere and all of our normal day-to-day activities occur here. The height of the troposphere varies from the equator to the poles. At the equator it is around 11-12 miles (18-20 km) high and at the poles just under four miles (6 – 7 km) high. Jet aircraft are capable of flying in the upper troposphere and lowermost stratosphere where the air is less dense (less drag on the plane and hence greater speed) and smoother, often cloud-free wind conditions.
_
In space, there is a nearly complete vacuum so the air pressure is zero. On Earth, because there are many miles of air molecules stacked up and exerting pressure due to the force of gravity, the pressure is about 14.7 pounds per square inch at sea level. Atmospheric pressure is the amount of force exerted over a surface area, caused by the weight of air molecules above it. Although air molecules are invisible, they still have weight and take up space. Since there’s a lot of “empty” space between air molecules, air can be compressed to fit in a smaller volume. When it’s compressed, air is said to be “under high pressure”. Air at sea level is what we’re used to; in fact, we’re so used to it that we forget we’re actually feeling air pressure all the time! Earth’s atmosphere is pressing against each square inch of you with a force of 1 kilogram per square centimeter (14.7 pounds per square inch). The force on 1,000 square centimeters (a little larger than a square foot) is about a ton! However, all that pressure does not squash you. Remember that you have air inside your body too, that air balances out the pressure outside so you stay nice and firm and not squishy.
_
The standard value for atmospheric pressure at sea level is: 29.92 inches or 760 millimeters of mercury.
The Pascal (symbol: Pa) is the SI derived unit of pressure, a measure of force per unit area, defined as one newton per square meter. One hectopascal (hPa) = 100 Pa. One hectopascal (hPa) is equivalent to one millibar (mb).
1 atmospheric pressure (atm) = 101325 Pascal (Pa) = 1013.25 millibars (mb) = 760 mm of mercury (Hg)
For atmospheric pressures: 1 inch of mercury = 33.86 mb = 3386 Pa
_
The total mass of the global atmosphere is estimated to be approximately 5.1 x 10¹⁸ kilograms. Ninety percent of that mass is in the inner 10 km (6 miles). The average density of air at the Earth’s surface is 1.2 kg/m3. The mean pressure of a column of air at sea level, coming from gravitational attraction on all gases above it to the outer limits of the exosphere (where gas molecules diminish to the levels of outer space) is set as 1013 millibars. Most of the mass of atmosphere is concentrated in the troposphere and air becomes progressively thinner with altitude. This causes progressive fall in atmospheric pressure and air density as one travels to higher altitude. At about 18000 feet (5.48 km), the pressure is 500 millibars, about half that at sea level.
_
Air pressure is related to density of air and density is related to temperature of air. Warm air is less dense than cooler air because the gas molecules in warm air have a greater velocity and are farther apart than in cooler air. So following gas laws, warm air has greater volume and lesser pressure than cool air for the same number of gas molecules. So, while the average altitude of the 500 millibars level is around 18,000 feet (5486 meters) the actual elevation will be higher in warm air than in cold air.
_
Temperature also progressively fall as one travels to higher altitude in troposphere but again increases in stratosphere due to ozone layer absorbing solar radiation. In the troposphere the source of heat is the surface of the Earth, as well as particles in the air, which absorb heat and energy from the Sun, and release it back into the atmosphere. The further away you get from that heat source, the cooler the air becomes and therefore in troposphere, air becomes cooler as altitude increases. The gases in this layer also decrease with height and the air becomes thinner as discussed before. As you climb higher, the temperature drops from about 17 degree C to -51 degree C, atmospheric pressure drops from 1013 millibars to 300 millibars and air becomes thinner and less dense. Almost all weather occurs in this region (troposphere).
_
So in a nutshell, the air pressure is related to its density, which is related to the air’s temperature and height above the Earth’s surface. As altitude increases, fewer air molecules are present and that is the rate limiting step. Even though at an altitude, temperature is low with cool air, it cannot increase atmospheric pressure as fewer gas molecules are present at height. Therefore, atmospheric pressure always decreases with increasing height. If you’ve ever been to the top of a tall mountain, you may have noticed that your ears pop and you need to breathe more often than when you’re at sea level. As the number of molecules of air around you decreases, the air pressure decreases. This causes your ears to pop in order to balance the pressure between the outside and inside of your ear. Since you are breathing fewer molecules of oxygen, you need to breathe faster to bring the few molecules there are into your lungs to make up for the deficit.
_
For every 1,000 feet you ascend the atmospheric pressure decreases by 4%. The pressure drops about 1 inch of mercury for each 1,000 feet altitude gain. If you’re using millibars, the correction is 1 millibar for each 8 meters of altitude gain.
_
Meteorology (from the Greek meteõros meaning “high in the air”) is defined as the science of atmospheric phenomena and processes. The synoptic scale in meteorology (also known as large scale or cyclonic scale) is a horizontal length scale of the order of 1000 kilometers (about 620 miles) or more. Most high and low pressure areas seen on weather maps such as surface weather analyses are synoptic-scale systems. Mesoscale meteorology is the study of weather systems smaller than synoptic scale systems but larger than microscale. Horizontal dimensions generally range from around 5 kilometers to several hundred kilometers. Examples of mesoscale weather systems are sea breezes, squall lines, and mesoscale convective complexes. Microscale meteorology is the study of short-lived atmospheric phenomena smaller than mesoscale, about 1 km or less and they study features generally too small to be depicted on a weather map.
_
Weather and climate:
Weather denotes the short-termed (hours to a few days up to a week or so) behavior of the atmosphere, generally with the connotation of applying to local or regional parts of the Earth’s globe, as it varies in the conditions used to describe weather – fair, rain, warm, windy, etc. Thus, each place is said to have a set of particular conditions, which tend to change over short time spans, that affected people describe as the weather for the day or perhaps as long as the next week. Climate refers to much longer time frames and describes the common characteristics of weather in broader parts of the Earth’s globe. It applies to wider regions and depends on geographic location, physiographic conditions, time of year, and other factors. Climate is thus tied to 1) the larger, longer variation in typical or average weather in a region determined by the seasons – which in turn depend on the location of the Earth, with its tilted axis, as it rotates around the Sun in an annual cycle; and 2) the range of conditions expressed in day to day weather variations and extremes in such properties as temperatures, extent of cloud cover, and duration and types of rainfall/snowfall. Weather and climate are both used interchangeably sometimes but differ in their measure of time, and trends that affect them.
_
Wind:
Wind is defined as the horizontal motion of air across the surface of the Earth, described by convention, as the direction from which the wind is blowing. Consequently winds blowing from the north are called northerly winds and westerly wind comes from west. However, most winds also have a vertical component, which is normally much smaller, but will gain some importance under certain conditions. Wind speed is commonly measured in knots (kt), kilometers or miles per hour (kph or mph). The international SI unit for wind speed is given in meters per second.
_
Air movement:
An air movement within the Earth’s atmospheric circulation is called planetary winds. As generalities: air moves along pressure gradients from conditions of high pressure to lower pressure; warm air rises, cold air sinks; movements of air are also influenced by the motion of the Earth itself, as well as other forces. The dominant cause behind movement of air in near horizontal conditions is the pressure gradient. If a high pressure zone is far away from a low pressure zone, the pressure gradient is small so that the wind moving towards the low moves more slowly than when the these zones are close-spaced (higher gradient and faster wind flow). It cannot be overemphasized that high and low pressures are relative terms. There’s no set number that divides high and low pressure. Atmospheric pressure differences normally originate from a temperature (and thus density) difference between different regions due to differential heating and cooling of the earth’s surface. In addition, changes in wind speed and direction are related to the Earth’s rotation via the Coriolis Effect (vide infra) and to surface friction.
_
Cloud:
Cloud means a structure formed in the lower atmosphere by condensed water vapor and ice particles. Clouds form when air is cooled to its dewpoint which is a temperature where air reaches saturation with water vapor. Air can reach saturation in a number of ways. The most common way is through lifting. As a bubble or parcel of air rises, it moves into an area of lower pressure (pressure decreases with height). As this occurs the parcel expands. This requires energy, or work, which takes heat away from the parcel. So as air rises it cools. This is called an adiabatic process. The rate at which the parcel cools with increasing elevation is called the “lapse rate”. The lapse rate of unsaturated air (air with relative humidity <100%) is 5.4°F per 1000 feet (9.8°C per kilometer). This is called the dry lapse rate. This means for each 1000 feet increase in elevation, the air temperature will decrease 5.4°F. Since cold air can hold less water vapor than warm air, some of the vapor will condense onto tiny clay and salt particles called condensation nuclei in order to form a cloud. The reverse is also true. As a parcel of air sinks it encounters increasing pressure so it is squeezed inward. This adds heat to the parcel so it warms as it sinks. Warm air can hold more water vapor than cold air, so clouds tend to evaporate as air sinks. Air can also get saturated by adding water vapor to the air. The main ways water vapor is added to the air are: wind convergence over water or moist ground into areas of upward motion, precipitation or virga falling from above, daytime heating evaporating water from the surface of oceans, water bodies or wet land, transpiration from plants, and cool or dry air moving over warmer water.
_
Air masses and fronts:
An air mass is a large body of air with generally uniform temperature and humidity. The area from which an air mass originates is called a “source region.” Air masses can control the weather for a relatively long time period: from a period of days, to months. Most weather occurs along the periphery of these air masses at boundaries called fronts. Fronts are classified as to which type of air mass (cold or warm) is replacing the other. For example, a cold front demarcates the leading edge of a cold air mass displacing a warmer air mass. A warm front is the leading edge of a warmer air mass replacing a colder air mass. If the front is essentially not moving (i.e. the air masses are not moving) it is called a stationary front.
_
Atmospheric circulation:
The heat source for our planet is the sun. Energy from the sun is transferred through space and through the earth’s atmosphere to the earth’s surface. This energy warms the earth’s surface and atmosphere. Air in the atmosphere acts as a fluid and therefore amenable to heat transfer by convection. The sun’s radiation strikes the ground, thus warming the rocks. As the rock’s temperature rises due to conduction, heat energy is released into the atmosphere, forming a bubble of air which is warmer than the surrounding air. This bubble of air rises into the atmosphere. As it rises, the bubble cools with the heat contained in the bubble moving into the atmosphere. As the hot air mass rises, the air is replaced by the surrounding cooler denser air, what we feel as wind. These movements of air masses can be small in a certain region, such as local cumulus clouds, or large cycles in the troposphere, covering large sections of the earth. Convection currents are responsible for many weather patterns in the troposphere. Convection is the principle motor of cloud formation and circulation on all scales – including the atmosphere’s general circulation as warm moist air is going upwards and colder, drier and denser air will be sinking downwards.
_
The weather in the tropics is basically hot and humid. This is primarily due to the earth receiving more solar radiation than it re-radiates back to space. This excessive heating generates weather that can impact any other location on the globe. This energy imbalance drives the circulation of the atmosphere. The picture below shows how tropics receive more solar energy than poles.
_
The atmosphere is kept in motion and develops its weather/climate characteristics primarily through energy input as heat (as a term this refers to quantities of thermal energy). Heat actions produce various temperatures (a measure of the degree of atomic/molecular motions through heat inputs and withdrawals). This temperature variations give rise to differences in pressure (hence development of pressure gradients that drive gases into motions that include wind) and volumes. It must be emphasized that heat from any source (sun and/or earth surface) warms up atmospheric gases (air) resulting in increased volume and reduced pressure. In other words, warm air has lower pressure than cool air. Air being a fluid moves across pressure gradient. So wind will flow from cool air to warm air. The dominant source of heat affecting the atmosphere come from solar irradiation (insolation) and heat added from internal Earth flow adds a small amount to the land/ocean bottom surface. Of the total solar radiation, 31 % is reflected by the ground, air molecules, clouds, and dust, (reflected radiation); the atmosphere’s dust and clouds absorb 21% and the remaining 48% is absorbed by land and ocean surfaces. Of great importance is the geographic distribution of net radiation. The excess of radiation at low latitudes results from radiation coming in faster than it goes out; the converse (slower in, faster out) takes over at the higher latitudes. This build-up of heat around the equator and depletion in Polar Regions is responsible for the pole-ward flow (transport) of heat energy to equalize the total energy distribution. That is one of the driving forces in the circulation patterns that mark Earth’s atmosphere. This picture below shows that the low latitudes in the course of an annual seasonal cycle gain more heat whereas the higher latitudes loose heat.
_
What drives the atmospheric circulation?
The short answer is: Differential heating.
That means the heating of the sun is most intensive in the tropics, but least intensive in the Polar Regions. This means that the air in the tropics is much warmer than the air in the Polar Regions. This means that the air at the equator should be less dense (low pressure) than the air at the poles (high pressure). But such a situation is unstable. The cold air should flow under the warm air. So we might envision an equilibrium situation where at the earth’s surface cold air flows towards the equator, where it is heated and it rises up in the atmosphere, and aloft it flows back to the Polar Regions. Flow like this is called a thermally direct circulation. The global circulation would be simple (and the weather boring) if the Earth did not rotate; the rotation was not tilted relative to the sun, and had no water.
_
However, since the earth rotates, the axis is tilted, and there is more land mass in the northern hemisphere (NH) than in the southern hemisphere (SH), the actual global pattern is much more complicated. Atmospheric circulation is the large-scale movement of air through the troposphere, and the means (with ocean circulation) by which heat is distributed around the Earth. The large-scale structure of the atmospheric circulation varies from year to year, but the basic structure remains fairly constant as it is determined by the Earth’s rotation rate and the difference in solar radiation between the equator and poles.
Latitudinal circulation is the consequence of the fact that incident solar radiation per unit area is highest at the equator, and decreases as the latitude increases, reaching its minimum at the poles. It consists of three convection cells, the Hadley cell, the polar vortex and the Ferrel cell. Let me discuss these cells in vertical view. The Hadley cell is characterized by rising air at the equator. Once aloft, the air flows poleward to about latitude 30 (S and N) where it sinks to the surface and there is a return equatorward surface flow. This is a thermally direct circulation. The polar cell has rising air at the polar front, flow aloft to the pole, where the air sinks and returns at the surface back to the polar front. The Ferrel cell (mid-latitude cell) has descending at about latitude 30, poleward surface flow to about 60 degrees (the polar front) where the air rises and returns equatorward aloft. This is not a thermally direct cell. Now the discussion shifts from vertical to horizontal view. In the Hadley cell we have surface air flowing to equatorward. Deflection by the Coriolis force (CF) leads to an easterly flow. These are the trade-winds. Easterly means from east to west…Easterly in both hemispheres! (CF is to right in NH and to left in SH). In the Ferrel cell the surface flow is poleward, and the deflection leads to the westerly winds, the mid-latitude westerlies. In the polar cell the flow is equatorward at the surface which gives rise to easterly winds. (the polar easterlies).
_
Longitudinal circulation, on the other hand, comes about because water has a higher specific heat capacity than land and thereby absorbs and releases more heat, but the temperature changes less than land. This effect is noticeable; it is what brings the sea breeze, air cooled by the water, ashore in the day, and carries the land breeze, air cooled by contact with the ground, out to sea during the night. Longitudinal circulation consists of two cells, the Walker circulation and El Niño / Southern Oscillation.
The above picture shows direction of wind from cooler sea to warmer land during day.
_
It is the differences in heat distribution on a geographic and temporal basis that gives rise to the vicissitudes of weather and climate we observe on our planet. Earth is characterized by its seasons, which are extended periods in which weather and climate have different average temperature, rainfall, and storm frequency and type conditions. The reasons for seasons are mainly twofold: 1) the position of the Earth relative to the Sun during its annual 365.24 day revolution around the Sun; 2) the 23.5 degree tilt of the Earth’s axis of rotation. The first factor shown here has a much smaller effect than the second; distances from the Sun vary by less than 10% so that insolation intensity is not great but has some influence. This variation in heat content over the seasons affects the range of temperatures in marine waters, as shown below for several different oceans. In general, surface sea water experiences a minimum of temperature variations in low latitudes and a much high range of change as the Polar Regions are approached.
_
The oceans act as major heat reservoirs that have significant effects on the roles that heat and radiation play in generating meteorological patterns. The oceans experience differential heating, generally being warmer at the surface. Cooler water being denser will sink. Since there are temperature differences within the oceans at various depths, these give rise to current movements. The weather can not be discussed without discussing ocean because the ocean has huge ability absorb, store, and release heat into the atmosphere which often directly affects us. In fact, just the top 10 feet of the ocean surface contains more heat than our entire atmosphere. Also, nearly 71% of the earth’s surface is covered by ocean and more than 97% of all our water is contained in it. Also, more than one-half of the world’s population lives within 60 miles (100 km) of the ocean. The weather has effect on ocean and the ocean has effect on weather. Major climate events, such as El Niño, result from ocean temperature changes. These temperature changes then have impacts on weather events such as hurricanes, typhoons, floods and droughts which, in turn, affect the prices of fruits, vegetables and grains.
| Ocean | Surface Area miles2 |
Surface Area kilometers2 |
Of all oceans |
| Pacific | 64,000,000 | 166,000,000 | 45.0% |
| Atlantic | 31,600,000 | 82,000,000 | 22.2% |
| Indian | 28,400,000 | 73,600,000 | 20.0% |
| Southern | 13,523,000 | 35,000,000 | 9.5% |
| Arctic | 4,700,000 | 12,173,000 | 3.3% |
_
Coriolis force (CF):
Coriolis force (effect) is an inertial force described by the 19th-century French engineer-mathematician Gustave-Gaspard Coriolis in 1835. The effect of the Coriolis force is an apparent deflection of the path of an object that moves within a rotating coordinate system. The object does not actually deviate from its path, but it appears to do so because of the motion of the coordinate system. The Earth is spinning on its rotational axis at a rate approximating 1700 kilometers per hour (1062 mph). The speed diminishes pole-ward, going to just above zero immediately beyond the point where the axis can be imagined to emerge at the surface. The rotational speed of earth at equator and mind-latitude is indicated in the picture below.
_
The Coriolis Effect is most apparent in the path of an object moving longitudinally. On the Earth an object that moves along a north-south path, or longitudinal line, will undergo apparent deflection to the right in the Northern Hemisphere and to the left in the Southern Hemisphere. There are two reasons for this phenomenon: first, the Earth rotates eastward; and second, the tangential velocity of a point on the Earth is a function of latitude (the velocity is essentially zero at the poles and it attains a maximum value at the Equator). Thus, if a cannon were fired northward from a point on the Equator, the projectile would land to the east of its due north path. This variation would occur because the projectile was moving eastward faster at the Equator than was its target farther north. Similarly, if the weapon were fired toward the Equator from the North Pole, the projectile would again land to the right of its true path. In this case, the target area would have moved eastward before the shell reached it because of its greater eastward velocity. The Coriolis deflection is therefore related to the motion of the object, the motion of the Earth, and the latitude. There will be no Coriolis Effect if an object moves on equator because all objects on equator will have the same rotational speed of earth (1700 km/h). So if a cannon were fired eastward or westward from a point on equator, the projectile would not deviate from intended path. The picture below shows Coriolis deflection to the right of the path from North Pole to equator.
_
The differential velocities associated with the rotation of earth give rise to an effect on the air known as the Coriolis force (effect) in meteorology. Not a directly applied force as such, it nevertheless acts on moving air to deflect their paths in a systematic manner. In the northern hemisphere, air moving from a high pressure zone around the poles to lower pressures at the equator would move in a straight line if there were no rotation but because of the rotation, the air moves to the right of its straight path as it moves equatorward. So the Coriolis-induced deflections of wind are to the right of its path in the northern hemisphere and to the left in the southern hemisphere. The reason for the reversal – right or left – is just the consequence of motion direction in the two hemispheres. Those in the southern hemisphere are in a sense upside down relative to those in the north so the perception of motions is reversed. Imagine you hovering exactly over the North Pole. The rotation of the earth, as seen from the vantage point of the North Pole, is counterclockwise. Imagine standing at the South Pole and seeing the rotation of the earth. The earth would appear to rotate in a clockwise direction.
_
The basic idea behind the Coriolis Effect is that the resultant wind direction is a product of two competing forces. First, the Pressure Gradient Force (high to low) is acting in a North-South direction and the Coriolis force (not as strong) in east to west direction. The Net Direction of Motion is the resultant of vector addition of these two forces. Let us summarize this concept for in the picture below which shows counterclockwise inspiral in northern hemisphere and clockwise inspiral in southern hemisphere of a cyclone and vice versa in anticyclone (vide infra).
_
Why do tropical cyclones’ winds rotate counter-clockwise in the Northern Hemisphere and clockwise in Southern hemisphere?
When a pressure gradient starts form north of the equator, the surface winds will flow inward trying to fill in the low and will be deflected to the right of its path due to Coriolis Effect and a counter-clockwise rotation will be initiated. The opposite (a deflection to the left of its path and a clockwise rotation) will occur south of the equator. However, this force is too tiny to effect rotation in, for example, a football game where a ball is kicked from one player to another.
_
The principal features of weather systems that affect land & sea, humans, animals, and vegetation thereon are winds and precipitation. Most weather of consequence to people occurs in storms. These may be local in origin but more commonly are carried to locations in wide areas along pathways followed by active air masses consisting of Highs and Lows. The key ingredient in storms is water, either as a liquid or as a vapor. The vapor acts like a gas and thus contributes to the total pressure of the atmosphere, making up a small but vital fraction of the total, as seen in the picture below.
Water vapor in the air will vary in amount depending on sources quantities, processes involved, and air temperature.
_
The picture below shows mean atmospheric water content.
_
Precipitation:
Heat, mainly as solar irradiation but with some contributed by the Earth and human activity, and some from change of state processes, will cause some water molecules either in water bodies (oceans, lakes, rivers) or in soils to be excited thermally and escape from their sources. This is called evaporation; and if water is released from trees and other vegetation the process is known as evapotranspiration. The evaporated water, or moisture, that enters the air is responsible for a state called humidity. When a parcel of air attains or exceeds relative humidity of 100% condensation will occur and water in some state other than vapor will begin to form as some type of precipitation. One familiar form is dew, which occurs when the saturation temperature for some quantity of moisture reaches a temperature low at the surface at which condensation sets in, leaving the moisture to coat the ground (especially obvious on lawns). The other types of precipitations are rain, mist, glaze, snow, hail etc.
_
The three general conditions in an atmospheric system that led to local to widespread precipitation are 1) Convectional; 2) Orographic; and 3) Cyclonic.
_
Thunderstorm:
The classical example of convectional precipitation is a thunderstorm. Thunderstorms originate when intense heating causes a parcel of moist air to rise from the earth’s surface into upper levels of the atmosphere, a process called convection. Thunderstorms are therefore also known as convective storms.
A thunderstorm is a type of storm that generates lightning and the attendant thunder. It is normally accompanied by heavy precipitation. Thunderstorms occur throughout the world, with the highest frequency in tropical rainforest regions where there are conditions of high humidity and temperature along with atmospheric instability. These storms occur when high levels of condensation form in a volume of unstable air that generates deep, rapid, upward motion in the atmosphere. The heat energy creates powerful rising air currents that swirl upwards to the tropopause. Warm, moist air rises as an unstable air mass and cools adiabatically. The rising parcel is commonly called a “thermal”. As it reaches cooler air, and lower pressures, condensation begins and often yields numerous raindrops. These are eventually too heavy for the growing cloud (cumulonimbus) and fall to Earth in torrents. The updrafts of wind recirculate and windflow on the ground may be turbulent and violent. After the storm has spent its energy, the rising currents die away and downdraughts break up the cloud. Individual storm clouds can measure 2–10 km across. An average thunderstorm lasts for few hours and it has wind speed between 10 to 30 knots. They occur most frequently in the tropics but are also common in the mid-latitudes. There are four types of thunderstorms: single-cell, multicell cluster, multicell lines, and supercells. Supercell thunderstorms are the strongest and may rotate and are associated with severe weather phenomena. A thunderstorm is classified as a mesocyclone when cyclonically rotating air is detected within it and it is these rotating thunderstorms which generate tornadoes. Thunderstorms are often accompanied by severe weather and lightning is among the biggest weather killers. However, less then one percent of all thunderstorms produce hail bigger than the size of a golf ball and/or strong downburst winds. Only a small fraction of severe storms actually produce tornadoes or waterspouts. At any given moment, it is estimated there are 2000 thunderstorms in progress around the world. It is estimated that there are as many as 40,000 thunderstorm occurrences each day world-wide. This translates into an astounding 14.6 million occurrences annually!
_
The picture below it is an actual photograph of a supercell storm that displays a prominent anvil cloud at its top which occurs when air of different properties is encountered.
_
Convective thunderstorms are the most common type of atmospheric instability that produces lightning followed by thunder. As seen in below image, lightning is one of the most spectacular phenomena witnessed in storms.
A typical lightning bolt can attain strength up to 30 million volts and a current as much as 10000 amperes. It can cause air temperatures to reach 10000°C. But a bolt’s duration is extremely short (fractions of a second). Although it can kill people as bolt strikes, some can survive. A lightning bolt is the discharge of electrons (negative charges) that build up in a cloud. Both negative and positive charges accumulate from processes that derive them from the ground or by ionization of the air. With both charges present in a thundercloud (the thunder itself occur as superheated air rushes back into the bolt’s path), much lightning is discharged in and remains within the cloud. But if the Earth’s surface is induced to have a surplus of + (positive) charges, as when – (negative) charges are drawn off and carried upwards, the bolt may strike some spot on the ground if the potential difference is great enough.
_
The cyclone:
The word cyclone has been derived from Greek word ‘cyclos’ which means ‘coiling of a snake’. Cyclone is defined as a large-scale, atmospheric wind-and-pressure system characterized by low pressure at its center and by circular wind motion, counterclockwise in the Northern Hemisphere and clockwise in the Southern Hemisphere. A cyclone may technically refer to any cyclonically rotating circulation. A cyclone is any mass of air that spirals around a low pressure center. It is an organized collection of thunderstorms embedded in a swirling mass of air.
_
Polar-Front theory of cyclone formation (the Norwegian model):
Norwegian meteorologists studies cyclone formation and development during World War I, using mainly surface observations. They formulated what became known as the polar-front theory of cyclone formation. According to them, stages of cyclone development are as follows.
1) Front develops (known as frontogenesis).
2) A wave develops on the front.
3) A cyclonic circulation (low-pressure) becomes established.
4) The cold front overtakes the warm front, beginning the occlusion.
5) The occluded front continues to develop as the cyclone reaches maturity.
The lifetime of the cyclone is roughly 3 – 5 days (one week) from the initial wave to the dissipating stage.
_
In meteorology, a cyclone is an area of closed, circular fluid motion rotating in the same direction as the Earth. This is usually characterized by inward spiraling winds that rotate counter clockwise in the Northern Hemisphere and clockwise in the Southern Hemisphere of the Earth. Most large-scale cyclonic circulations are centered on areas of low atmospheric pressure. The largest low-pressure systems are cold-core polar cyclones and extratropical cyclones which lie on the synoptic scale. Warm-core cyclones such as tropical cyclones, mesocyclones, and polar lows lie within the smaller mesoscale. Subtropical cyclones are of intermediate size. Cyclogenesis describes the process of cyclone formation and intensification. Structurally, tropical cyclones have their strongest winds near the earth’s surface, while extra-tropical cyclones have their strongest winds near the tropopause – about 8 miles (12 km) up. These differences are due to the tropical cyclone being “warm-core” in the troposphere (below the tropopause) and the extra-tropical cyclone being “warm-core” in the stratosphere (above the tropopause) and “cold-core” in the troposphere. “Warm-core” refers to being relatively warmer than the environment at the same pressure surface (“pressure surfaces” are simply another way to measure height or altitude). A warm core cyclone has a profile of cyclone strength that decreases with height. A cold core cyclone has a profile of cyclone strength that increases with height.
_
The conventional types of cyclones can be labeled within the phase space where four generic quadrants of cyclone type result:
1) Frontal/asymmetric warm-core;
2) Nonfrontal/symmetric warm-core;
3) Nonfrontal/symmetric cold-core and
4) Frontal/asymmetric cold-core.
Picture below shows general locations of cyclones within phase space.
Tropical cyclone is warm core non-frontal symmetrical weather system.
_
Cyclone energetics:
The energy that drives the cyclone is derived from the temperature contrast across the front. It is converting potential energy to kinetic energy. After the cyclone has mixed away the temperature contrast across the front there is no longer any potential energy available to keep the cyclone going, so it dissipates. Note that the cyclone is serving to reduce the latitudinal heat imbalance by transporting warm air toward the pole and cold air toward the equator.
_
Types of cyclones:
There are six main types of cyclones: Polar cyclones, Polar lows, Extratropical cyclones, Subtropical cyclones, Tropical cyclones, and Mesocyclones.
1) Polar cyclones:
A polar, sub-polar, or Arctic cyclone (also known as a polar vortex) is a vast area of low pressure which strengthens in the winter and weakens in the summer. A polar cyclone is a low pressure weather system, usually spanning 1,000 kilometers to 2,000 kilometers, in which the air circulates in a counterclockwise direction in the northern hemisphere, and a clockwise direction in the southern hemisphere. When the polar vortex is strong, westerly flow descends to the Earth’s surface. When the polar cyclone is weak, significant cold outbreaks occur.
_
2) Polar lows:
A polar low is a small-scale, short-lived atmospheric low pressure system (depression) that is found over the ocean areas poleward of the main polar front in both the Northern and Southern Hemispheres. During winter, when cold-core lows with temperatures in the mid-levels of the troposphere reach -45 °C (-49 °F) move over open waters, deep convection forms which allows polar low development to become possible. The systems usually have a horizontal length scale of less than 1,000 kilometers and exist for no more than a couple of days.
_
3) Extratropical cyclone:
An extra-tropical cyclone is a storm system that primarily gets its energy from the horizontal temperature contrasts that exist in the atmosphere. Extra-tropical cyclones (also known as mid-latitude or baroclinic storms) are low pressure systems with associated cold fronts, warm fronts, and occluded fronts. An extratropical cyclone is a synoptic scale low pressure weather system that has neither tropical nor polar characteristics, being connected with fronts and horizontal gradients in temperature and dew point otherwise known as “baroclinic zones”.The descriptor “extratropical” refers to the fact that this type of cyclone generally occurs outside of the tropics, in the middle latitudes of the planet. These systems may also be described as “mid-latitude cyclones” due to their area of formation and are often described as “depressions” or “lows” by weather forecasters and the general public. These are the everyday phenomena which along with anticyclones drive the weather over much of the Earth. Mid-latitude or frontal cyclones are large traveling atmospheric cyclonic storms up to 2000 kilometers in diameter with centers of low atmospheric pressure. An intense mid-latitude cyclone may have a surface pressure as low as 970 millibars, compared to an average sea-level pressure of 1013 millibars. Normally, individual frontal cyclones exist for about 3 to 10 days moving in a generally west to east direction. Frontal cyclones are the dominant weather event of the Earth’s mid-latitudes forming along the polar front. Mid-latitude cyclones are the result of the dynamic interaction of warm tropical and cold polar air masses at the polar front. This interaction causes the warm air to be cyclonically lifted vertically into the atmosphere where it combines with colder upper atmosphere air. This process also helps to transport excess energy from the lower latitudes to the higher latitudes. Its direction of movement is generally eastward. Mid-latitude cyclones cause far less damage than tropical cyclones or hurricanes.
The picture below shows typical paths of mid-latitude cyclones are represented by black arrows. This image also shows the typical paths traveled by subtropical hurricanes (green arrows).
_
4) Subtropical cyclone:
A subtropical cyclone is a weather system that has some characteristics of a tropical cyclone and some characteristics of an extratropical cyclone. They can form between the equator and the 50th parallel. Since they form from initially extratropical cyclones which have colder temperatures aloft than normally found in the tropics, the sea surface temperatures required for their formation are lower than the tropical cyclone threshold by three degrees Celsius, or five degrees Fahrenheit, lying around 23 degrees Celsius. This means that subtropical cyclones are more likely to form outside the traditional bounds of the hurricane season. The maximum recorded wind speed for a subtropical storm is 33 m/s (119 km/h, 64 knots, or 74 mph), also the minimum for a hurricane. Subtropical cyclones in the Atlantic basin are classified by the maximum sustained surface winds: less than 18 m/s (34 kt, 39 mph) – “subtropical depression”; greater than or equal to 18 m/s (34 kt, 39 mph) – “subtropical storm”. Although subtropical storms rarely have hurricane-force winds, they may become tropical in nature as their cores warm.
_
5) Tropical cyclone:
The term “tropical” refers to both the geographic origin of these systems, which form almost exclusively in tropical regions of the globe. Tropical cyclones, in contrast to extratropical cyclone, typically have little to no temperature differences across the storm at the surface and their winds are derived from the release of energy due to cloud/rain formation from the warm moist air of the tropics. A tropical cyclone feeds on heat released when moist air rises, resulting in condensation of water vapor contained in the moist air. Depending on their location and strength, tropical cyclones are referred to by other names, such as hurricane, typhoon or simply as a cyclone (vide infra).
_
6) Mesocyclone:
A Mesocyclone is a vortex of air, 2.0 kilometers to 10 kilometers in diameter (the mesoscale of meteorology), within a convective thunderstorm. Air rises and rotates around a vertical axis, usually in the same direction as low pressure systems in both northern and southern hemisphere. They are most often cyclonic, that is, associated with a localized low-pressure region within a severe thunderstorm. Such storms can feature strong surface winds and severe hail. Mesocyclones often occur together with updrafts in supercells, where tornadoes may form. The mesocyclone is the “mother of tornadoes.” About 1700 mesocyclones form annually across the United States, but only half produce tornadoes.
_
However, Cyclones can undergo transition between extratropical, subtropical, and tropical phases under the right conditions. An extratropical cyclone is a storm that derives energy from horizontal temperature differences, which are typical in higher latitudes. A tropical cyclone can become extratropical as it moves toward higher latitudes and if its energy source changes from heat released by condensation to differences in temperature between air masses; additionally, although not as frequently, an extratropical cyclone can transform into a subtropical storm, and from there into a tropical cyclone. Although subtropical cyclones rarely have hurricane-force winds, they may become tropical in nature as their cores warm. Many times these subtropical storms transform into true tropical cyclones. A recent example is the Atlantic basin’s Hurricane Florence in November 1994 which began as a subtropical cyclone before becoming fully tropical. Conversely, there has been at least one occurrence of tropical cyclones transforming into a subtropical storm (e.g. Atlantic basin storm 8 in 1973). However, from an operational standpoint, a tropical cyclone is usually not considered to become subtropical during its extratropical transition. The transformation of tropical cyclone into an extra-tropical cyclone (and vice versa) is currently one of the most challenging forecast problems.
_
Tropical cyclone (TC):
Introduction:
A tropical cyclone is the generic term for a low pressure system over tropical or sub-tropical waters, with organized convection (i.e. thunderstorm activity) and winds at low levels circulating either anti-clockwise (in the northern hemisphere) or clockwise (in the southern hemisphere). A tropical cyclone is a rotational low pressure system in tropics when the central pressure falls by 5 to 6 hPa from the surrounding. The whole storm system may be five to six miles high and 300 to 400 miles wide, although sometimes can be even bigger. It typically moves forward at speeds of 10-15 mph, but can travel as fast as 40 mph. At its very early and weak stages it is called a Tropical Depression. When the winds reach 39 mph, it is called a Tropical Storm. If the wind should reach 74 mph or more, the tropical storm is called a Hurricane in the Atlantic and the north-east Pacific or a Typhoon in the north-west Pacific. In other parts of the world, such as the Indian Ocean and South Pacific the term Cyclone or Tropical Cyclone is used.
_
The World Meteorological Organization (WMO) defines a tropical cyclone as a non-frontal synoptic scale cyclone originating over tropical or subtropical water with well organized convection and definite cyclonic surface wind circulation.
Hurricane Isabel (2003) as seen from orbit during Expedition 7 of the International Space Station. The eye, eyewall and surrounding rainbands that are characteristics of tropical cyclones are clearly visible in this view from space.
_
Why do tropical cyclones form?
The sun heats the tropical areas more than the Polar Regions. If there were no wind, then the tropics would keep getting hotter and hotter, and the poles would get colder and colder. The atmosphere’s basic function is to redistribute heat from the equator to the poles, and tropical cyclones are one mechanism by which this occurs. However it is still quite remarkable that such a thing as a tropical cyclone should arise. It has been said that if we had not actually observed tropical cyclones, then, despite all we know about the physics of the atmosphere, we would never have guessed at their existence.
_
Tropical Cyclones are formed over the ocean in the area around the equator, between the Tropic of Cancer and the Tropic of Capricorn. In order for a cyclone to form, the ocean waters need to be warm, at least 26.5°C. Above the warm ocean, water evaporates and form clouds. If there is low air pressure where the clouds are formed, it pulls them in and they begin to rotate. It is the Earth’s rotation and spinning on its axis that causes the cyclone’s clouds to rotate. Clouds will continue to form and begin spinning more. This is the stage when it can develop into a mature cyclone, or lose its momentum. Even if it has developed into a mature cyclone, it can still grow in size and increase its wind speed.
_
Tropical cyclones use warm, moist air as fuel. That is why they form only over warm ocean waters near the equator. The warm, moist air over the ocean rises rapidly upward from near the surface and becomes saturated with evaporated moisture. This means that there is less air left at the surface (i.e. low pressure). Air from surrounding areas with higher air pressure pushes in to the low pressure area to try to equalize the pressure. Then that “new” air becomes warm and moist and rises, too. As the warm air continues to rise, the surrounding air swirls in to take its place. Trade winds cause the moist air to spin inwards. As the warmed, moist air rises and cools off, the water in the air forms towering cumulonimbus thunderclouds (because there is a huge amount of condensation). The whole system of clouds and wind spins and grows, fed by the ocean’s heat and water evaporating from the surface. The picture below shows a cross section of tropical cyclone being formed above ocean.
_
Storms that form north of the equator spin counterclockwise. Storms south of the equator spin clockwise. As the storm system spins faster and faster, an eye forms in the centre. It is very calm and clear in the eye, with very low air pressure. Higher pressure air from above flows down into the eye.
_
Traditionally, areas of tropical cyclone formation are divided into seven basins. The Northwest Pacific is the most active and the north Indian the least active. An average of 86 tropical cyclones of tropical storm intensity (>34 kt) form annually worldwide, with 47 reaching hurricane/typhoon strength (>64 kt) , and 20 becoming intense tropical cyclones (at least of Category 3 intensity on the Saffir-Simpson Hurricane Scale). Most (87%) form within 20° of the Equator. It’s important to remember that only 11% of all hurricanes occur in the Atlantic, the rest are in the Pacific and Indian Oceans.)
1) Atlantic basin (including the North Atlantic Ocean, the Gulf of Mexico, and the Caribbean Sea)
2) Northeast Pacific basin (from Mexico to about the dateline)
3) Northwest Pacific basin (from the dateline to Asia including the South China Sea)
4) North Indian basin (including the Bay of Bengal and the Arabian Sea)
5) Southwest Indian basin (from Africa to about 100E)
6) Southeast Indian/Australian basin (100E to 142E)
7) Australian/Southwest Pacific basin (142E to about 120W)
_
Each basin has a Regional Specialized Meteorological Centers (RSMC) designated by the World Meteorological Organization and is responsible for tracking and issuing bulletins, warnings, and advisories about tropical cyclones in their designated areas of responsibility. Additionally, there are six Tropical Cyclone Warning Centers (TCWCs) that provide information to smaller regions. Also, countries like the U.S., Canada and Philippines have their own typhoon or hurricane warning center. Each RSMC issues advance list of names of TC arising in its basin.
_
The name of the storm system varies according to the place of origin of these storms.
Cyclones – Storms are called cyclones if they are formed over the Indian Ocean and Southwestern Pacific Ocean i.e. near Africa and Australia.
Typhoon – Storms are called typhoons if they are formed in the Northwestern Pacific Ocean i.e. near Asia.
Hurricane – Storms are referred to as hurricanes if formed in Atlantic Ocean and Eastern Pacific Ocean i.e., near Gulf of Mexico and America.
_
Tropical cyclones emerge in these regions, between 8° and 20° latitude, because of the high humidity, light winds, and warm sea surface temperatures present in these locations. Cyclones and hurricanes can only form when the ocean water is around 80°F (26.5°C) or higher, and these conditions are only common during certain months of the year.
Weather conditions in the central Atlantic and Pacific Oceans are most favorable to hurricane formation during the summer and early fall months, which is why the period of June to October is often referred to as “Hurricane Season” in the northern hemisphere. The opposite situation occurs in the southern hemisphere since the tropical waters off Australia are warmest during the winter and spring months of January to March. Worldwide, tropical cyclone activity peaks in late summer when water temperatures are warmest. Each basin, however, has its own seasonal patterns. On a worldwide scale, May is the least active month, while September is the most active. This can be explained by the greater tropical cyclone activity across the Northern hemisphere than south of the equator. In the Southern Hemisphere, tropical cyclone activity begins in early November and depending on the country ends on either April 30 or May 15. While one would intuitively expect tropical cyclones to peak right at the time of maximum solar radiation (late June for the tropical Northern Hemisphere and late December for the tropical Southern Hemisphere), it takes several more weeks for the oceans to reach their warmest temperatures.
_
Factors:
The formation of tropical cyclones is the topic of extensive ongoing research and is still not fully understood. While six factors appear to be generally necessary, tropical cyclones may occasionally form without meeting all of the following conditions.
_
1) In most situations, water temperatures of at least 26.5 °C (79.7 °F) are needed down to a depth of at least 50 meters (160 ft); waters of this temperature cause the overlying atmosphere to be unstable enough to sustain convection and thunderstorms. Warm waters are necessary to fuel the heat engine of the tropical cyclone. This value is well above 16.1 °C (60.9 °F), the global average surface temperature of the oceans.
_
2) Another factor is rapid cooling with height, which allows the release of the heat of condensation that powers a tropical cyclone. An atmosphere which cools fast enough with height in a way that is potentially unstable to moist convection results in the thunderstorm activity which allows the heat stored in the ocean waters to be liberated for the tropical cyclone development.
_
3) High humidity is needed, especially in the lower-to-mid troposphere; when there is a great deal of moisture in the atmosphere, conditions are more favorable for disturbances to develop. Relatively moist layers near the mid-troposphere (5 km). Dry mid levels are not conducive for allowing the continuing development of widespread thunderstorm activity.
_
4) Low amounts of wind shear are needed, as high shear is disruptive to the storm’s circulation. Low values (less than about 10 m/s) of vertical wind shear between the surface and the upper troposphere. Vertical wind shear is the magnitude of wind change with height. Large values of vertical wind shear disrupt the incipient tropical cyclone and can prevent genesis or, if a tropical cyclone has already formed, large vertical shear can weaken or destroy the tropical cyclone by interfering with the organization of deep convection around the cyclone center.
_
5) Tropical cyclones generally need to form more than 555 km (345 miles) or 5 degrees of latitude away from the equator, allowing the Coriolis Effect to deflect winds blowing towards the low pressure center and creating a circulation. Without the Coriolis force, the low pressure of the disturbance cannot be maintained and Coriolis force is negligible near equator.
_
6) Tropical Cyclones cannot be generated spontaneously. To develop, they require a weakly organized system with sizable spin and low level inflow. A formative tropical cyclone needs a pre-existing system of disturbed weather. Low-latitude and low-level westerly wind bursts associated with the Madden-Julian oscillation can create favorable conditions for tropical cyclogenesis by initiating tropical disturbances.
_
Having these conditions met is necessary, but not sufficient as many disturbances that appear to have favorable conditions do not develop. Recent work has identified that large thunderstorm systems called mesoscale convective complexes (MCC) often produce an inertially stable, warm core vortex in the trailing altostratus decks of the MCC. These mesovortices have a horizontal scale of approximately 100 to 200 km, are strongest in the mid-troposphere (5 km) and have no appreciable signature at the surface. It is hypothesized that genesis of the tropical cyclones occurs in two stages: stage 1 occurs when the MCC produces a mesoscale vortex and stage 2 occurs when a second blow up of convection at the mesoscale vortex initiates the intensification process of lowering central pressure and increasing swirling winds.
_
Tropical cyclones are known to form even when normal conditions are not met. For example, cooler air temperatures at a higher altitude can lead to tropical cyclogenesis at lower water temperatures, as a certain lapse rate is required to force the atmosphere to be unstable enough for convection. A recent example of a tropical cyclone that maintained itself over cooler waters was Epsilon of the 2005 Atlantic hurricane season.
_
Tropical cyclone classification:
Tropical cyclone weather systems are classified into four main stages: tropical disturbance, tropical depressions, tropical storms, and a fourth stage of more intense storms, whose name depends on the region (vide supra). Most hurricanes start life as areas of rough weather and thunderstorms in the tropics. Many of these disturbances, or tropical waves, produce little more than heavy rain and gusty winds. But if a tropical wave succeeds in spinning into a complete circle of winds rotating around an area of low air pressure at its center, it’s given the name tropical depression. When a depression’s peak sustained winds reach 39 miles per hour (34 knots), it’s called a tropical storm. As a tropical system strengthens, its winds spiral inward, concentrating moisture near the center. This spiraling, a result of Earth’s rotation, can’t happen near the equator. To benefit from the curving winds produced by the Coriolis Effect, a storm needs to be at least 300 miles (500 kilometers) north or south of the equator. When a tropical storm maintains wind speeds of at least 74 miles per hour (64 knots), it’s known as a hurricane or typhoon or tropical cyclone or cyclone.
_
Stage 1–Tropical disturbance:
The cluster of thunderstorms that may eventually grow into a hurricane is formed during the first stage of cyclone development known as a tropical disturbance. A tropical disturbance is created when surface winds converge to create instabilities in the atmosphere that trigger the formation of storms. This situation is common near the equator where the easterly trade winds converge to create thunderstorms in a region called the Inter-Tropical Convergence Zone (ITCZ). Most Atlantic hurricanes form from another kind of tropical disturbance called the easterly wave. This disturbance emerges in the tropical easterlies and creates “waves” in the trade winds that travel toward the west. This wave causes the winds to converge together and encourages the formation of thunderstorms on the east side of the wave.
_
Stage 2—Tropical depression:
A tropical disturbance officially enters the second stage of development called a tropical depression once the sustained wind speed within the storm reaches 23 mph (37 km/h). The tropical depression gets its name from the falling surface pressures measured in the region surrounding the storm. The pressure drop occurs as water vapor within the storm condenses into water droplets and releases latent heat into the atmosphere. A tropical depression is an organized system of clouds and thunderstorms with a defined, closed surface circulation and maximum sustained winds of less than 17 meters per second (34 kt) or 39 miles per hour (63 km/h). It has no eye and does not typically have the organization or the spiral shape of more powerful storms. However, it is already a low-pressure system, hence the name “depression”.
_
The addition of heat causes atmospheric gases to expand, so the air inside the depression becomes less dense and rises tens of thousands of feet above the ocean surface. As its altitude increases, the air cools causing more water vapor to condense and release its heat, which draws in yet more air to rise upward. This process repeats itself again and again causing the temperature at the center of the storm to continually increase and driving the surface pressure even lower. As the pressure drops, more low-altitude air that is rich in water vapor is pulled inward to release yet more heat into the center of the storm. This process becomes a chain reaction that pulls hot, humid air from the surface of the ocean up to high altitude where the air becomes cold and water vapor condenses into thick clouds. This growing air mass becomes increasingly dense causing the atmospheric pressure to grow. The increasing pressure pushes the growing mass of clouds outward away from the center to create the spiraling bands of clouds that hurricanes are known for. As the air mass spirals outward, its pressure decreases and the dense air plunges back towards the ocean surface where it started. It now picks up vapor again from the warm waters below and is sucked back into the center of the depression to begin its journey anew. As the cycle continues, the surface pressure at the center drops lower and lower causing the circulation of the air to strengthen and the winds to grow increasingly stronger.
_
Stage 3—Tropical storm:
Once the sustained wind speed increases to 39 mph (63 km/h), the tropical depression enters the third stage of development called a tropical storm. A tropical storm is an organized system of strong thunderstorms with a defined surface circulation and maximum sustained winds between 17 meters per second (34 kt) or 39 miles per hour (63 km/h) and 32 meters per second (63 kt) or 73 miles per hour (116 km/h). At this point, the distinctive cyclonic shape starts to develop, although an eye is not usually present.
_
Stage 4—Tropical cyclone
A hurricane or typhoon or tropical cyclone is a weather system with sustained winds of at least 33 meters per second (64 kt) or 74 miles per hour (119 km/h). A cyclone of this intensity tends to develop an eye, an area of relative calm (and lowest atmospheric pressure) at the center of circulation. The eye is often visible in satellite images as a small, circular, cloud-free spot. Surrounding the eye is the eyewall, an area about 16 kilometers (9.9 miles) to 80 kilometers (50 miles) wide in which the strongest thunderstorms and winds circulate around the storm’s center. Maximum sustained winds in the strongest tropical cyclones have been estimated at about 87 meters per second (168 kt) or 195 miles per hour (312 km/h).
_
Mechanism of tropical cyclone formation:
Tropical cyclones form when the energy released by the condensation of moisture in rising air causes a positive feedback loop over warm ocean waters. Within this area of low pressure the air is heated over the warm tropical ocean. This air rises in discrete parcels, causing thundery showers to form. These showers usually come and go, but from time to time, they group together into large clusters of thunderstorms. This creates a flow of very warm, moist, rapidly rising air, leading to the development of a centre of low pressure, or depression, at the surface. A tropical cyclone’s primary energy source is the release of the heat of condensation from water vapor condensing, with solar heating being the initial source for evaporation. Therefore, a tropical cyclone can be visualized as a giant vertical heat engine supported by mechanics driven by physical forces such as the rotation and gravity of the Earth. In another way, tropical cyclones could be viewed as a special type of mesoscale convective complex, which continues to develop over a vast source of relative warmth and moisture. While an initial warm core system, such as an organized thunderstorm complex, is necessary for the formation of a tropical cyclone, a large flux of energy is needed to lower atmospheric pressure more than a few millibars (0.10 inch of mercury). The inflow of warmth and moisture from the underlying ocean surface is critical for tropical cyclone strengthening. A significant amount of the inflow in the cyclone is in the lowest 1 kilometer (3,300 ft) of the atmosphere.
Condensation of warm moist air leads to higher wind speeds, as a tiny fraction of the released energy is converted into mechanical energy; the faster winds and lower pressure associated with them in turn cause increased surface evaporation and thus even more condensation. Much of the released energy drives updrafts that increase the height of the storm clouds, speeding up condensation. This positive feedback loop, called the Wind-induced surface heat exchange, continues for as long as conditions are favorable for tropical cyclone development. Factors such as a continued lack of equilibrium in air mass distribution would also give supporting energy to the cyclone. The rotation of the Earth causes the system to spin, an effect known as the Coriolis Effect, giving it a cyclonic characteristic and affecting the trajectory of the storm. To continue to drive its heat engine, a tropical cyclone must remain over warm water, which provides the needed atmospheric moisture to keep the positive feedback loop running. This heat is distributed vertically around the center of the storm. Thus, at any given altitude (except close to the surface, where water temperature dictates air temperature) the environment inside the cyclone is warmer than its outer surroundings. When a tropical cyclone passes over land, it is cut off from its heat source and its strength diminishes rapidly.
_
A strong tropical cyclone will harbor an area of sinking air at the center of circulation. If this area is strong enough, it can develop into a large “eye”. The eye results from the rapid rotation of inflowing surface air that rises and spins away from the storm’s center. To replace this outward and upward flow, air from above descends in the central area. The subsidence of this drier air causes warming and evaporates clouds, so that the eye region may be free of clouds. Weather in the eye is normally calm and free of clouds, although the sea may be extremely violent. The eye is the region of lowest surface pressure and warmest temperatures aloft – the eye temperature may be 10°C warmer or more at an altitude of 12 km than the surrounding environment, but only 0-2°C warmer at the surface in the tropical cyclone. The eye is normally circular in shape, and may range in size from 3 kilometers (1.9 miles) to 370 kilometers (230 miles) in diameter. The eyewall is a circle of strong thunderstorms that surrounds the eye; here is where the greatest wind speeds are found, where clouds reach the highest, and precipitation is the heaviest. The heaviest wind damage occurs where a tropical cyclone’s eyewall passes over land. Eyewall replacement cycles occur naturally in intense tropical cyclones. When cyclones reach peak intensity they usually have an eyewall and radius of maximum winds that contract to a very small size, around 10 kilometers (6.2 miles) to 25 kilometers (16 miles). Outer rainbands can organize into an outer ring of thunderstorms that slowly moves inward and robs the inner eyewall of its needed moisture and angular momentum. When the inner eyewall weakens, the tropical cyclone weakens (in other words, the maximum sustained winds weaken and the central pressure rises.) The outer eyewall replaces the inner one completely at the end of the cycle. The storm can be of the same intensity as it was previously or even stronger after the eyewall replacement cycle finishes. The storm may strengthen again as it builds a new outer ring for the next eyewall replacement.
_
CDO is an acronym that stands for “central dense overcast”. This is the cirrus cloud shield that results from the thunderstorms in the eyewall of a tropical cyclone and its rainbands. Before the tropical cyclone reaches very severe cyclonic storm (64 knots,), typically the CDO is uniformly showing the cold cloud tops of the cirrus with no eye apparent. Once the storm reaches the hurricane strength threshold, usually an eye can be seen in either the infrared or visible channels of the satellites. Tropical cyclones that have nearly circular CDO’s are indicative of favorable, low vertical shear environments. Meteorologists always look for development of eye in an evolving cyclone as existence of eye means intense storm.
_
Location of Tropical cyclone:
Essentially they form between the Tropic of Cancer and the Tropic of Capricorn (hence the name ‘tropical’ storm). Most of these systems form between 10 and 30 degrees away of the equator, and 87% form no farther away than 20 degrees of latitude, north or south. Because the Coriolis effect initiates and maintains tropical cyclone rotation, tropical cyclones rarely form or move within about 5 degrees of the equator, where the Coriolis effect is weakest. However rarely, it is possible for tropical cyclones to form within this boundary as Tropical Storm Vamei did in 2001 and Cyclone Agni in 2004.
_
Size, movement and life of Tropical cyclones:
One measure of the size of a tropical cyclone is determined by measuring the distance from its center of circulation to its outermost closed isobar, also known as its ROCI. If the radius is less than two degrees of latitude or 222 kilometers (138 miles), then the cyclone is “very small” or a “midget”. A radius between 3 and 6 latitude degrees or 333 kilometers (207 miles) to 670 kilometers (420 miles) are considered “average-sized”. “Very large” tropical cyclones have a radius of greater than 8 degrees or 888 kilometers (552 miles).
_
Regardless of where they form, hurricanes always move towards the west initially owing to easterly winds and slightly towards poles and spin in a circular direction about the eye, or center, of the storm. Hurricanes and cyclones typically move westward at a speed of about 10 mph (16 km/h) during the early stages of formation. The storms are steered in this direction by the trade winds that occur near the equator and blow towards the west. The Coriolis Effect that determines the direction of the cyclone’s circulation also influences the direction the storm takes. As a storm moves further from the equator, its course is turned towards the poles and the cyclone curves towards the north in the northern hemisphere or towards the south below the equator. Tropical cyclones move westward when equatorward of the subtropical ridge, intensifying as they move. Although tropical cyclones are large systems generating enormous energy, their movements over the Earth’s surface are controlled by large-scale winds—the streams in the Earth’s atmosphere. Tropical systems, while generally located equatorward of the 20th parallel, are steered primarily westward by the east-to-west winds on the equatorward side of the subtropical ridge—a persistent high pressure area over the world’s oceans. However, if the subtropical ridge is weak – often times due to a trough in the jet stream – the tropical cyclone may turn poleward and then recurve back toward the east. On the poleward side of the subtropical ridge, westerly winds prevail thus steering the tropical cyclone back to the east in the mid-latitudes. These westerly winds are the same ones that typically bring extratropical cyclones with their cold and warm fronts from west to east. These winds tend to reverse the direction of the tropical cyclone to an eastward path. Tropical cyclones can also be steered by other systems, such as other low pressure systems, high pressure systems, warm fronts, and cold fronts. As the tropical cyclone moves polewards it picks up forward speed and may reach 30 mph or more. An average tropical cyclone can travel about 300 to 400 miles a day, or about 3,000 miles before it dies out.
_
The average forward speed of a tropical cyclone is dependent on the latitude where the storm is currently. Generally, at less than 30 degrees of latitude, the storms will move at about 20 mph on average. The closer the storm is located the equator, the slower the movement. Some storms will even stall out over an area for an extended period of time. After about 35 degrees North latitude, the storms start to pick up speed. It can not be overemphasized that the speed of the movement of cyclone is different from the wind speed of cyclone.
_
Coriolis Effect in Tropical cyclone movement:
The Earth’s rotation imparts an acceleration known as the Coriolis Effect, Coriolis acceleration, or colloquially, Coriolis force. This acceleration causes cyclonic systems to turn towards the poles in the absence of strong steering currents. The poleward portion of a tropical cyclone contains easterly winds, and the Coriolis Effect pulls them slightly more poleward. The westerly winds on the equatorward portion of the cyclone pull slightly towards the equator, but, because the Coriolis Effect weakens toward the equator, the net drag on the cyclone is poleward. Thus, tropical cyclones in the Northern Hemisphere usually turn north (before being blown east), and tropical cyclones in the Southern Hemisphere usually turn south (before being blown east) when no other effects counteract the Coriolis Effect. The Coriolis Effect also initiates cyclonic rotation, but it is not the driving force that brings this rotation to high speeds – that force is the heat of condensation.
_
Hurricanes usually hit the East coast of the U.S., but never the West coast because of two reasons. The first is that hurricanes tend to move toward the west-northwest after they form in the tropical and subtropical latitudes. In the Atlantic, such a motion often brings the hurricane into the vicinity of the U.S. east coast. In the Northeast Pacific, a west-northwest track takes those hurricanes farther off-shore, well away from the U.S. west coast. The second reason is the difference in water temperatures along the U.S. east and west coasts. Along the U.S. east coast, the Gulf Stream provides a source of warm (> 80°F or 26.5°C) waters to help maintain the hurricane. However, along the U.S. west coast, the ocean temperatures rarely get above the lower 70s, even in the midst of summer. Such relatively cool temperatures are not energetic enough to sustain a hurricane’s strength.
_
The lifetime of a cyclone is determined by how favorable the atmospheric environment is, movement and sea surface temperatures. While most cyclones undergo a life-cycle of 3 to 7 days; some weak ones only briefly reach gale force while others can be sustained for weeks if they remain in a favorable environment. The longest being Hurricane Ginger (1971) that lasted for 30 days.
_
The passage of a tropical cyclone over the ocean causes the upper layers of the ocean to cool substantially, which can influence subsequent cyclone development. This cooling is primarily caused by wind-driven mixing of cold water from deeper in the ocean and the warm surface waters. This effect results in a negative feedback process which can inhibit further development or lead to weakening. Additional cooling may come in the form of cold water from falling raindrops (this is because the atmosphere is cooler at higher altitudes). Cloud cover may also play a role in cooling the ocean, by shielding the ocean surface from direct sunlight before and slightly after the storm passage. All these effects can combine to produce a dramatic drop in sea surface temperature over a large area in just a few days. The ocean’s primary direct response to a hurricane is cooling of the sea surface temperature (SST). When the strong winds of a hurricane move over the ocean they churn-up much cooler water from below. The net result is that the SST of the ocean after storm passage can be lowered by several degrees Celsius (up to 10° Fahrenheit).
_
Cyclone energy:
Great amounts of energy are transferred when warm water is evaporated from tropical seas. This energy is stored within the water vapor contained in moist air. As this air ascends, 90% of the stored energy is released by condensation, giving rise to the towering cumulus clouds and rain. The release of heat energy warms the air locally, causing a further decrease in pressure aloft. Consequently, air rises faster to fill this area of low pressure, and more warm, moist air is drawn off the sea, feeding further energy to the system. Thus, a self-sustaining heat engine is created. Hurricanes can be thought of, to a first approximation, as a heat engine; obtaining its heat input from the warm, humid air over the tropical ocean, and releasing this heat through the condensation of water vapor into water droplets in deep thunderstorms of the eyewall and rainbands, then giving off a cold exhaust in the upper levels of the troposphere (~12 km/8 miles up). It turns out that the vast majority of the heat released in the condensation process is used to cause rising motions in the thunderstorms and only a small portion drives the storm’s horizontal winds. Scientists estimate that an average hurricane releases total heat energy at the rate of 5.2 x 10¹⁹ Joules/day equivalent to about 6.0 x 10¹⁴ Watts. This rate of energy release is equivalent to 70 times the world energy consumption of humans and 200 times the worldwide electrical generating capacity, or to exploding a 10-megaton nuclear bomb every 20 minutes. However, it is estimated that the ratio of the amount of energy released by a hurricane (by creating clouds/rain) to the amount of energy that actually goes to maintaining the hurricane’s spiraling winds is a huge ratio of 400 to 1. That means only 0.25 % of total heat energy of an average hurricane is converted into kinetic energy of circulating winds. That means for an average hurricane having 40 m/s (90 mph) winds on a scale of radius 60 km, the energy generated for wind movement is 1.3 x 10¹⁷ Joules/day or 1.5 x 10¹²Watts. This is equivalent to about half the world-wide electrical generating capacity. Other studies have shown that 3 % of total heat energy of an average hurricane is converted into kinetic energy of circulating winds.
_
The biggest technical impediment of harnessing hurricane energy is that a hurricane’s energy is low grade. It’s abundant, but it’s spread over a tremendous area. For energy to be high grade it should be concentrated, making it easy to gather and use. You would need a field of wind turbines covering dozens of square miles in order for it to be profitable. And it would have to be mobile, so you could intercept landfalling storms, or chase those that change direction. Of course, you have to expend energy to move them around, so you run the risk of losing money on the operation. Also, you would need to find a way of anchoring wind turbines securely without compromising mobility. These are the reasons why we cannot harness hurricane energy.
_
Hurricane categories:
Two researchers named Herbert Saffir and Robert Simpson developed a system called the Saffir-Simpson Scale to predict the level of flooding and damage expected during a hurricane. Officially, the Saffir–Simpson Hurricane Scale is used only to describe hurricanes forming in the Atlantic Ocean and northern Pacific Ocean east of the International Date Line. Other areas use different scales to label these storms, which are called “cyclones” or “typhoons”, depending on the area. The scale consists of five categories based primarily on the hurricane’s maximum sustained winds but also taking into account its central pressure and storm surge. The weakest hurricanes are Category 1 or 2 that do relatively little damage. Categories 3, 4, and 5 are much more powerful, can do intense damage to property, and pose great risk to life. This scale is criticized for being too simplistic; indicating that the scale does not take into account the physical size of a storm, nor the amount of precipitation it produces.
_
Categories of hurricanes and their relative destructive power as per Saffire-Simpson scale.
_
_
In order to avoid confusion between miles per hour and kilometers per hour, the following table is depicted.
| Category | Wind speed | Storm surge |
| mph (km/h) |
feet (meters) |
|
| Five | > 156 (> 250) |
> 18 (> 5.5) |
| Four | 131–155 (210–249) |
13–18 (4.0–5.5) |
| Three | 111–130(178–209) | 9–12 (2.7–3.7) |
| Two | 96–110 (154–177) |
6–8 (1.8–2.4) |
| One | 74–95 (119–153) |
4–5 (1.2–1.5) |
| Tropical storm |
39–73 (63–116) |
0–3 (0–0.9) |
| Tropical depression |
0–38 (0–62) |
0 (0) |
_
The USA uses the Saffir-Simpson hurricane intensity scale for the Atlantic and Northeast Pacific basins. The picture below provides a rough comparison of the USA hurricane scale with Australian tropical cyclone categories. One minute winds have been converted to 10-minute winds using a conversion factor of 0.871.
_
Tropical cyclones are classified as severe when they are producing ‘very destructive winds’ having sustained surface winds of at least 177 km/h (111m/hr) near the centre and gust winds of at least 221 km/h (138 m/hr). This corresponds to cyclone categories 3, 4 and 5.
_
The Beaufort scale
| Beaufort scale | Cyclone category | Average wind speed (knots) | Average wind speed (km/h) | Estimating speed over land | Estimating speed over water | |
| Gale | 1 | 34 – 40 | 62 – 74 | Breaks twigs off trees; generally impedes progress. | Moderately high waves of greater length; edges of crests begin to break into the spindrift; the foam is blown in well-marked streaks along the direction of the wind | |
| Strong gale | 1 | 41 – 47 | 75 – 88 | Slight structural damage occurs (chimney pots and slates removed). | High waves; dense streaks of foam along the direction of the wind; crests of waves begin to topple, tumble and roll over; spray may affect visibility | |
| Storm | 2 | 48 – 55 | 89 – 102 | Seldom experienced inland; trees uprooted; considerable structural damage occurs. | Very high waves with long overhanging crests; the resulting foam, in great patches, is blown in dense white streaks along the direction of the wind; on the whole, the surface of the sea takes a white appearance; the tumbling of the sea becomes heavy and shock-like; visibility affected | |
| Violent storm | 2 | 56 – 63 | 103 – 117 | Very rarely experienced; accompanied by widespread damage. | Exceptionally high waves (small and medium sized ships might be for a time lost to view behind the waves); the sea is completely covered with long white patches of foam lying along the direction of the wind; everywhere the edges of the wave crests are blown into froth; visibility affected | |
| Hurricane | 3,4,5 | 64 and over | 118 and over | Severe and extensive damage. | The air is filled with foam and spray; sea completely white with driving spray; visibility very seriously affected | |
_
What does ‘maximum sustained winds’ mean? How does it relate to wind gusts in tropical cyclones?
The Bureau of Meteorology uses a 10 minute averaging time for reporting the sustained (i.e. relatively long-lasting) winds. The maximum sustained winds are the highest 10 minute surface winds occurring within the circulation of the cyclone. These surface winds are those observed (or, more often estimated) to occur at the standard meteorological height of 10 meters having an unobstructed exposure. Gusts are a few seconds (3-5 seconds) wind peak. Typically, in a cyclone environment the value for a peak gust is about 25 % higher than a 10 minute sustained wind.
NOTE: USA agencies, who have responsibility for issuing tropical cyclone warnings in the Atlantic and Northeast Pacific tropical cyclone basins, use a 1 minute averaging time for sustained winds. While one can utilize a simple ratio to convert from peak 10 minute wind to peak 1 minute wind (roughly 12% higher for the latter), such systematic differences tend to make inter-basin comparison of tropical cyclones around the world problematic. India Meteorological Department (IMD) uses a 3 minutes averaging for the sustained wind.
_
Destructive power of tropical cyclone:
Traditional meteorological teaching says that there is very little association between intensity (either measured by maximum sustained winds or by central pressure) and size (either measured by radius of gale force (30 kt) winds or the radius of the outer closed isobar).
The destructive power of hurricanes and cyclones comes from four primary factors.
1) The strong winds generated inside the storm have the power to severely damage structures in their own right. The winds also pick up loose objects converting the debris into powerful projectiles that can do considerable damage.
2) The second destructive factor is the heavy rains that the thunderstorms inside a tropical cyclone bring. Rains most often cause flooding or landslides that wash out communities and block roads.
3) The rotating motion of cyclones can also lead to the formation of tornados with strong damaging winds of their own.
4) The final and usually most destructive force wrought by a hurricane is called the storm surge. The storm surge is a rise in the level of the ocean that can reach as much as 35 ft (10.5 m) above normal. The surge is created by strong winds that push up a wall of water ahead of the cyclone and washes inland as the storm moves ashore. The storm surge is created on the right-hand side of the cyclone (left-hand side in the southern hemisphere) ahead of that portion of the storm rotating towards the coast. The destructive power of the surge comes from its ability to wash over shorelines, flood areas far inland, and then rush back out to sea as the waters subside.
_
Landfall:
Officially, landfall is when a storm’s center (the center of its circulation, not its edge) crosses the coastline. Storm conditions may be experienced on the coast and inland hours before landfall. In fact, a tropical cyclone can launch its strongest winds over land, yet not make landfall; if this occurs, then it is said that the storm made a direct hit on the coast. Tropical cyclones may spawn tornadoes up to about three days after landfall.
_
Multiple storm interaction:
When two cyclones approach one another, their centers will begin orbiting cyclonically about a point between the two systems. The two vortices will be attracted to each other, and eventually spiral into the center point and merge. When the two vortices are of unequal size, the larger vortex will tend to dominate the interaction, and the smaller vortex will orbit around it. This phenomenon is called the Fujiwhara effect.
_
Natural dissipation:
During landfall, the increased friction over land acts – somewhat contradictory – to both decrease the sustained winds and also to increase the gusts felt at the surface. The sustained (1 min or longer average) winds are reduced because of the dampening effect of larger roughness over land (i.e. bushes, trees and houses over land versus a relatively smooth ocean). The gusts are stronger because turbulence increases and acts to bring faster winds down to the surface in short (a few seconds) bursts. However, after just a few hours, a tropical cyclone over land will begin to weaken rapidly – not because of friction – but because the storm lacks the moisture and heat sources that the ocean provided. This depletion of moisture and heat hurts the tropical cyclone’s ability to produce thunderstorms near the storm center. Without this convection, the storm rapidly weakens. Most strong storms lose their strength very rapidly after landfall and become disorganized areas of low pressure within a day or two, or evolve into extratropical cyclones. If it remains over mountains for even a short time, weakening will accelerate. Many storm fatalities occur in mountainous terrain, as the dying storm unleashes torrential rainfall, leading to deadly floods and mudslides. Additionally, dissipation can occur if a storm remains in the same area of ocean for too long, mixing the upper 60 meters (200 ft) of water, dropping sea surface temperatures more than 5 °C (9 °F). Without warm surface water, the storm cannot survive. A tropical cyclone can dissipate when it moves over waters significantly below 26.5 °C (79.7 °F). This will cause the storm to lose its tropical characteristics (i.e. thunderstorms near the center and warm core) and become a remnant low pressure area, which can persist for several days. This is the main dissipation mechanism in the Northeast Pacific ocean. Weakening or dissipation can occur if it experiences vertical wind shear, causing the convection and heat engine to move away from the center; this normally ceases development of a tropical cyclone.
_
Effects of cyclone:
The above picture shows the aftermath of Hurricane Katrina in Gulfport, Mississippi in the year 2005.
_
Primary effects are those that result directly from the event itself. Secondary effects are those that result from the primary effects. Primary effects of tropical storms include high winds, torrential rain and storm surges at landfall. There may also be localized tornadoes and waterspouts. These are all physical effects. Secondary effects of tropical storms are very wide-ranging. It is divided them into social, economic and environmental effects.
_
Tropical cyclones out at sea cause large waves, heavy rain, and high winds, disrupting international shipping and, at times, causing shipwrecks. On land, strong winds can damage or destroy vehicles, buildings, bridges, and other outside objects, turning loose debris into deadly flying projectiles. Storm surge is simply water that is pushed toward the shore by the force of the winds swirling around the storm. This advancing surge combines with the normal tides to create the hurricane storm tide, which can increase the average water level 15 feet (4.5 m) or more. The storm surge, or the increase in sea level due to the cyclone, is typically the worst effect from landfalling tropical cyclones, historically resulting in 90% of tropical cyclone deaths. In addition to the storm surge and high winds, tropical cyclones threaten with their torrential rains and flooding. Even after the wind has diminished, the flooding potential of these storms remains for several days. Over the past two centuries, tropical cyclones have been responsible for the deaths of about 1.9 million people worldwide. The broad rotation of a landfalling tropical cyclone, and vertical wind shear at its periphery, spawns tornadoes. Tornadoes can also be spawned as a result of eyewall mesovortices, which persist until landfall. Large areas of standing water caused by flooding lead to infection, as well as contributing to mosquito-borne illnesses. Crowded evacuees in shelters increase the risk of disease propagation. Tropical cyclones significantly interrupt infrastructure, leading to power outages, bridge destruction, and the hampering of reconstruction efforts. Tropical cyclones have an impact on oil production due to brief shutdowns due to damage to oil platforms and oil refineries which in turn can cause a temporary spike in price.
_
Social effects of tropical storms
1) There are likely to be food and water shortages.
2) As a result of extensive flooding, people may catch water-borne diseases. This may eventually lead to death.
3) Communities are displaced from their homes, and may be broken up if the area is not restored. Many people are made homeless.
4) People suffer from stress due to loss of possessions and housing.
5) There may be looting of properties – domestic and commercial.
6) People may lose their jobs if they work in an industry that has been badly affected.
7) If insurance premiums rise in the future, some people may not be able to afford them and will consequently not be financially protected against future storms.
![]()
_
Economic effects of tropical storms
1) There are the obvious costs of repairing any damage caused.
2) Insurance claims will be made, and this may cause the cost of insurance premiums to rise in the future.
3) Whilst businesses are closed, earnings (and profits) will be lost.
4) Crops may be damaged and exports lost. These may be a key source of income for the local economy.
5) Oil prices may increase (this was a significant effect in the aftermath of Hurricane Katrina).
_
Environmental effects of tropical storms (sometimes referred to as physical effects)
1) A huge amount of water is released in a tropical storm so there will be extensive flooding.
2) Flooding might led to sewer systems being flushed out and spreading disease.
3) There will be structural damage to buildings and they may have to be pulled down and rebuilt. This is very costly. Other buildings may have broken windows, chimneys etc.
4) Roads and other infrastructure such as railways may be destroyed. This can lead to communication problems.
5) Electricity lines might be blown down and, as a result, people could be without power supplies.
6) Sensitive ecosystems may be destroyed and plant and animal habitats lost.
7) Sea fish are often killed because of silting, and freshwater fish may be killed in storm surges.
![]()
![]()
![]()
9) Crops and livestock may be damaged or destroyed.
10) Mudslides become common because the soil is saturated. They will flow quickly down hillsides and may bury houses, crops and livestock (or even people).
_
Advantages of tropical cyclones:
Although their effects on human populations can be devastating, tropical cyclones can also relieve drought conditions by bringing much-needed precipitation to otherwise dry regions. They also carry heat and energy away from the tropics and transport it toward temperate latitudes, which make them an important part of the global atmospheric circulation mechanism. As a result, tropical cyclones help to maintain equilibrium in the Earth’s troposphere. They also stir up the waters of coastal estuaries, which are typically important fish breeding locales. Tropical cyclone destruction spurs redevelopment, greatly increasing local property values.
_
Preparation and safety procedures for survival during cyclone:
_
A) When a cyclone watch is issued:
1) Re-check your property for any loose material and tie down (or fill with water) all large, relatively light items such as boats and rubbish bins.
2) Fill vehicles’ fuel tanks. Check your emergency kit and fill water containers.
3) Ensure household members know which the strongest part of the house is and what to do in the event of a cyclone warning or an evacuation.
4) Tune to your local radio/TV for further information and warnings.
5) Check that neighbors are aware of the situation and are preparing.
_
B) When a cyclone warning is issued:
1) If requested by local authorities, collect children from school or childcare centre and go home.
2) Park vehicles under solid shelter (hand brake on and in gear).
3) Put wooden or plastic outdoor furniture in your pool or inside with other loose items.
4) Close shutters or board-up or heavily tape all windows. Draw curtains and lock doors.
5) Pack an evacuation kit of warm clothes, essential medications, baby formula, nappies, valuables, important papers, photos and mementos in waterproof bags to be taken with your emergency kit. Large/heavy valuables could be protected in a strong cupboard.
6) Remain indoors (with your pets). Stay tuned to your local radio/TV for further information.
_
C) On warning of local evacuation:
Based on predicted wind speeds and storm surge heights, evacuation may be necessary. Official advice will be given on local radio/TV regarding safe routes and when to move.
1) Wear strong shoes (not thongs) and tough clothing for protection.
2) Lock doors; turn off power, gas, and water; take your evacuation and emergency kits.
3) If evacuating inland (out of town), take pets and leave early to avoid heavy traffic, flooding and wind hazards.
4) If evacuating to a public shelter or higher location, follow police and State/Territory Emergency Services directions.
5) If going to a public shelter, take bedding needs and books or games for children.
6) Leave pets protected and with food and water.
_
D) When the cyclone strikes:
1) Disconnect all electrical appliances. Listen to your battery radio for updates.
2) Stay inside and shelter {well clear of windows) in the strongest part of the building, i.e. cellar, internal hallway or bathroom. Keep evacuation and emergency kits with you.
3) All of the doors and windows should be closed (and shuttered) throughout the duration of the hurricane. It is wrong to keep windows & doors on the storm side closed, and the windows & doors on the lee side open because the pressure differences between inside your house and outside in the storm do not build up enough to cause any damaging explosions. On the contrary, an open window or door – even if in the lee side of the house – can be an open target to flying debris.
4) If the building starts to break up, protect yourself with mattresses, rugs or blankets under a strong table or bench or hold onto a solid fixture, e.g. a water pipe.
5) Beware the calm ‘eye’. If the wind drops, don’t assume the cyclone is over; violent winds will soon resume from another direction. Wait for the official ‘all clear’.
6) If driving, stop (handbrake on and in gear) – but well away from the sea and clear of trees, power lines and streams. Stay in the vehicle.
_
E) After the cyclone:
1) Don’t go outside until officially advised it is safe.
2) Check for gas leaks. Don’t use electric appliances if wet.
3) Listen to local radio for official warnings and advice.
4) If you have to evacuate, or did so earlier, don’t return until advised. Use a recommended route and don’t rush.
5) Beware of damaged power lines, bridges, buildings, trees, and don’t enter floodwaters.
6) Heed all warnings and don’t go sightseeing. Check/help neighbors instead.
7) Don’t make unnecessary telephone calls.
_
What’s it like to go through a tropical cyclone on the ground?
What are the early warning signs of an approaching tropical cyclone?
The picture below is of a general sequence of events one might expect from a Category 2 hurricane approaching a coastal area.
_
96 hours before landfall
At first there aren’t any apparent signs of a storm. The barometer is steady; winds are light and variable, and fair weather cumulus clouds dot the sky. But the perceptive observer will note a swell on the ocean surface of about a meter (3 feet) in height with a wave coming ashore every ten seconds. These waves race out far ahead of a storm at sea.
_
72 hours before landfall
Little has changed, except that the swell has increase to about 2 meters (6 feet) in height and the waves now come in every nine seconds. This means that the storm, still far over the horizon, is approaching.
_
48 hours before landfall
If anything, conditions have improved. The sky is now clear of clouds, the barometer is steady, and the wind is almost calm. The swell is now about 3 m (9 feet) and coming in every 8 seconds. A hurricane watch is issued, and areas with long evacuation times are given the order to begin.
_
36 hours before landfall
The first signs of the storm appear. The barometer is falling slightly, the wind is around 5 m/s (10 kt, 11 mph), and the ocean swell is about 4m (13 feet) in height and coming in 7 seconds apart. On the horizon a large mass of white cirrus clouds appear. A hurricane warning is issued and low lying areas and people living in mobile homes are ordered to evacuate.
_
24 hours before landfall
In addition to the overcast, small low clouds streak by overhead. The barometer is falling by 0.2 mb/hr (0.006″Hg/hr), the wind picks up to 15 m/s (30 kt, 34 mph). The wind driven waves are covered in whitecaps and streaks of foam begin to ride over the surface. Evacuations should be completed and final preparations made by this time.
_
18 hours before landfall
The low clouds are thicker and bring driving rain squalls with gusty winds. The barometer is steadily falling at half a millibar per hour (0.015 “Hg/hr), and the winds are whistling by at 20 m/s (40 kt, 46 mph). It is hard to stand against the wind.
_
12 hours before landfall
The rain squalls are more frequent and the winds don’t diminish after they depart. The cloud ceiling is getting lower, and the barometer is falling at 1 mb/hr (0.029 “Hg/hr). The wind is howling at hurricane force at 32 m/s (64 kt, 74 mph), and small, loose objects are flying through the air and branches are stripped from trees.
_
6 hours before landfall
The rain is constant now and the 40 m/s wind (80 kt, 92 mph) drives it horizontally. The barometer is falling 1.5 mb/hr (0.044 “Hg/hr), and the storm surge has advanced above the high tide mark. It is impossible to stand upright outside without bracing yourself, and heavy objects like coconuts and plywood sheets become airborne missiles.
_
1 hour before landfall
It didn’t seem possible, but the rain has become heavier, a torrential downpour. Low areas inland become flooded from the rain. The winds are roaring at 45 m/s (90 kt, 104 mph), and the barometer is free-falling at 2 mb/hr (0.058 “Hg/hr). The sea is white with foam and streaks. The storm surge has covered coastal roads and 5 meter (16 foot) waves crash into buildings near the shore.
_
The eye
Just as the storm reaches its peak, the winds begin to slacken, and the sky starts to brighten. The rain ends abruptly and the clouds break and blue sky is seen. However the barometer continues falling at 3 mb/hr (0.09 “Hg/hr) and the storm surge reaches the furthest inland. The air is uncomfortably warm and humid. Looking up you can see huge walls of cloud on every side, brilliant white in the sunlight.
_
1 hour after landfall
The sky darkens and the winds and rain return just a heavy as they were before the eye. The storm surge begins a slow retreat, but the monstrous waves continue to crash ashore. The barometer is now rising at 2 mb/hr (0.058 “Hg/hr). The winds top out at 45 m/s (90 kt, 104 mph), and heavy items torn loose by the front side of the storm are thrown about and into sides of buildings that had been in the lee before the eye passed.
_
6 hours after landfall
The flooding rains continue, but the winds have diminished to a ‘mere’ 40 m/s (80 kt, 92 mph). The storm surge is retreating and pulling debris out to sea or stranding sea borne objects well inland. It is still impossible to go outside.
_
12 hours after landfall
The rain now comes in squalls and the winds begin to diminish after each squall passes. The cloud ceiling is rising, as is the barometer at 1 mb/hr (0.029 “Hg/hr). The wind is still howling at near hurricane force at 30 m/s (60 kt, 69 mph), and the ocean is covered with streaks and foam patches. The sea level returns to the high tide mark.
_
24 hours after landfall
The low clouds break into smaller fragments and the high overcast is seen again. The barometer is rising by 0.2 mb/hr (0.006″Hg/hr), the wind falls to 15 m/s (30 kt, 34 mph). The surge has fully retreated from land, but the ocean surface is still covered by small whitecaps and large waves.
_
36 hours after landfall
The overcast has broken and the large mass of white cirrus clouds disappears over the horizon. The sky is clear and the sun seems brilliant. The barometer is rising slightly, the wind are a steady 5 m/s (10 kt, 11 mph). All around are torn trees and battered buildings. The air stinks of dead vegetation and muck that was dredged by the storm from the bottom of the sea to cover the shore. The all clear is given.
_
Naming of tropical cyclones:
Tropical cyclones are named to provide ease of communication between forecasters and the general public regarding forecasts, watches, and warnings. Having a name also raises the profile of the cyclone heightening the public’s awareness. Since the storms can often last a week or longer and that more than one can be occurring in the same region at the same time, names can also reduce the confusion about what storm is being described. These names are taken from lists that vary from region to region and are usually drafted a few years ahead of time. The lists are decided on, depending on the regions, either by committees of the World Meteorological Organization (called primarily to discuss many other issues), or by national weather offices involved in the forecasting of the storms. Women and men’s names are alternated. The names also include animals, flowers and astrological signs. The list of names for the year 2011 is already out and cyclones will be named accordingly as soon as they start developing.
_
Worst cyclones:
The 1970 Bhola cyclone is the deadliest tropical cyclone on record, killing more than 300,000 people after striking the densely populated Ganges Delta region of Bangladesh. The 2005 Hurricane Katrina is estimated as the costliest tropical cyclone worldwide causing overall damage exceeding $100 billion.
_
Storm tracking:
Tropical cyclones far from land are tracked by weather satellites capturing visible and infrared images from space, usually at half-hour to quarter-hour intervals. Tropical storms are areas of intense low pressure. On a satellite image, a tropical storm will show as a huge, swirling mass of cloud. The eye (calm area) is at the centre. As a storm approaches land, it can be observed by land-based Doppler radar. Radar plays a crucial role around landfall by showing a storm’s location and intensity every several minutes. Doppler radar can also tell meteorologists the direction that storms are heading. Another thing Doppler radar tells meteorologists is the direction and speed of winds inside of storm. This allows them to visibly see rotation in a storm, how intense the rotation is and send out warnings accordingly. In-situ measurements, in real-time, can be taken by sending specially equipped reconnaissance flights into the cyclone (hurricane hunters). These aircraft fly directly into the cyclone and take direct and remote-sensing measurements. The aircraft also launch GPS dropsondes inside the cyclone. The dropsonde measures things like wind speed, pressure, temperature, and humidity as it falls all the way through the hurricane to the surface. That information all goes into the models and helps them predict two-three days what that storm is going to be doing. So you have to understand what’s going on now to help predict the future. Even though an airplane is flying through a hurricane, most flights are uneventful, aside from some constant turbulence. A new era in hurricane observation began when a remotely piloted Aerosonde, a small drone aircraft, was flown through Tropical Storm Ophelia as it passed Virginia’s Eastern Shore during the 2005 hurricane season. A similar mission was also completed successfully in the western Pacific Ocean. This demonstrated a new way to probe the storms at low altitudes that human pilots seldom dare.
_
Besides watching weather report on television at home, you can track cyclones through internet on computers. Computer softwares are available in market for tracking tropical cyclone at your home. Facebook and iPhone applications are also available for tracking tropical cyclones.
_
Storm forecasting:
Meteorologists around the world use modern technology such as satellites, doppler weather radars and computers etc. to track tropical cyclones as they develop. Tropical cyclones are often difficult to predict, as they can suddenly weaken or change their course. However, meteorologists use state-of-art technologies and develop modern techniques such as numerical weather prediction models to predict how a tropical cyclone evolves, including its movement and change of intensity; when and where one will hit land and at what speed. Official warnings are then issued by the National Meteorological Services of the countries concerned.
_
Because of the forces that affect tropical cyclone tracks, accurate track predictions depend on determining the position and strength of high & low pressure areas, and predicting how those areas will change during the life of a tropical system. The deep layer mean flow, or average wind through the depth of the troposphere, is considered the best tool in determining track direction and speed. High-speed computers and sophisticated simulation software allow forecasters to produce computer models that predict tropical cyclone tracks based on the future position and strength of high- and low-pressure systems. Combining forecast models with increased understanding of the forces that act on tropical cyclones, as well as with a wealth of data from Earth-orbiting satellites and other sensors, scientists have increased the accuracy of track forecasts over recent decades. However, scientists are not as skillful at predicting the intensity of tropical cyclones. The lack of improvement in intensity forecasting is attributed to the complexity of tropical systems and an incomplete understanding of factors that affect their development.
_
There are certain areas over the oceans that are particularly favorable for tropical cyclone development, but it is usually certain characteristics in a cluster of thunderclouds that leads forecasters to recognize them as tropical depressions. This is done by people at specialist tropical cyclone forecasting centers around the globe who are constantly studying satellite images, instruments and other weather data to detect and track them through their life-cycle. Once detected, their track is forecast using a combination of numerical forecasting models, synoptic forecasting and statistical methods, which have been developed from the study of the behavior of past storms.
_
Remote sensing is the science of obtaining information about a subject or object without actually being in contact with that subject or object. In the National Weather Service, remote sensing equipment is used in the detection and measurement of weather phenomena with devices sensitive to electromagnetic energy such as.
1) Light (satellite)
2) Heat (infrared scanners on satellites)
3) Radio Waves (Doppler radar)
_
The radiosonde is a small, expendable instrument package that is suspended below a six feet wide balloon filled with hydrogen or helium. As the radiosonde rises at about 1,000 feet/minute (300 meters/minute), sensors on the radiosonde measure profiles of pressure, temperature, and relative humidity. The radiosonde flight can last in excess of two hours, and during this time the radiosonde can ascend to over 115,000 feet (35,000 m) and drift more than 125 miles (200 km) from the release point. During the flight, the radiosonde is exposed to temperatures as cold as -130°F (-92°C) and an air pressure only few thousandths of what is found on the Earth’s surface. The picture below shows the radiosonde ready for launch.
_
Weather satellites:
Weather satellites are of two types, polar and geostationary. Polar orbiting satellites closely parallel the earth’s meridian lines, thus having a highly inclined orbit close to 90°. They pass over the north and south poles each revolution. As the earth rotates to the east beneath the satellite, each pass monitors an area to the west of the previous pass at intervals of roughly 90 to 100 minutes. Polar orbiting satellites (POES) offer the advantage of daily global coverage, by making nearly polar orbits roughly 14.1 times daily. Since the number of orbits per day is not an integer, the orbital tracks do not repeat on a daily basis. Currently in orbit we have morning and afternoon satellites, which provide global coverage four times daily. The geostationary satellites (GOES) were placed in orbit beginning in 1966. Unlike Polar satellite, geostationary satellites orbit at an altitude of 22,236 miles (35,786 km). At this distance the satellite completes one orbit of the earth in 24 hours. The net result is the satellite appears stationary, relative to the earth. This allows them to hover continuously over one position on the surface. Because they stay above a fixed spot on the surface, they provide a constant vigil for the atmospheric “triggers” for severe weather conditions such as tornadoes, flash floods, hail storms, and hurricanes.
_
The picture above shows polar satellite (POES) and geostationary satellite (GOES).
_
The advantages and disadvantages to each kind of orbit are discussed in the table below.
| Polar satellite | Advantages: Closer to the earth with an orbit of about 520 miles (833 km) above the surface. Much more detailed images. Excellent views of the polar regions. | Disadvantages: Cannot see the whole earth’s surface at any one time. The path of each orbit changes due to the earth’s rotation so no two images are from the same location. Limited to about six or seven images a day since most of the time the satellite is below the earth’s horizon and out of range of listening equipment. |
| Geostationary satellite | Always located in the same spot of the sky relative to the earth. Can view the entire earth at all times. Can record images as fast as once every minute. View is always from same perspective so motion of clouds over the earth’s surface can be computed. Also receives transmissions from free-floating balloons, buoys and remote automatic data collection stations around the world. | Located about 22,000 miles (35,000 km) in space, providing less detail views of the earth. Views of the polar regions are limited due to the earth’s curvature. |
_
ANTICYCLONES:
_
The picture above shows winds in cyclone (low pressure in center) and winds in anticyclone (high pressure in center).
_
The terms cyclone and anticyclone are used to describe areas of low and high atmospheric pressure, respectively. Vertical air movements are associated with both cyclones and anticyclones. In the former case, air close to the ground is forced inward, toward the center of a cyclone, where pressure is lowest, and then begins to rise upward. At some height, the rising air begins to diverge outward away from the cyclone center. In an anticyclone, the situation is reversed. Air at the center of an anticyclone is forced away from the high pressure that occurs there and is replaced by a downward draft of air from higher altitudes. That air is replaced, in turn, by a convergence of air from higher altitudes moving into the upper region of the anticyclone. Distinctive weather patterns tend to be associated with both cyclones and anticyclones. Cyclones and low pressure systems are generally harbingers of rain, clouds, and other forms of bad weather, while anticyclones and high pressure systems are predictors of fair weather.
_
An anticyclone (that is, opposite to a cyclone) is a weather phenomenon defined as “A large-scale circulation of winds around a central region of high atmospheric pressure, clockwise in the Northern Hemisphere, counterclockwise in the Southern Hemisphere”. Effects of surface-based anticyclones include clearing skies as well as cooler, drier air. Fog can also form overnight within a region of higher pressure. Anticyclones are also known as high-pressure systems, or simply highs. Because anticyclones are associated with surface divergence and sinking air they generally bring good weather with clear skies. In the winter they can bring bitterly cold, dry air masses down from Canada and the Arctic. There can be a tight pressure gradient associated with them which causes strong winds. This drastically reduces the wind-chill temperature and causes blowing snow. The clear, cold nights can produce radiation fog. In the summer, they can cause very hot weather, resulting in heat stress and other heat related illnesses, as well as draughts. The stagnant air can cause pollution to build to excess levels. When a large, vertically stacked anticyclone becomes stationary it can disrupt the entire upper-level wind flow in the atmosphere. In extreme cases it can block storms from moving eastward. It then becomes known as a blocking high.
_
Tornado:
A tornado (twister) is a violently rotating column of air that extends from the base of a cumulonimbus, a thunderstorm cloud and touches the ground. Tornadoes often develop from a class of thunderstorms known as supercells. Supercells contain mesocyclones, an area of organized rotation a few miles up in the atmosphere, usually 1–6 miles (2–10 km) across. Besides mesocyclones, tornadoes can also generate from tropical cyclones after landfall. Almost all tropical cyclones making landfall spawn at least one tornado, provided enough of the Tropical cyclone’s circulation moves over land. However, 2004′s Hurricane Ivan caused a multi-day outbreak of 127 tornadoes. The deadliest single TC-spawned tornado was one that spawned in October 1964 by Hurricane Hilda killing 22 people in Larose, LA. In general, it appears that TC tornadoes are somewhat weaker and briefer than mid-latitude tornadoes. Most tornadoes have wind speeds less than 110 miles per hour (177 km/h), are approximately 250 feet (80 meter) across, and travel a few miles (several kilometers) before dissipating. Various types of tornadoes include the landspout, multiple vortex tornado, and waterspout. Tornadoes normally rotate cyclonically in direction counterclockwise in the northern hemisphere, clockwise in the southern. The weakest tornado damages trees and not substantial structures but the strongest category, rips buildings off their foundations and can deform large skyscrapers. Doppler radar is used to see into the rotation of the storm looking for a tornado signature. A tornado signature or tornado vortex signature shows up as an area within the storm with rapidly changing wind directions. This is used to issue a tornado warning for people in the path of the storm often well before the tornado is even on the ground saving many lives every year. Scientists still do not know the exact mechanisms by which most tornadoes form, and occasional tornadoes still strike without a tornado warning being issued. However, when a warning is issued, going to a basement or an interior first-floor room of a sturdy building greatly increases chances of survival. If no sturdy shelter is nearby, getting low in a ditch is the next best option. A tornado dissipates in few minutes. Tornadoes come in many sizes but are typically in the form of a visible condensation funnel, whose narrow end touches the earth and is often encircled by a cloud of debris.
_
How are tropical cyclones different from tornadoes?
See following pictures of cyclone and tornado animation.
_
While both tropical cyclones and tornadoes are atmospheric vortices, they have little in common. Tornadoes have diameters on the scale of hundreds of meters and are usually produced from a single thunderstorm. A tropical cyclone, however, has a diameter on the scale of hundreds of kilometers and contains many thunderstorms. Tornadoes are primarily over-land phenomena as solar heating of the land surface usually contributes toward the development of the thunderstorm that spawns the vortex (though over-water tornadoes have occurred). In contrast, tropical cyclones are purely oceanic phenomena – they die out over-land due to a loss of a moisture source. While tornadoes require substantial vertical shear of the horizontal winds (i.e. change of wind speed and/or direction with height) to provide ideal conditions for tornado genesis, tropical cyclones require very low values (less than 10 m/s or 20 kt or 23 mph) of tropospheric vertical shear in order to form and grow. Lastly, tropical cyclones have a lifetime that is measured in days, while tornadoes typically last on the scale of minutes. Interestingly, tropical cyclones near landfall often provide the conditions necessary for tornado formation. As the strong onshore surface winds move over land they weaken, but above the surface (> 1 km) winds are not affected. This creates strong wind shear that is conducive to tornado formation. It is believed that most of the tornadoes that do form occur in the outer rain bands some 80-300 km from the centre, but some have been documented to occur in the inner core of the eye wall. It is possible that the extreme damage produced from winds in the eye wall are actually due to tornadoes.
_
| Tropical cyclone | tornado | |
| Location: | Atlantic, Pacific and Indian ocean | Tornados have been spotted in all continents except Antarctica. |
| Intensity: | The scale for measuring cyclones is called the Beaufort Scale and Saffir-Simpson scale and may vary in different countries. | The scale used for rating the strength of tornadoes is called the Fujita (F), Enhanced Fujita (EF), and TORRO (T) Scale. |
| About: | A cyclone is an atmospheric system characterized by the rapid inward circulation of air masses about a low-pressure center, usually accompanied by stormy often destructive weather. | A tornado is a rotating column of air ranging in width from a few yards to more than a mile and whirling at destructively high speeds, usually accompanied by a funnel-shaped downward extension of a cumulonimbus cloud. |
| Frequency: | 80 to 90 per year of intensity (>34 kt) | The United States records about 1200 tornadoes per year, whereas the Netherlands records the highest number of tornadoes per area compared to other countries. Tornadoes occur commonly in spring and the fall season and are less common in winters |
| Rotation: | Clockwise in the Southern hemisphere and anticlockwise in the northern hemisphere. | Clockwise in the Southern hemisphere and anticlockwise in the northern hemisphere. |
| Most affected areas: | Pacific Ocean | North America |
| size | Has a diameter on the scale of hundreds of kilometers | Has diameter on the scale of hundreds of meters |
| lifetime | Can last for few days | Usually dies out in few minutes |
_
How are tropical cyclones different to mid-latitude cyclones (extratropical cyclones)?
To a first approximation, a tropical cyclone is like a heat engine – it derives its energy from the heat that is released when water vapor that has been evaporated from the ocean surface (assisted by high winds and low pressure) condenses in the middle of the atmosphere. Mid-latitude cyclones (low pressure systems associated with fronts) primarily get their energy from horizontal gradients in temperature. Another important difference between the two is that tropical cyclones have their strongest winds near the surface while mid-latitude systems have their strongest winds many kilometers above the surface near the top of the atmosphere.
_
Global warming and cyclones:
The first thing is to establish that there indeed is a phenomenon called “global warming,” and that is at least partially due to increased carbon dioxide from the burning of fossil fuels. One of the main arguments from skeptics is that global temperatures are caused more by changes in the sun than human activity. However, if it were mainly the sun, both the lower atmosphere (troposphere) and upper atmosphere (stratosphere) would warm. But that’s not happening. The troposphere is warming, but the stratosphere is cooling! What would explain that? The greenhouse effect, where some of the warmth (infra-red radiation emitted by earth) gets “trapped” by carbon dioxide & other greenhouse gases and acts as warm blanket around earth.
The above picture shows pretty widespread warming, especially in the northern latitudes.
_
Why do people think that climate change will lead to more tropical storms?
As you already know, tropical storms form where the sea surface temperature (SST) of the water is at least 26.5 degrees C. Global warming is causing a rise in the ocean temperatures, and this would mean that ocean temperatures will exceed 26.5 degrees C for longer periods of time. As a result, the tropical storm season will last longer. In addition, ocean temperatures will exceed 26.5 degrees C in more places so there will be more tropical storms. The map below shows the monthly sea surface temperature anomalies in January 2010 relative to the 1961-1990 base period.
_
However, the fact of the matter is complicated and interesting. The common sense suggests that were the area enclosed by the 26.5 C SST isotherm to increase, so too would the area experiencing tropical cyclogenesis. However, regions prone to tropical cyclogenesis are better characterized as places where the atmosphere is slowly ascending on the largest scales. Since about as much atmosphere is descending as ascending, it is hard to change the total area experiencing ascent. Therefore there is little basis for believing that there would be any substantial expansion of the area of the world prone to tropical cyclogenesis by merely increasing areas of ocean having SST more than 26.5 degree C.
_
Another viewpoint is that there is a natural cycle of variations in the number of tropical storms and that this is not linked to global warming. A natural cycle is a series of events that happen over and over again. The Atlantic multidecadal oscillation (AMO) is a mode of variability occurring in the North Atlantic Ocean and which has its principal expression in the sea surface temperature (SST) field. The AMO is a 20-20 year fluctuation between warmer and cooler than average ocean temperatures in the North Atlantic Ocean. We are currently in the warm phase of the AMO. Some scientists argue that this is why we are experiencing increased tropical storm activity.
_
El Nino
El Niños were originally recognized by fisherman off the coast of South America as the appearance of unusually warm water in the Pacific Ocean, occurring near the beginning of the year. El Niño means “The Little One” in Spanish. El Niño is a climate phenomenon affecting mainly the Pacific Ocean, occurring approx every 3-7 years. Officially, it is a sustained sea surface temperature greater than 0.5°C more than normal across the central tropical Pacific Ocean. The great width of the Pacific Ocean is the main reason why we see El Niño events in that ocean as compared to the Atlantic and Indian Oceans. The narrower width of the Atlantic and Indian Oceans means the waves can cross those basins in less time, so that ocean adjusts more quickly to wind variations. Conversely, wind variations in the Pacific Ocean excites waves that take a long time to cross the basin, so that the Pacific adjusts to wind variations more slowly. This slower adjustment time allows the ocean-atmosphere system to drift further from equilibrium than in the narrower Atlantic or Indian Ocean, with the result that interannual climate anomalies (e.g. unusually warm or cold Sea Surface Temperatures) are larger in the Pacific.
_
The above picture shows the Pacific Basin under normal conditions and during an El Niño event. During El Niño, the trade winds falter, and a pool of warm water moves eastward across the ocean. Normally, warm water extends to a greater depth in the western Pacific than in the east; during El Niño, this gradient evens out with the reduced upwelling off the coast of South America.
_
Normally, trade winds blow west and slightly north across the Pacific Ocean, causing surface water, warmed by the sun, to ‘pile up’ at the western end so that the sea surface is about half a meter higher here. The warm water means surface temperature is about 8 degrees higher. Sometimes the normal trade winds relax. This is the start of an El Niño. The warm pool of water in the Western Pacific is released. It ‘floats’ because it is less dense than the cold water around it, and flows across the surface of the ocean back east towards South America. In general, El Nino events are characterized by more tropical storms in the eastern Pacific and less in the Atlantic, Gulf of Mexico and Caribbean Sea due to increased SST of eastern pacific during El Niño year. The relationship between El Niño and global warming is complicated. The speeded-up hydrological cycle that has resulted from global warming may lead to heavier rainstorms in El Niño years. Some scientists have speculated that a warmer atmosphere due to global warming is likely to produce stronger or more frequent El Niños, based on trends observed over the past 25 years. On the other hand, some computer models indicate El Niños may actually be weaker in a warmer climate. We need better science and more data.
_
However, the global annual frequency of tropical storms is about 90, plus or minus 10. There is no indication whatsoever of a long-term trend in this number. So apparently global warming has not caused more storms. On the other hand, there is some evidence to suggest that hurricanes are increasing their intensity with time. Records of hurricane activity worldwide show an upswing of both the maximum wind speed in and the duration of hurricanes. The energy released by the average hurricane (again considering all hurricanes worldwide) seems to have increased by around 70% in the past 30 years or so, corresponding to about a 15% increase in the maximum wind speed and a 60% increase in storm lifetime. When the sea surface temperature falls, the energy consumption falls, and conversely, when it rises, so too does the energy consumption. Both theory and models of hurricane intensity predict that this should be so as well. The 0.5 degree centigrade (1 degree Fahrenheit) warming of the tropical oceans we have seen in the past 50 years due to global warming is unprecedented for perhaps as long as a few thousand years. Scientists who work on these records therefore believe that the recent increase in hurricane intensity is due to increased greenhouse gases in the atmosphere which might lead to an increase in the energy available to tropical cyclones and therefore to an increase in their potential intensity. Greenhouse gases reduce the amount of infrared radiation leaving the earth’s surface, and unless there is a compensating decrease in the amount of solar radiation reaching the surface by clouds (but this is complicated because clouds also trap outgoing infrared radiation), the ocean must lose the excess heat by increased evaporation of sea water. There are only two ways to achieve this: either the thermodynamic disequilibrium between the tropical oceans and atmosphere must increase or the average surface wind speed must increase. If the thermodynamic disequilibrium increases, then so does the potential intensity of hurricanes unless the thermodynamic efficiency were to decrease, but in fact, the efficiency also increases when greenhouse gases are added to the atmosphere. Not only does the input temperature (the sea surface temperature) increase, for the reasons given above, but the temperature of the tropopause decreases, because the extra greenhouse gas at high levels leads to more efficient trapping of infrared radiation and thus to more cooling. If the average wind speed near the surface of the tropical oceans does not change, it is estimated that the wind speeds in hurricane should increase about 5% for every 1oC increase in tropical ocean temperature. This suggests that the global upward trend in tropical cyclone activity is a consequence of global warming. However, a huge upward trend in hurricane damage is mainly due to increasing coastal population and building in hurricane-prone areas rather than increased intensity due to global warming.
_
A report from Indian Meteorological Department found that Arabian Sea’s temperature rise led to more cyclones. The Arabian Sea’s temperature, which used to be 22 to 27 degrees Celsius till 1980s, is now 27 to 32 degrees Celsius. The sea’s average temperature has increased by two degrees in the last 40 years due to global warming. This has resulted in many cyclones originating from the Arabian Sea and hitting the western coast of India, and countries like Pakistan and Iran. While the Bay of Bengal has always been the one to generate most cyclones that affect India, there have been quite a few in the last few years that have been affecting western parts of the country too. The most recent example of a super cyclone was Cyclone Phet, which churned the Arabian Sea and hit coastal Gujarat, Rajasthan and Karachi last June. Such cyclones were uncommon 50 years ago.
_
When we think of carbon emissions that exacerbate global climate change, most of us probably think of the exhaust from automobiles and other vehicles, or smoke billowing from fossil fuel-burning power plants. But there is a source of large carbon emissions that is not so immediately obvious — the destruction of forest trees through hurricanes. A study has shown that Hurricane Katrina, the storm that flooded New Orleans and pounded the Gulf coastal areas of Mississippi and Louisiana, uprooted or severely damaged roughly 320 million trees. In terms of the carbon cycle, this devastating loss of vegetation from a single storm was equivalent to about a 10-percent increase in U.S. fossil fuel emissions for a year. So this massive loss of vegetation contributes to global warming. Storm intensity is expected to increase with a warming climate, which would result in additional tree mortality and carbon release to the atmosphere, with the potential to further warm the climate system. So there is a vicious cycle of storm destroying forest resulting in global warming, and global warming causing increased storm intensity resulting in further forest destruction. The only way to break this vicious cycle is to plant more trees.
_
How does the damage that hurricanes cause increase as a function of wind speed?
Would a minimal 74 mph hurricane cause one half of the damage that a major hurricane with 148 mph winds? No.
We are most concerned with three aspects of hurricane activity: their frequency, their intensity, and their geographical distribution. Any change in the frequency with which hurricanes strike populated land is of obvious concern. But more important than frequency is the speed of hurricane winds. The amount of damage does not increase linearly with the wind speed. Instead, the damage produced increases exponentially with the winds. The 148 mph hurricane (a category 4 on the Saffir-Simpson Scale) may produce – on average – up to 100 times the damage of a minimal category 1 hurricane! As wind speed increases the power of the wind to do damage increases exponentially. The amount of damage increases roughly as the cube of the maximum wind speed in storms. Hence a category 5 severe tropical cyclone (with wind gusts > 280 km/h) has the potential to do around 250 times the damage of a Category 3 severe tropical cyclone (with wind gusts of 165 km/h). This underscores the importance of the category system. Therefore, in practice, we are concerned with most intense storms. So if some aspect of climate variation were to lead to fewer hurricanes, but more intense ones, we might expect more losses. We would also be concerned if climate change were to cause hurricanes to be experienced in parts of the world now free from them, or to cease to be experienced in regions they now trouble. The factors that control the intensity of hurricanes appear to be quite different from those that govern their frequency of occurrence, and this is reflected in the observation that some seasons produce very few but very intense storms. Fourth characteristic of hurricanes, their geometric size, has received less attention. The diameter of tropical cyclones ranges over nearly a factor of ten: the smallest observed storms can be placed entirely within the eyes of the largest. A storm whose radial dimension is twice the size of another will cause perhaps as much as four times the damage (all other things being equal) since the damage track will be twice as wide and each point within it will experience damaging winds for twice as long. The magnitude and area covered by oceans waves and the storm surge will also be greater. Katrina of 2005 is a grim example of a large hurricane.
_
Attempts of hurricane dissipation by artificial means:
1) Attempt was made to weaken hurricanes by dropping silver iodide – a substance that serves as effective ice nuclei – into the rainbands of the storms. The experiment took place over the open Atlantic far from land. The experimental seeding targeted convective clouds just outside the hurricane’s eyewall in an attempt to form a new ring of clouds that, it was hoped, would compete with the natural circulation of the storm and weaken it. The idea was that the silver iodide would enhance the thunderstorms of a rainband by causing the supercooled water to freeze, thus liberating the latent heat and helping a rainbands to grow at the expense of the eyewall. With a weakened convergence to the eyewall, the strong inner core winds would also weaken quite a bit. However, it was found that unseeded hurricanes form natural outer eyewalls just as scientists expected seeded ones to do so. This phenomenon makes it almost impossible to separate the effect (if any) of seeding from natural changes. For cloud seeding to be successful, the clouds must contain sufficient supercooled water (water that has remained liquid at temperatures below the freezing point, 0°C/32°F). Observations made in the 1980s showed that most hurricanes don’t have enough supercooled water for silver iodide seeding to work. Because the results of seeding experiments were so inconclusive, the experiment was discontinued.
_
2) There has been some experimental work in trying to develop a liquid that when placed over the ocean surface would prevent evaporation from occurring. If this worked in the tropical cyclone environment, it would probably have a limiting effect on the intensity of the storm as it needs huge amounts of oceanic evaporation to continue to maintain its intensity. However, finding a substance that would be able to stay together in the rough seas of a tropical cyclone proved to be the downfall of this idea.
_
3) During each hurricane season, there always appear suggestions that one should simply use nuclear weapons to try and destroy the storms. Apart from the fact that this might not even alter the storm, this approach neglects the problem that the released radioactive fallout would fairly quickly move with the tradewinds to affect land areas and cause devastating environmental problems. The main difficulty with using explosives to modify hurricanes is the amount of energy required. A fully developed hurricane releases total heat energy at the rate of 5.2 x 10¹⁹ Joules/day equivalent to about 6.0 x 10¹⁴ Watts and converts less than 0.25% of the heat into the mechanical energy of the wind. The heat release is equivalent to a 10-megaton nuclear bomb exploding every 20 minutes. Also a nuclear blast would not increase atmospheric pressure in the eye of hurricane. For normal atmospheric pressure, there are about ten metric tons of airs bearing down on each square meter of surface. In the eye of the strongest hurricanes there are nine. To change a Category 5 hurricane into a Category 2 hurricane you would have to add about a half ton of air for each square meter inside the eye, or a total of a bit more than half a billion (500,000,000) tons for a 20 km radius eye. It’s difficult to envision a practical way of moving that much air around.
_
4) “Dyn-O-Gel” is a special powder that absorbs large amounts of moisture and then becomes a gooey gel. It has been proposed to drop large amounts of the substance into the clouds of a hurricane to dissipate some of the clouds thus helping to weaken or destroy the hurricane. One of the biggest problems is, however, that it would take a lot of the stuff to even hope to have an impact. Calculations showed that if the eye of hurricane to be 20 km in diameter surrounded by a 20km thick eyewall, it would requiring 37,699.1 tons of “Dyn-O-Gel”; and to keep the eyewall doped up, you’d need to deliver this much “Dyn-O-Gel” every hour-and-a-half.
–
5) Since hurricanes draw their energy from warm ocean water, some proposals have been put forward to tow icebergs from the arctic zones to the tropics to cool the sea surface temperatures. Others have suggested pumping cold bottom water in pipes to the surface, or releasing bags of cold freshwater from near the bottom to do this. Calculations showed that you need a cool patch of 24,000 sq miles (38,000 sq km) for just 24 hours of the cyclone’s life. On the top of it, if you suddenly cool the surface layer of the ocean (and even turn it temporarily fresh), you would alter the ecology of that area and probably kill most of the sea life contained therein. A hurricane would be devastating enough on them without our adding to the mayhem.
_
6) The idea here is to spread a layer of sunlight absorbing or reflecting particles (such as micro-encapsulated soot, carbon black, or tiny reflectors) at high altitude around a hurricane. This would prevent solar radiation from reaching the surface and cooling it, while at the same time increase the temperature of the upper atmosphere. Being vertically oriented, tropical cyclones are driven by energy differences between the lower and upper layer of the troposphere. Reducing this difference should reduce the forces behind hurricane winds. It would take a tremendous amount of whichever substance you choose to alter the energy balance over a wide swath of the ocean in order to have an impact on a hurricane.
_
All above methods failed to appreciate the size and power of tropical cyclones. For example, when Hurricane Andrew struck South Florida in 1992, the eye and eyewall devastated a swath 20 miles wide. The heat energy released around the eye was 5,000 times the combined heat and electrical power generation of the Turkey Point nuclear power plant over which the eye passed. The kinetic energy of the wind at any instant was equivalent to that released by a nuclear warhead. Perhaps if the time comes when men and women can travel at nearly the speed of light to the stars, we will then have enough energy for brute-force intervention in hurricane dynamics. Also, attacking weak tropical waves or depressions before they have a chance to grow into hurricanes isn’t promising either. About 80 of these disturbances form every year in the Atlantic basin, but only about 5 become hurricanes in a typical year. There is no way to tell in advance which ones will develop. If the energy released in a tropical disturbance were only 10% of that released in a hurricane, it’s still a lot of power. Perhaps the best solution is not to try to alter or destroy the tropical cyclones, but just learn to co-exist better with them. Since we know that coastal regions are vulnerable to the storms, building codes that can have houses stand up to the force of the tropical cyclones need to be enforced. In addition, efforts to educate the public on effective preparedness need to continue. Helping poorer nations in their mitigation efforts can also result in saving countless lives. Finally, we need to continue in our efforts to better understand and observe hurricanes in order to more accurately predict their development, intensification and track.
_
Safety of people vis-à-vis nuclear power plants during strike by hurricanes & tornadoes:
I have discussed in my previous article earthquake, tsunami and nuclear meltdown due to inability of nuclear power plant to cool down reactor core in event of such an emergency. What about hurricanes and tornadoes?
_
A safety procedure is in place that requires nuclear power plants to be shut down when a hurricane is forecast, and remain offline until thorough operational and safety assessments are completed. Even though, hurricanes can be forecast depending on the data from weather satellite and weather Doppler radar, tornadoes can not be accurately predicted.
_
What happens if a massive tornado slams into a working nuclear power plant?
No tornado can damage the shell of a nuclear reactor.
Nuclear power plants are designed to withstand tornadoes and hurricanes. That means that nuclear plants are designed for total wind speeds of 230 mph. When you look at these plants, there’s a lot of concrete. They have very thick, steel-reinforced concrete walls around nuclear reactor. In 1988, a Japanese company hired Sandia National Laboratory to hurl a rocket at a 3-foot thick steel-reinforced concrete wall. It’s a wall much like what surrounds a nuclear reactor. The rocket slammed into the wall at 415 miles per hour. The rocket was obliterated. But the wall was just fine. It penetrated 3 inches into the wall. There is a history of tornados and hurricanes hitting nuclear plants, and there’s been no damage to the core reactors. In 2008, a tornado hit a nuclear reactor at Kansas State University. The building took damage, but the steel-reinforced concrete walls protected the reactor. So damage isn’t the issue, getting power to cool the reactor core is.
_
While most nuclear reactors built in potential hurricane zones are designed to structurally withstand high winds and modest flooding, they are vulnerable to other effects of severe storms. The most significant event is the loss of offsite power, a problem that can lead to a “station blackout.” When offsite AC power is lost due to electrical grid failure, reactors are designed to automatically switch over to required backup emergency diesel generators. Just like what happened in Japan, nuclear plants have a diesel generator backup power supply. It is required to have a 7-day supply of diesel oil on site. If that fails, there’s a battery backup that would last for 48 hours. And if that fails, then, water can be drawn from nearby river or sea or any water source through the portable pump and get that to the reactor vessel to maintain cooling. The Japanese had all those backups too. And it wasn’t enough. Tsunami swept away water pumps, diesel tanks and diesel generators. The flooding with strong hurricane can do the same thing. The storm surge can do the same thing in seashore plants. Also, as recent as August 09, 2005; all four of a South Carolina nuclear power station’s emergency diesel generators were discovered to be inoperable due to a common mode failure. So what happened in Japan can happen again; nuclear meltdown due to failure of cooling system due to hurricane.
_
My theory regarding strength of cyclone:
Let me start with example. The earth spins on its axis with period of rotation of about 24 hours. That means any point on earth except both poles, rotates around axis of rotation in 24 hours. Now, if you are on equator, you will rotate with the speed of 1700 km/h but as you shift to higher latitudes, the speed of rotation will decrease. Nonetheless, the period of rotation will remain same i.e. 24 hours. In the same way, an average tropical cyclone is a disc of about 10 km high and 600 km wide. This disc spins on its axis which passes through the center of the storm (center of eye). The period of rotation is the time taken by any point on this disc (except its axis) to rotate full circle, which remains same for all points on the disc. That means if a wind A is 50 km away from the axis and another wind B is 100 km away from the axis, the period of rotation for both winds will be same. However the speed of wind B will be faster than wind A as wind B is further away from axis than wind A. The strength of a tropical cyclone is inversely proportional to the period of rotation. Lesser the period, faster the speed of rotation and more energy will be required. Also, larger the size of the disc, greater will be energy required to produce rotation of cyclone. So my formula for cyclone strength or intensity is as follows.
_
Where diameter of cyclone in kilometers, period of rotation in hours and intensity means strength of cyclone.
_
Note:
I am using diameter as a surrogate marker for the size of a cyclone to simplify the equation. Ideally, size means volume of a cyclone (disc volume). Also, there would be differential rotation in cyclone resulting in varying period of rotation due to fluidity of its contents. For solid objects such as earth, the rotation period is a single value (24 hour). For gaseous/fluid bodies, such as stars and gas giant planets, the period of rotation varies from the equator to the poles due to a phenomenon called differential rotation. The same logic applies to the cyclone being fluid in nature, has differential rotation. The Sun being a gaseous star has differential rotation implying that the angular velocity decreases with increased latitude. The poles of sun make one rotation every 34.3 days and the equator every 25.05 days, as measured relative to distant stars This is because, although the rotation axis is fixed in space (by the conservation of angular momentum), it is not necessarily fixed in the body of the object itself. As a result of this, the moment of inertia of the object around the rotation axis can vary, and hence the rate of rotation can vary (because the product of the moment of inertia and the rate of rotation is equal to the angular momentum, which is fixed). In the same way, there could be differential rotation in cyclonic motion but its overall effect will be negligible and therefore, for the sake of simplicity, it is ignored.
_
This is my formula for intensity of cyclone which does not consider wind speed but size of cyclone and period of rotation. Larger the size of cyclone, greater will be intensity. Greater the period of rotation, lesser will be intensity. Many times, largest cyclone is not strongest if the period of rotation is more. On the other hand, medium sized cyclone can be very intense if the period of rotation is less. Tornado can be deadly because even though size is small, its period of rotation is very less (rapidly rotating). The size of cyclone can be determined by satellite pictures and the period of rotation is determined by doppler radar by measuring period of rotation of the eye of cyclone. If a modest cyclone is strengthening, either its period of rotation will lessen and/or its size will increase; which can help forecast the intensity of a cyclone.
__
The moral of the story:
1) The biggest problem of discussing weather is lack of uniformity in nomenclature & standardization of various events & parameters. I see no reason why a storm is called cyclone in one part of world and similar storm is called hurricane in another part of world. I see no reason why the averaging time for maximum sustained winds is 10 minutes for most of the world, 1 minute for the U.S. and 3 minutes for India. I see no reason why storms are classified by different scales in different parts of world. It is time for all meteorologists all over world to bring uniformity in nomenclature and standardization.
_
2) There is evidence to suggest that the weather analysis, storm tracking and storm forecast are suffering form poverty of science. We need better science and more scientists working on it.
_
3) Basically all planets of solar system are evolved from the same material. Various planets of solar system differ in their atmosphere & composition merely on the basis of their mass and their distance from the sun. The earth has a unique atmosphere due to its specific mass, specific distance from the sun and specific tilt of its axis of rotation and this atmosphere is responsible for creation and survival of life on earth. If there is any other planet anywhere in the universe with similar specificity, atmosphere similar to earth can exist there and consequently life on it.
_
4) An average of 90 plus or minus 10 tropical cyclones of tropical storm intensity (> 34 knots) form annually worldwide, with 50 % reaching hurricane/typhoon strength (>64 knots) , and 25 % becoming intense tropical cyclones (>96 knots). There is no way by which we can prevent it.
_
5) The strength (intensity) of a tropical cyclone is directly proportional to the size of cyclone and inversely proportional to the period of rotation of cyclone.
_
6) Global warming is responsible for increased intensity of tropical cyclones.
_
7) There is a vicious cycle of hurricanes damaging forests and thus contributing to global warming and consequently increasing their intensities. Plant more trees to break this vicious cycle. Planting more trees will lead to reduced global warming and reduced intensities of future hurricanes.
_
8) Nuclear power plants are safe in hurricanes and tornadoes as far as reactor core is concerned but the same can not be said about the cooling system of reactor core. What happened in Japan on March 11, 2011 can be repeated due to flooding of nuclear power plant during hurricane. Therefore, every nuclear power plant by design & construction should have an alternate access to reactor core by way of ductal system to pump water to cool down fuel rods in event of emergency. Also, the emergency alternate power source diesel generators & tanks must be secured at a height to prevent damage due to flooding. Also, diesel generators must be tested on daily basis to ensure operability.
_
9) World energy problem could be solved if we could harness only a fraction of hurricane wind energy.
_
Dr. Rajiv Desai. MD.
May 14, 2011
_
Postscript:
Further progress in confronting the important relationship between tropical cyclone activity and climate will be limited unless there are fundamental advances in understanding the basic physics of hurricanes. An important limitation to making such advances is social and political in nature. There are remarkably few scientists working on the problem. Till today, out of 1.2 billion Indians, not a single person met me and offered any help in my scientific activities. The same Indian population will rush to have a glimpse of a movie star or a cricket star whose contribution to the world is nothing except entertainment.
_________
Update on formula for cyclone intensity:
_
My formula for cyclone strength or intensity was as follows.
Where diameter of cyclone in kilometers, period of rotation in hours and intensity means strength of cyclone.
_
Now let me show formula for sound energy published in my article ‘Hearing Aid’ at https://drrajivdesaimd.com/?p=9000 just few days back:
_
Sound is transmission of energy in air manifested as vibration of air molecules in a circular fashion which generate sound waves. Energy transmitted by sound is directly proportional to square of frequency (pitch) and square of amplitude (loudness/intensity) of wave, when all other factors are same as shown by me in the thought experiment below:
_
Let us perform thought experiment:
_
There are two sound waves, A with frequency 1 Hz and B with frequency 10,000 Hz, both having same amplitude 1 meter.
This figure shows how air molecules move in circular fashion to propagate sound wave. You can see that amplitude of sound wave is akin to radius (R) of a circle. Wave A has molecules moving 2 X Pi X R (circumference of a circle) meter in one second i.e. 2Pi meter in one second. Wave B has molecules moving 2Pi meter, 10,000 times in one second as it has frequency of 10,000 Hz. That amounts to 2Pi X 10,000 meter in one second. So velocity of wave B molecules is 10,000 times faster than wave A molecules. Since kinetic energy is proportional to square of velocity (1/2 mV2), energy carried by wave B is 10,000 X 10,000 = 100000000 times more than wave A. In other words, when all other factors are same, energy of sound wave is proportional to square of frequency.
_
There are two sound waves, A with amplitude 1 meter and B with amplitude 10,000 meter, both having same frequency of one Hz. Wave A molecules move 2Pi meter in one second and wave B molecules move 2Pi X 10,000 meter in one second. So velocity of wave B molecules is 10,000 times faster than wave A molecules. Since kinetic energy is proportional to square of velocity, energy carried by wave B is 10,000 X 10,000 = 100000000 times more than wave A. In other words, when all other factors are same, energy of sound wave is proportional to square of amplitude.
_
Summing frequency and amplitude of sound wave, energy carried by sound wave is proportional to square of frequency and square of amplitude when all other factors are same. Remember, square of a number is just multiplying it by itself. When two different sound waves are compared, the ratio of their energy is proportional to ratio of their frequencies squared multiplied by ratio of their amplitudes squared as seen in the figure below.
_
_
This is a thought experiment. In reality, for typical sound waves, the maximum displacement of the molecules in the air is only a hundred or a thousand times larger than the molecules themselves — and we don’t have technologies for tracking individual molecules. For the sake of simplicity, change in potential energies of vibrating molecules is not discussed in thought experiment. Mechanical waves in a continuous media can be thought of as an infinite collection of infinitesimal coupled harmonic oscillators. On average, half the energy in a simple harmonic oscillator is kinetic and half is elastic (potential). The time-averaged total energy in then either twice the average kinetic energy or twice the average potential energy.
_
Now I bring analogy of sound wave to cyclone:
In sound wave, air molecules are vibrating in circular fashion at atomic level while in cyclone the same air molecules are rotating in a circular fashion at macroscopic level. An average tropical cyclone is a disc of about 10 km high and 600 km wide, rotating on its axis. To make it simpler, air molecules are rotating in a circle with radius of 300 km with a constant period of rotation for all molecules. Period of rotation (vibration) is reciprocal of frequency in sound waves and the same logic applies in cyclone. So strength of cyclone is directly proportional to square of radius and square of frequency i.e. inversely proportional to square of period of rotation. However all molecules are not rotating with same speed. The molecules on periphery of cyclone i.e. at radius of cyclone has to travel 2 X Pi X radius distance (circumference of cyclone) in the same period as molecules who are near the eye of cyclone who hardly travel any distance. So air molecules at radius are fastest with greatest kinetic energy while air molecules in the eye are slowest with least kinetic energy. Therefore molecules at half radius distance would be an average speed and average kinetic energy of cyclone. So strength or intensity of cyclone would be directly proportional to square of half of radius of cyclone and inversely proportional to square of period of rotation. Please do not confuse intensity of cyclone with intensity of sound waves. Intensity of cyclone is the strength (energy) of cyclone while intensity (amplitude) of sound waves is loudness of sound which along with frequency (pitch) would constitute energy of sound waves.
_
New formula for strength or intensity of cyclone:
____
In other words, strength or intensity of cyclone is directly proportional to the square of the ratio of diameter to period of rotation, all other factors being same. This is mathematical improvisation of my earlier formula of strength or intensity of cyclone. Instead of ratio of diameter of cyclone to period of rotation, now we have square of ratio of diameter to period of rotation, more accurate than previous formula, albeit basic concept to circumvent wind speed is unchanged and unchallenged.
_______
Dr. Rajiv Desai. MD.
October 1, 2016
_______

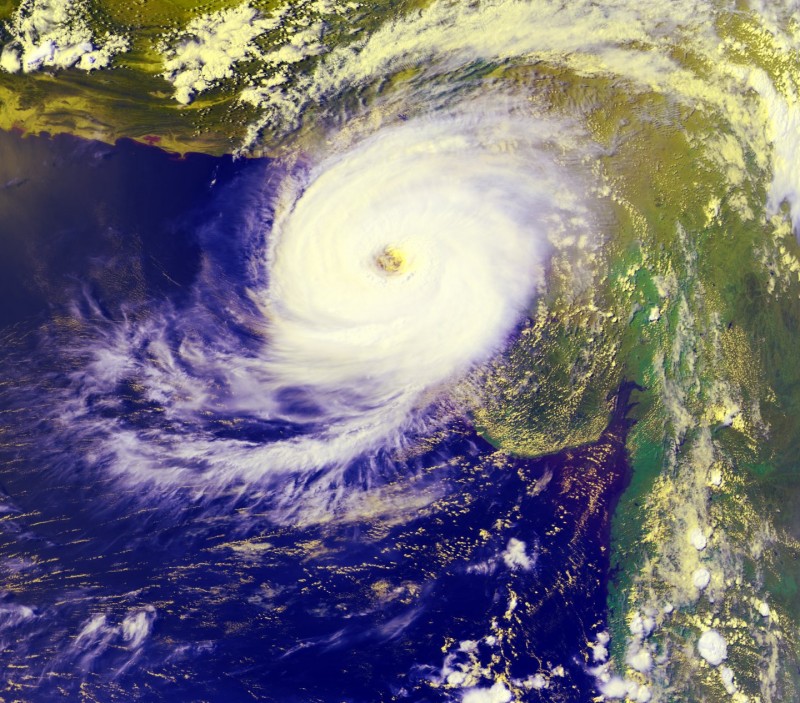
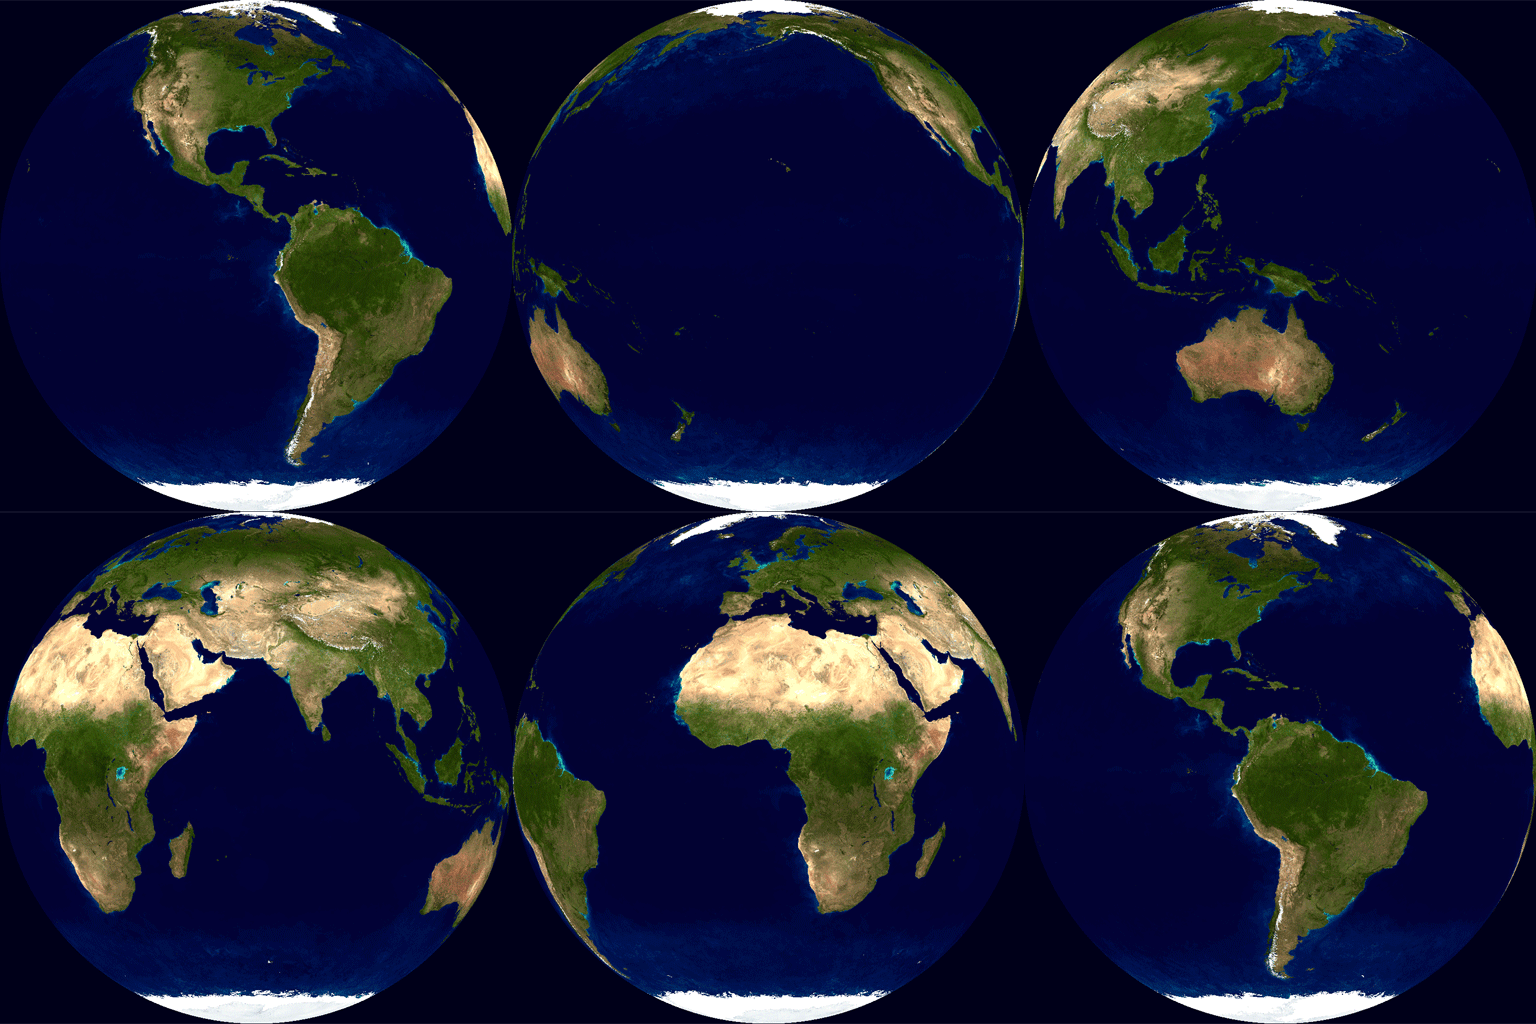
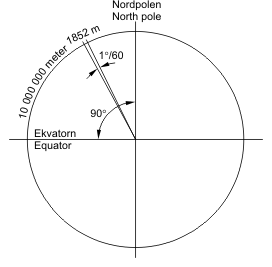
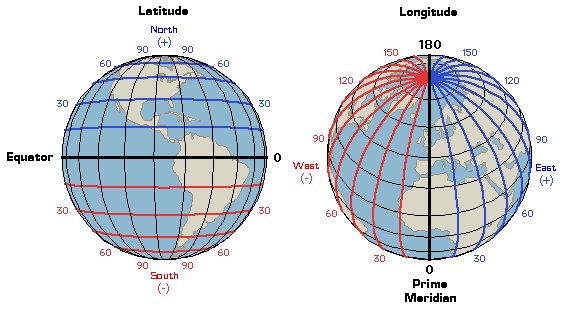
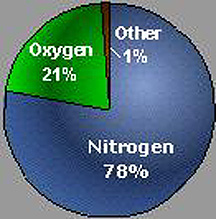
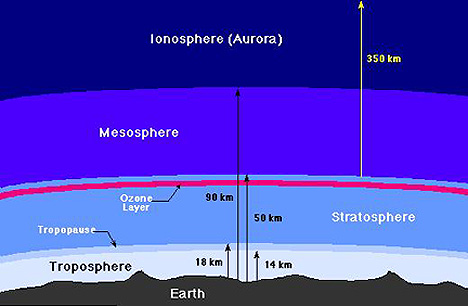
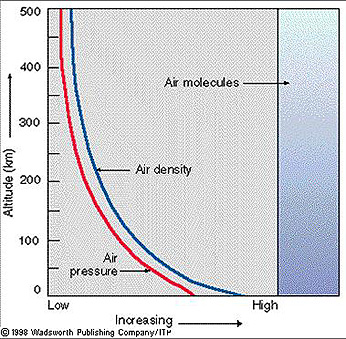
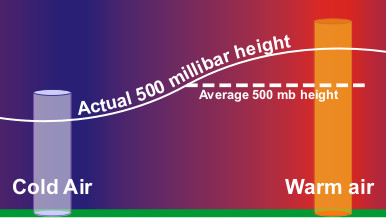
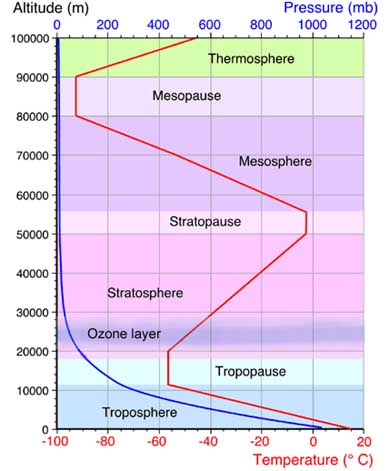
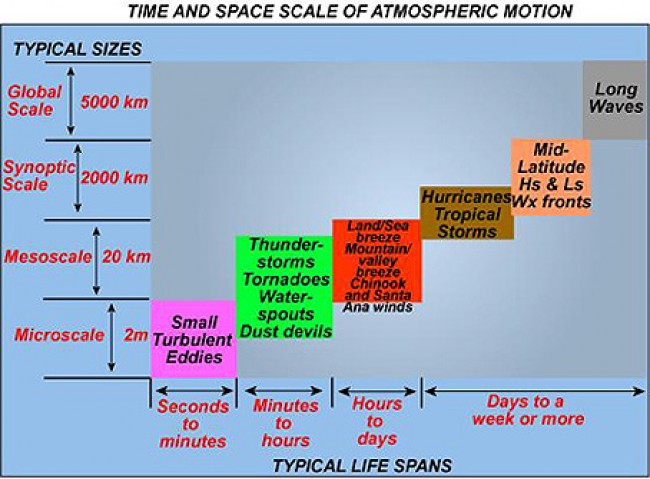
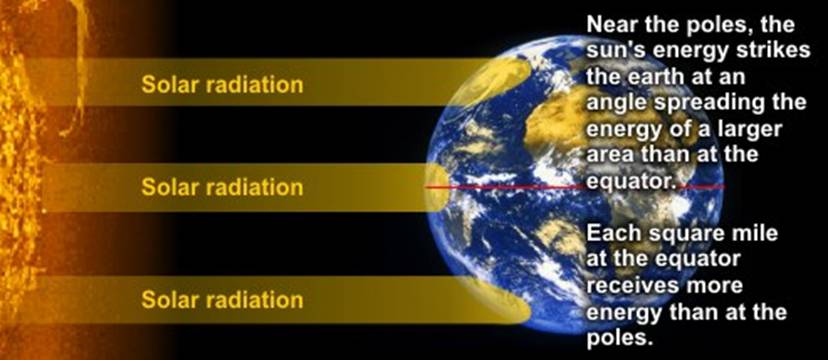
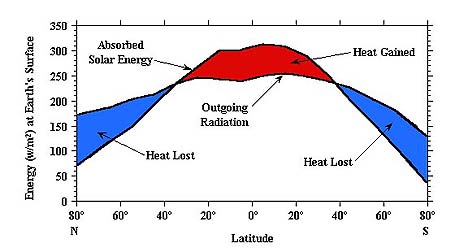
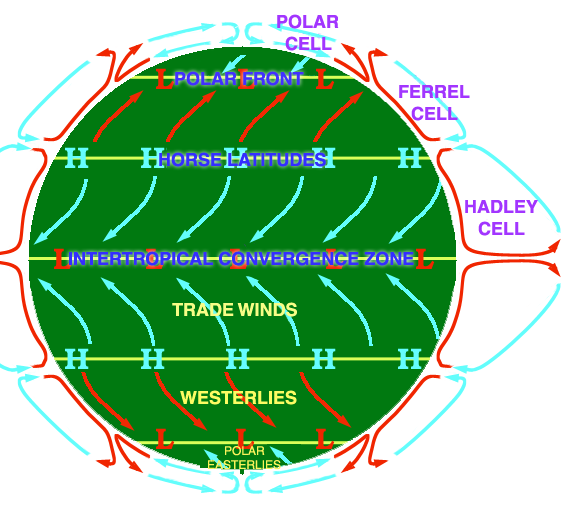
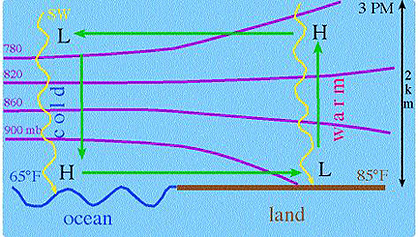
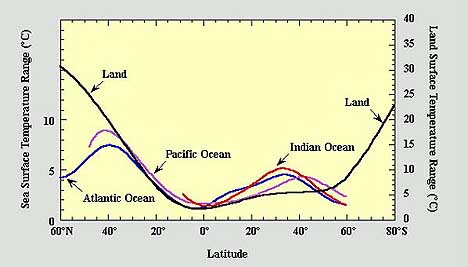
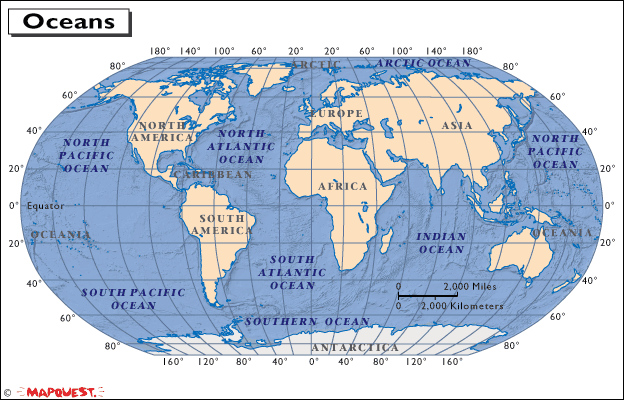
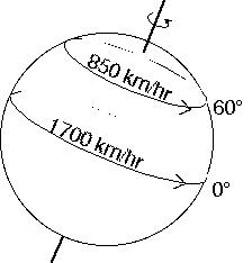
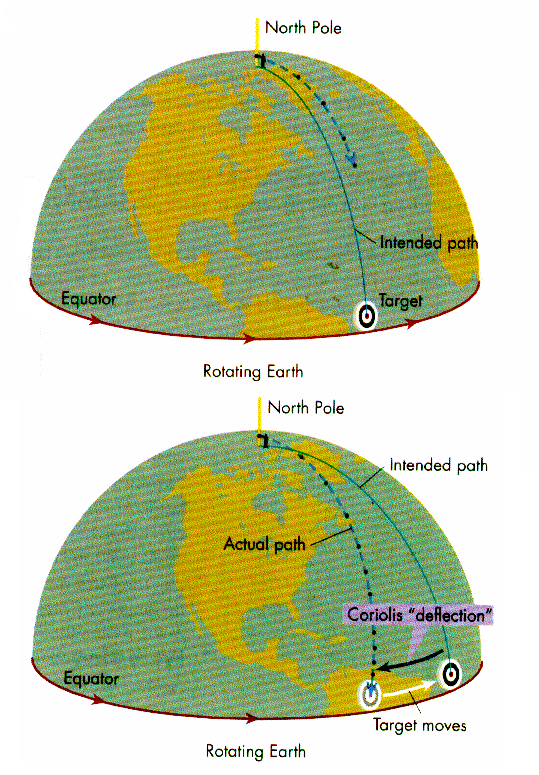
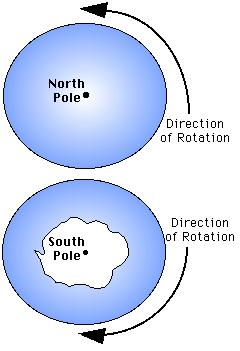
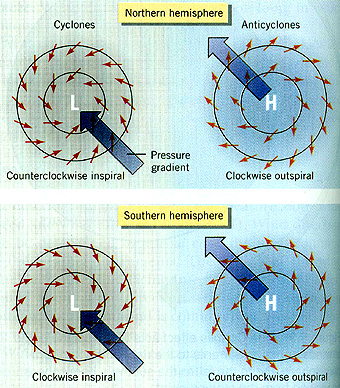
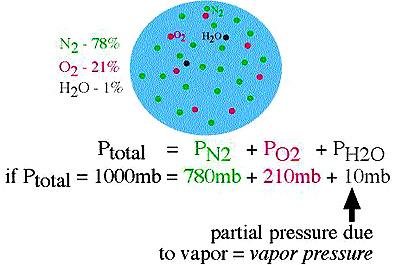
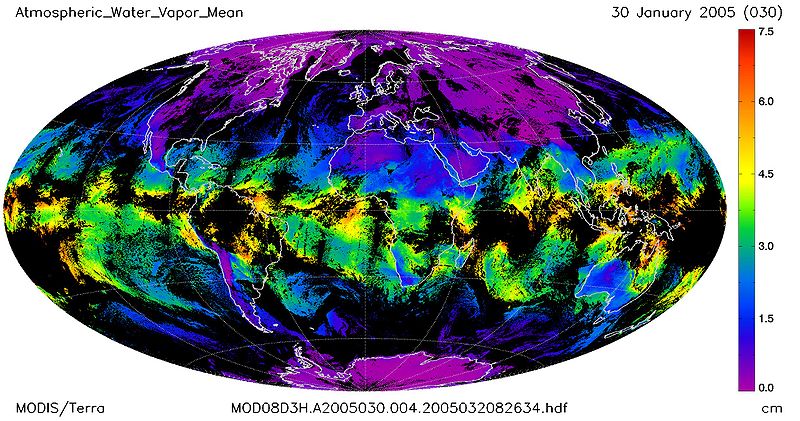
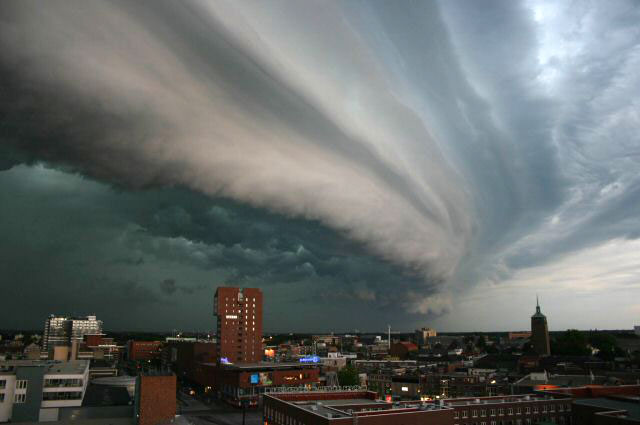
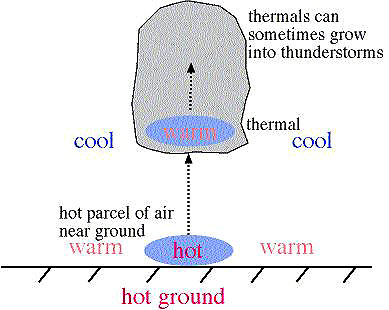
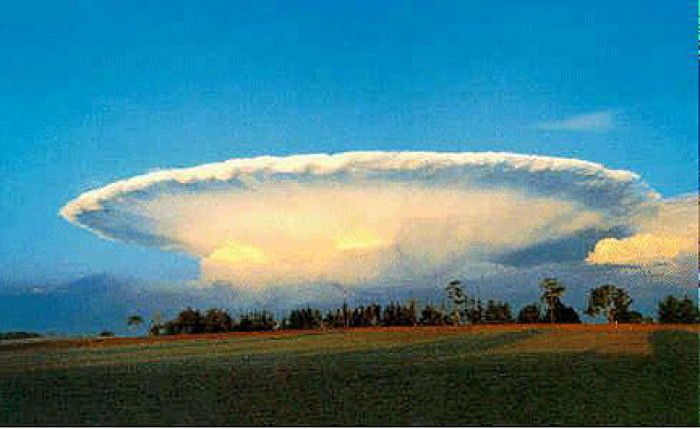
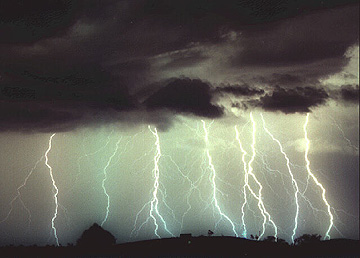
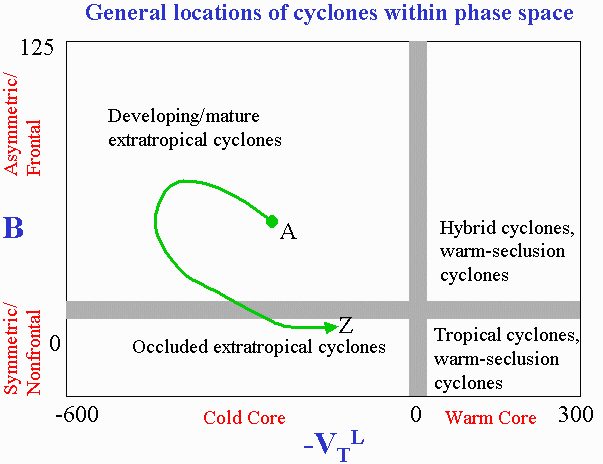
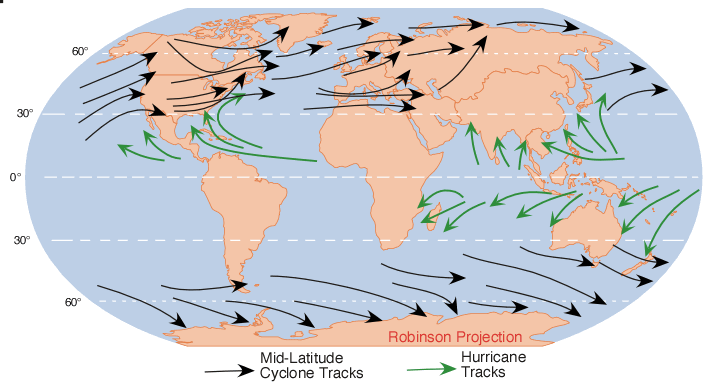
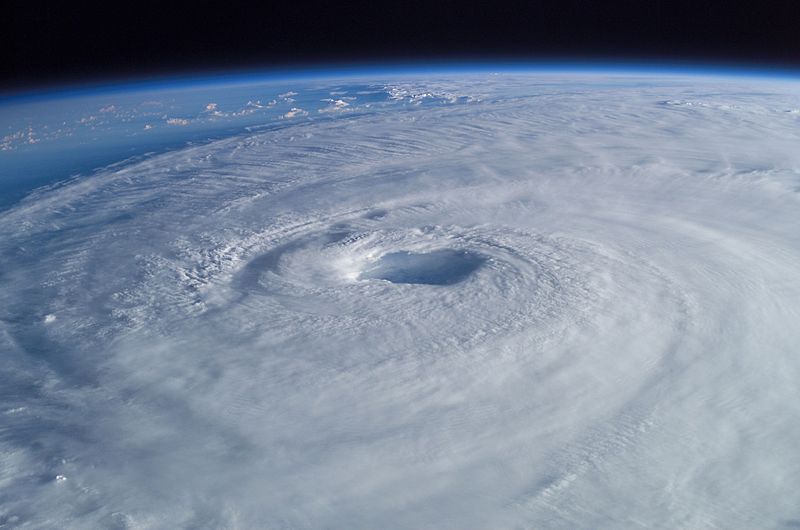
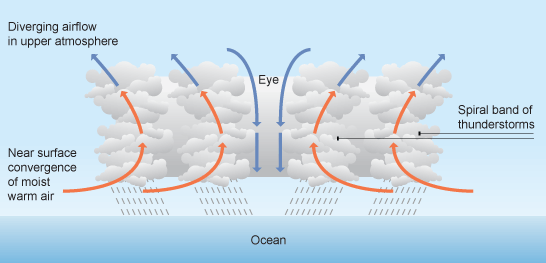
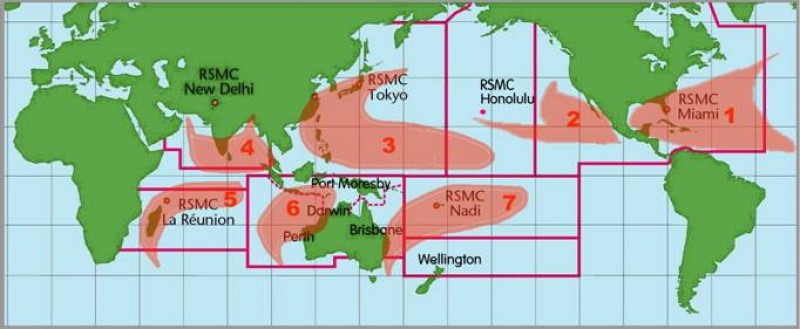
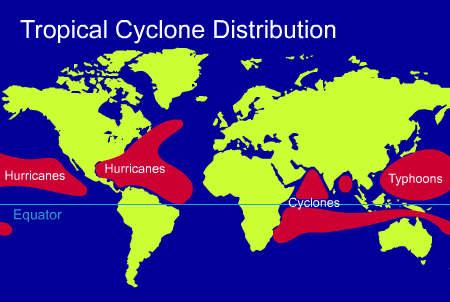
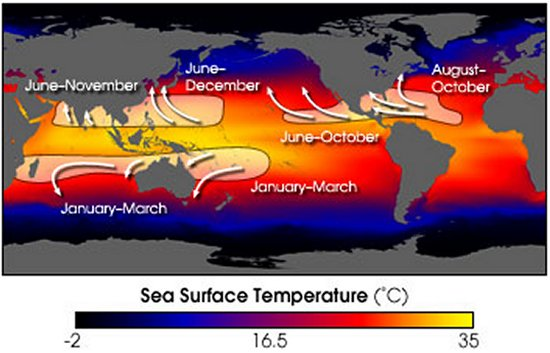
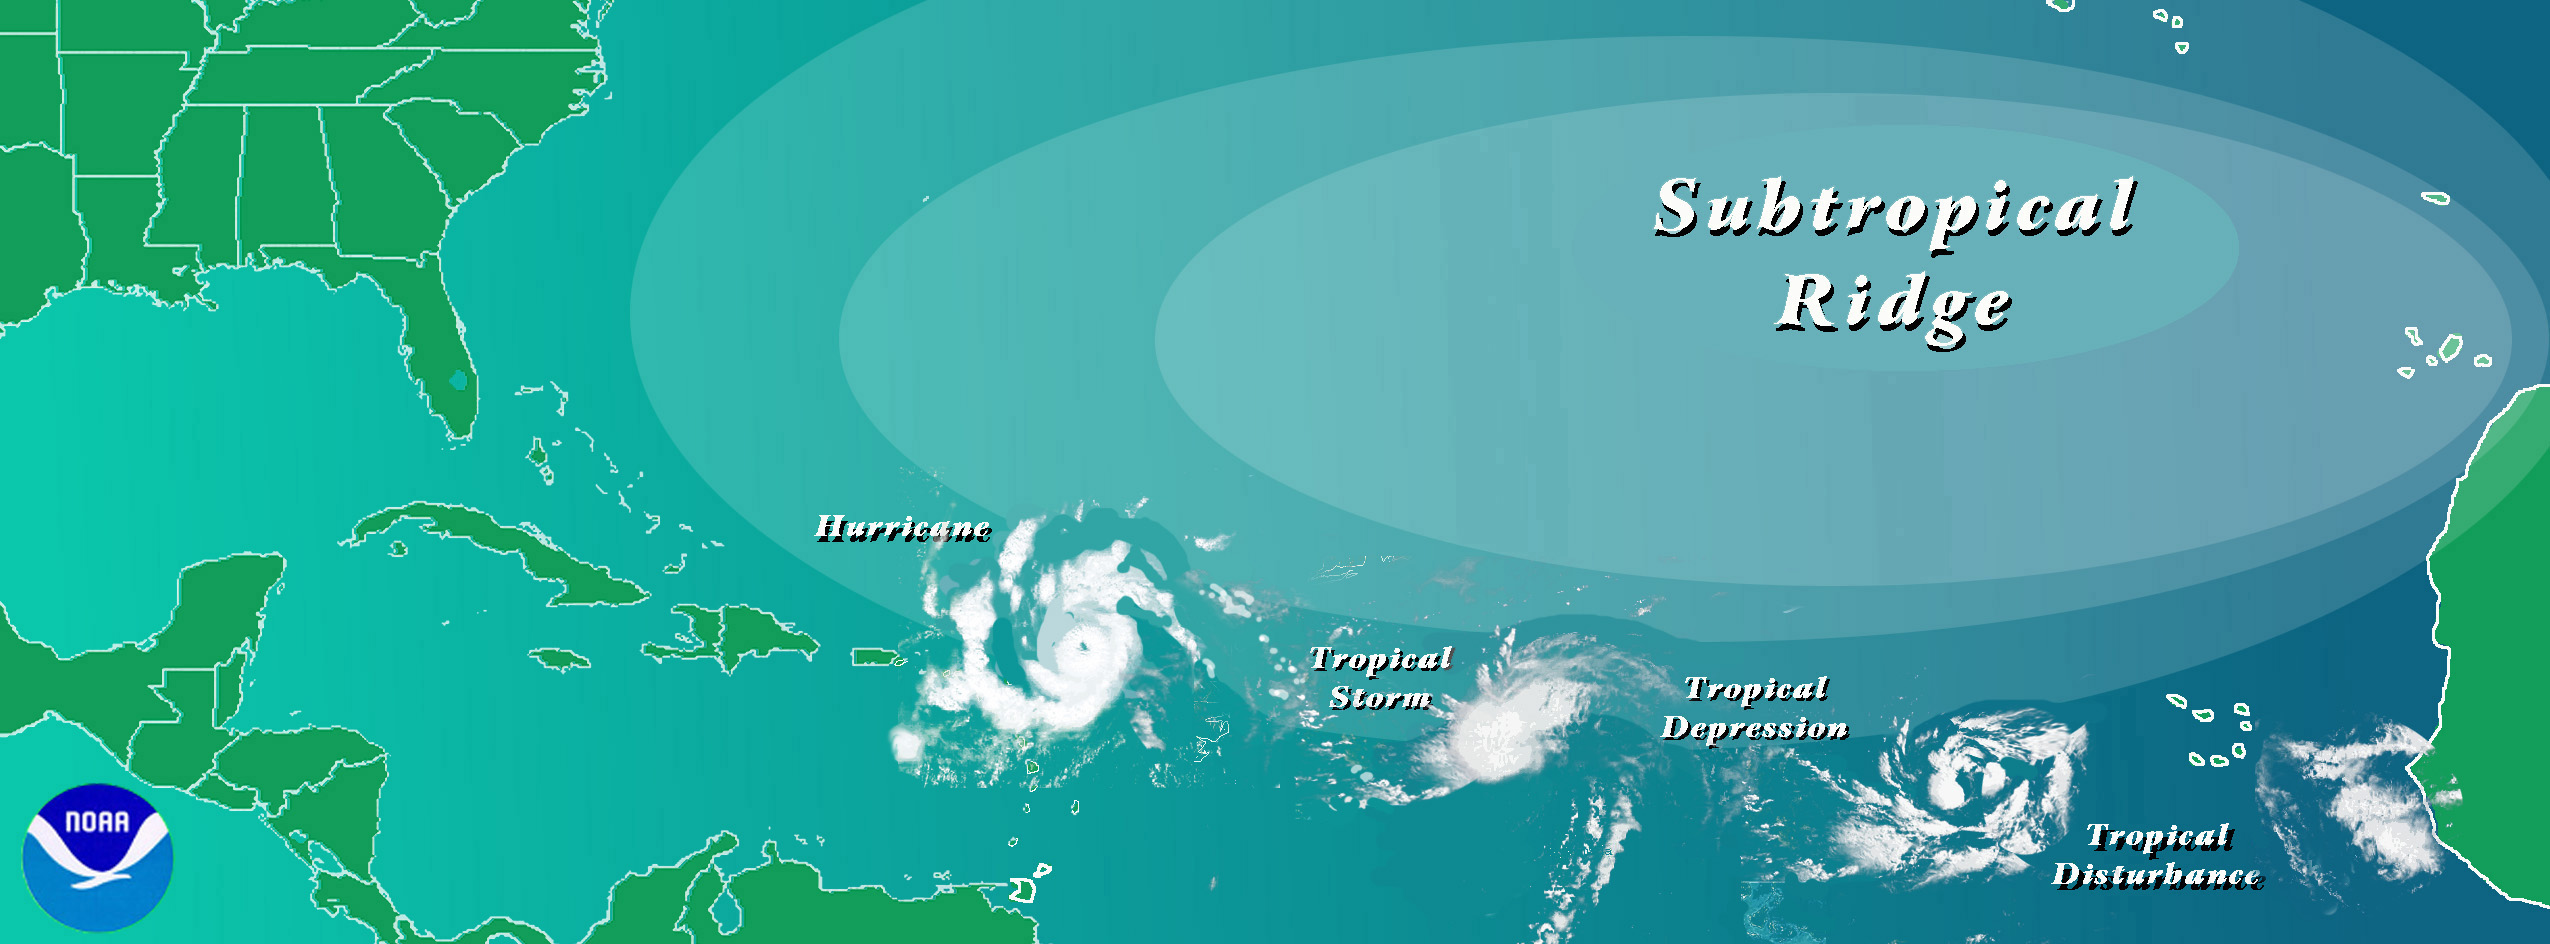
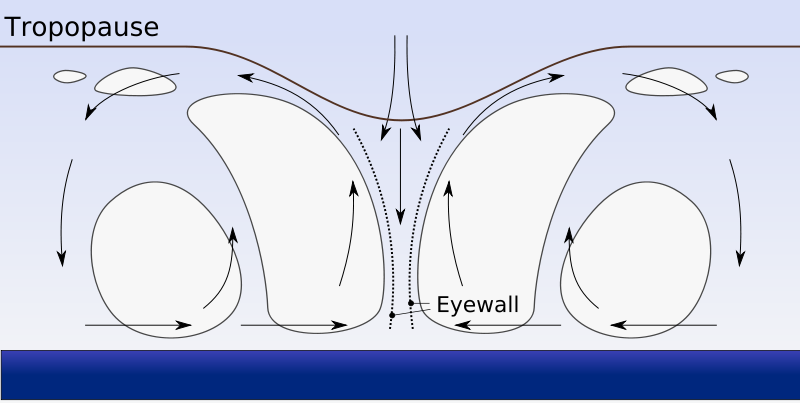
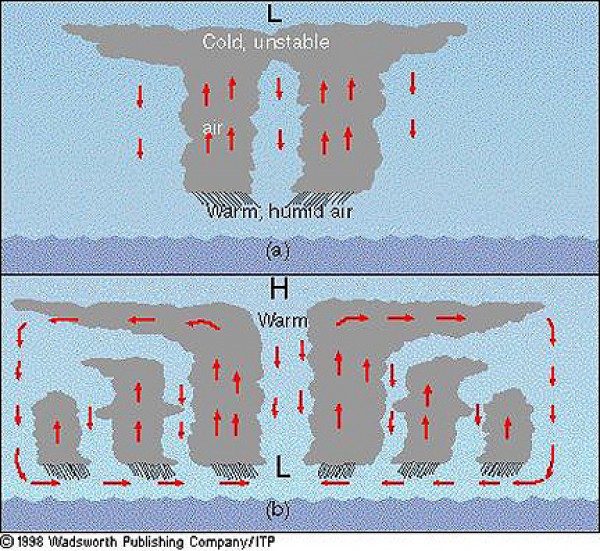
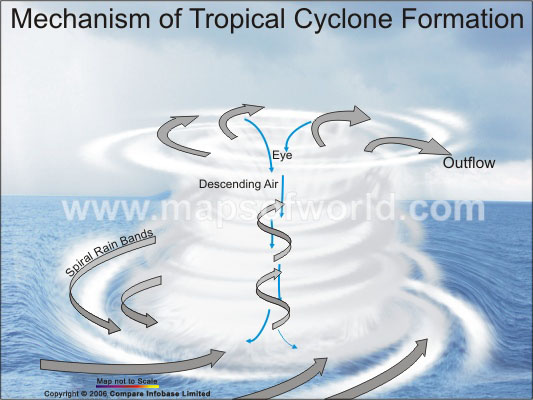
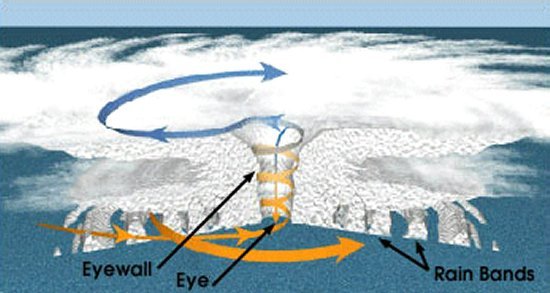
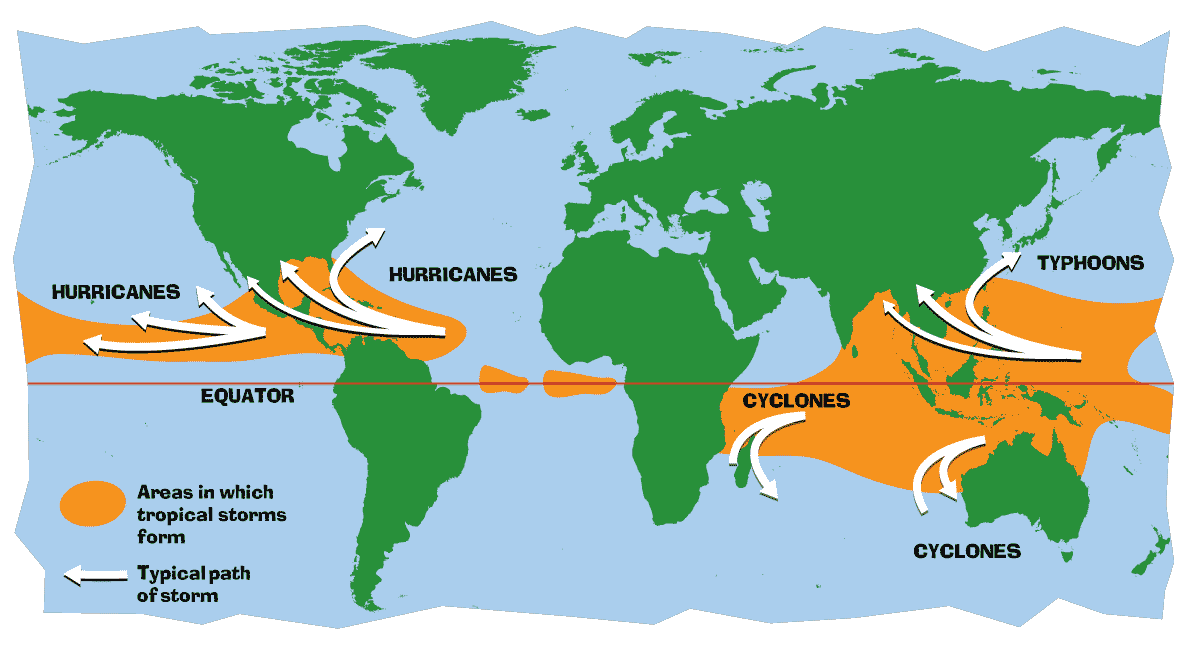
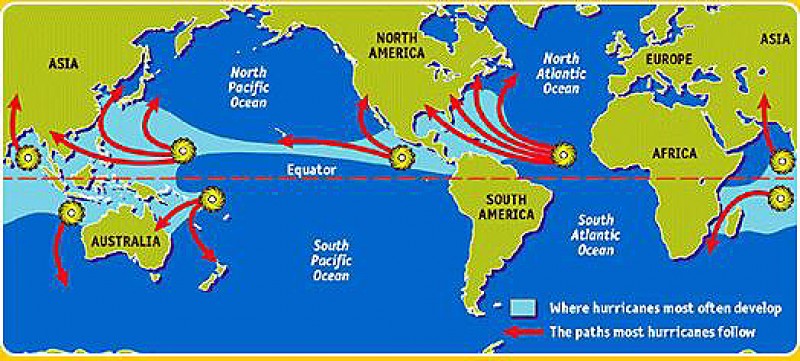

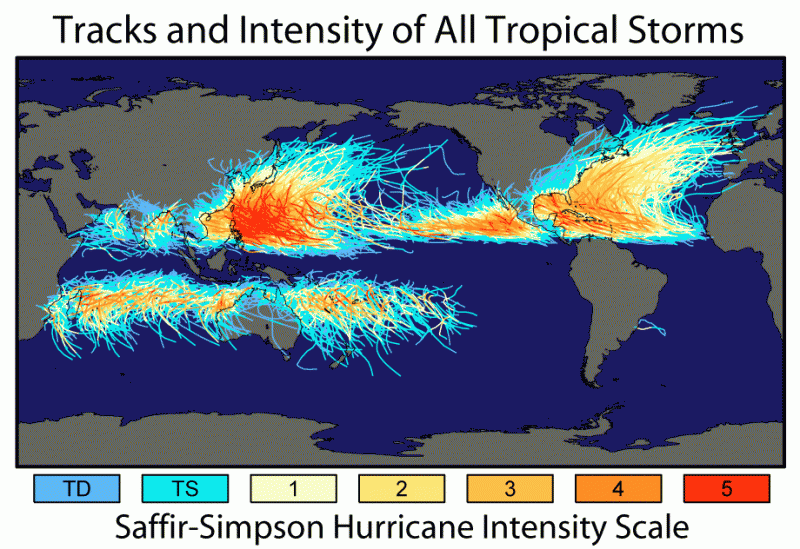
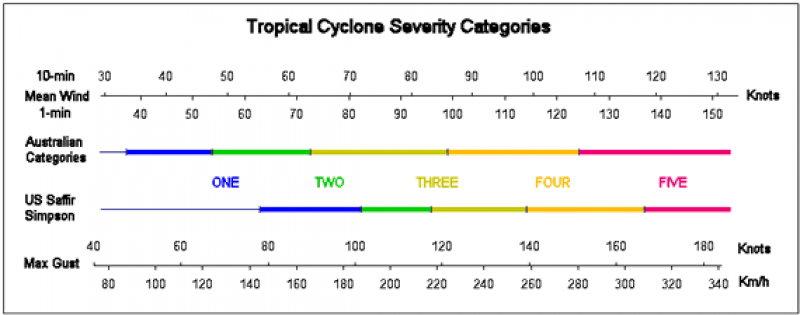

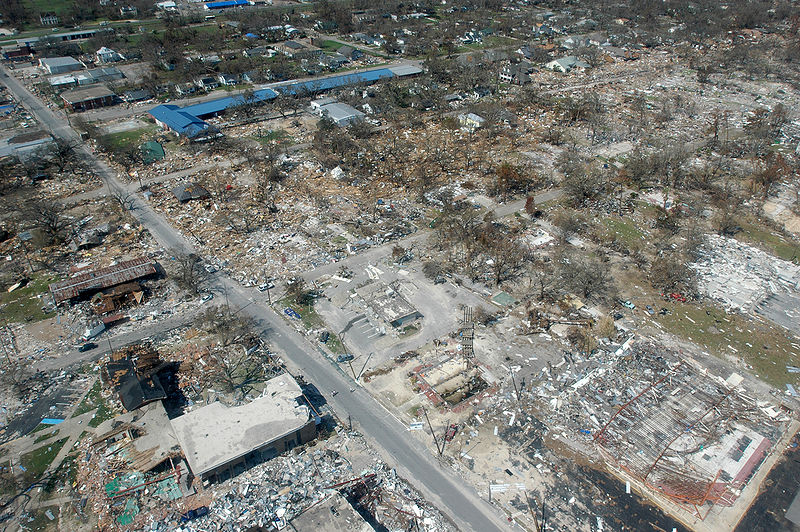
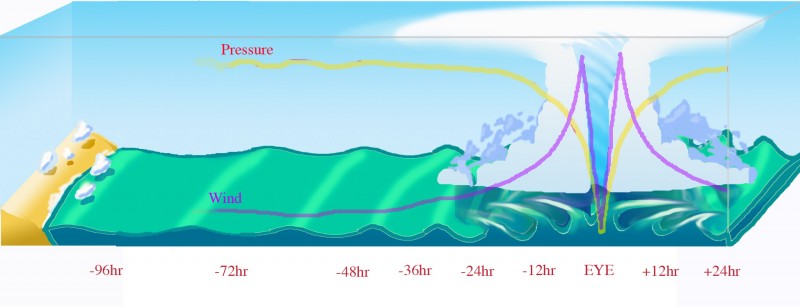

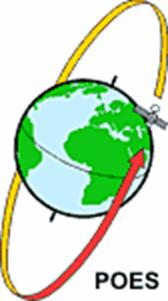
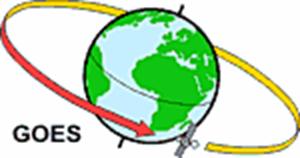
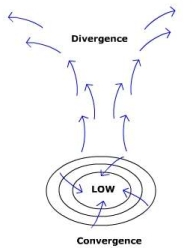
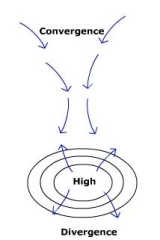
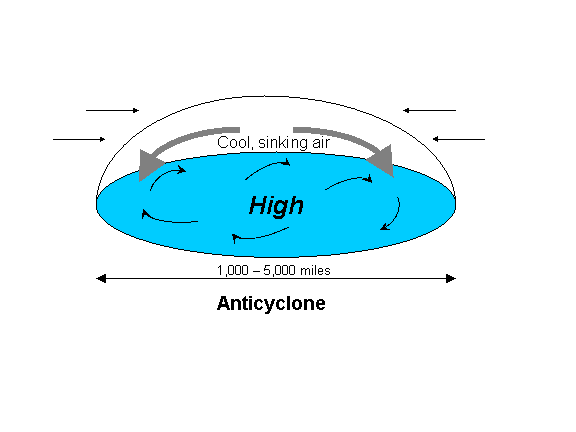
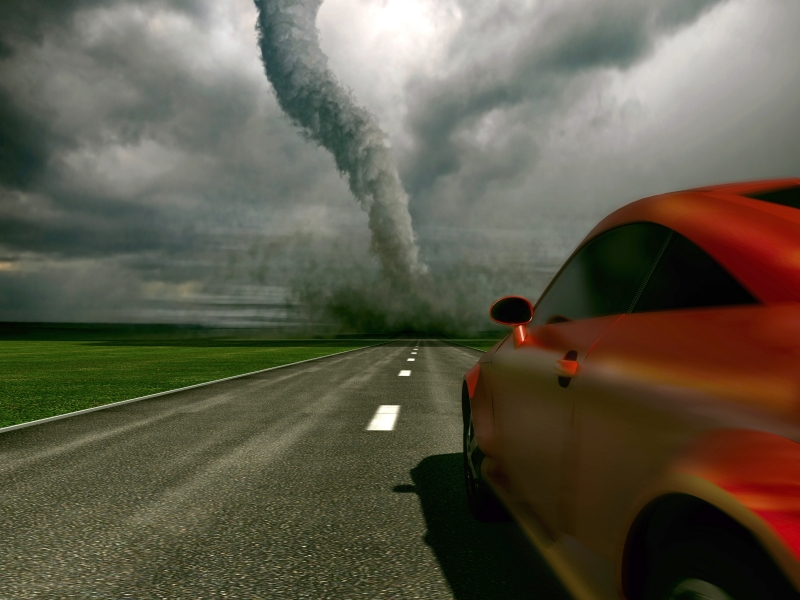


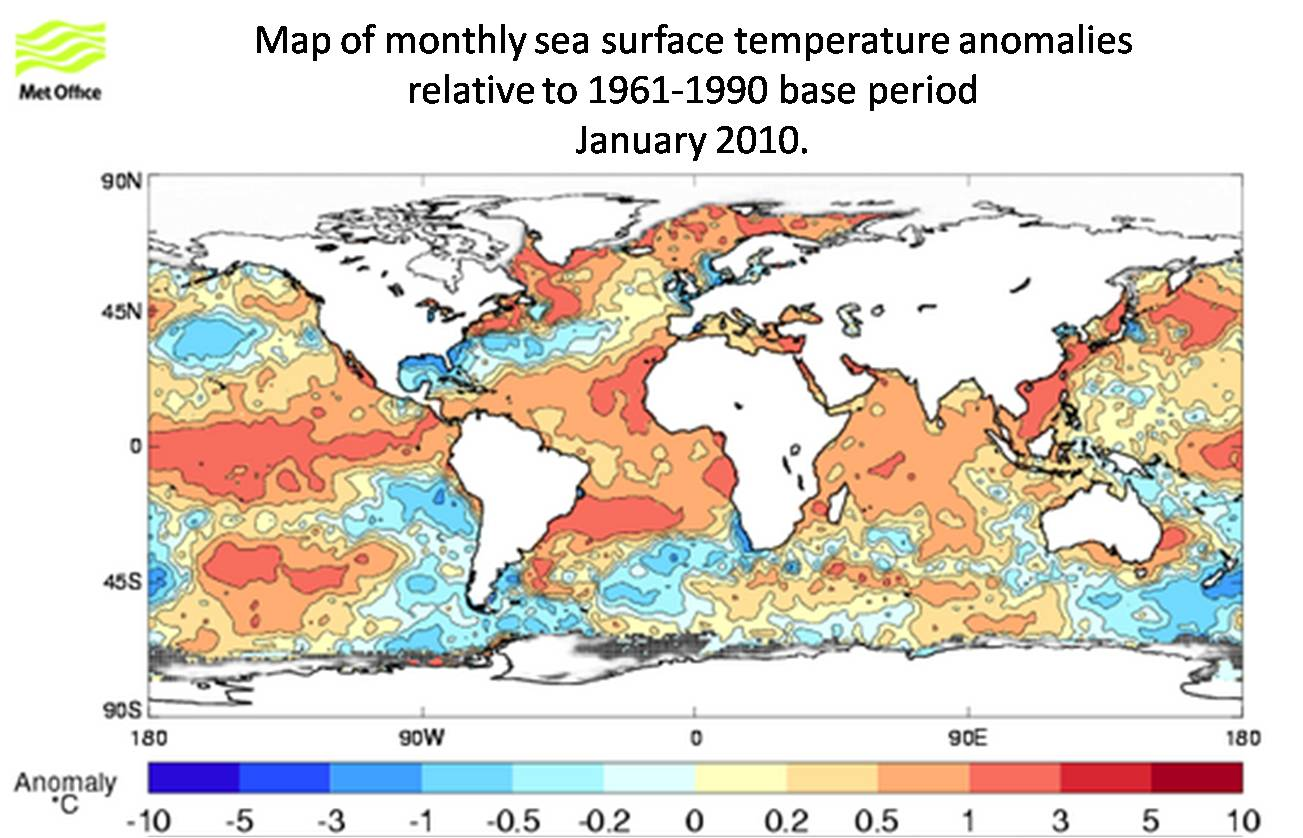
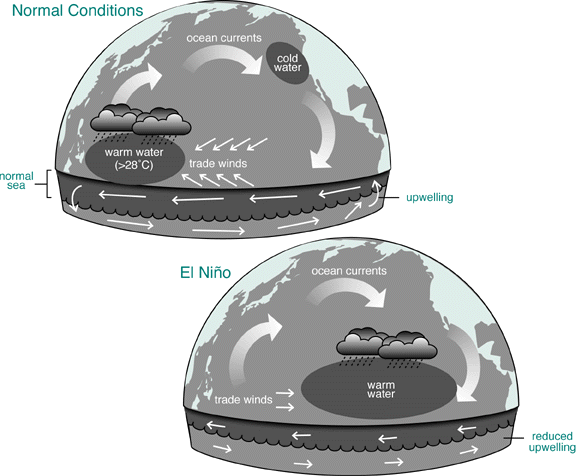


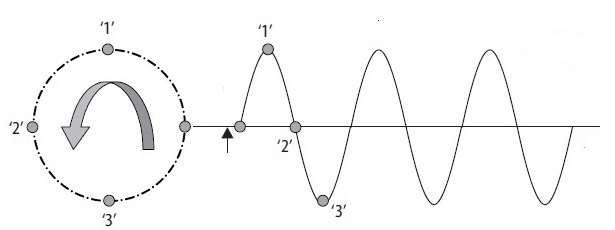

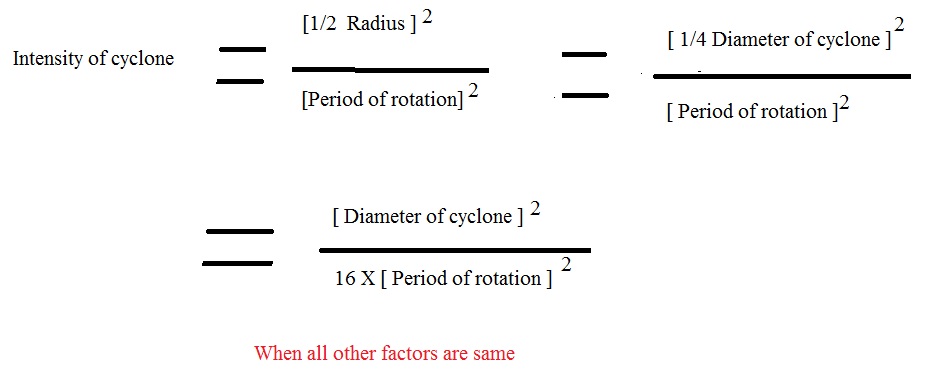
I am grateful to you.
Thanks for sharing, this is a fantastic post.Much thanks again. Really Cool.
Great, thanks for sharing this post. Much obliged.
I appreciate the stimulating content that you regularly provide.
Awesome blog post.Thanks Again. Much obliged.
Thanks for sharing, this is a fantastic post. Great.
I’m thankful for the depth and clarity of your blog post.
You’re one of the finest.
Really appreciate you sharing this blog. Want more.
Way cool! Some very valid points! I appreciate you writing this write-up and also the rest of the site is also very good.
Awesome blog.Really thank you! Really Great.
Great article.|
wow, awesome blog article.Really thank you! Really Cool.
Generally I don’t learn article on blogs, however I wish to say that this write-up very forced me to try and do it! Your writing taste has been amazed me. Thank you, very nice article.|
You need to be a part of a contest for one of the greatest blogs online. I most certainly will highly recommend this site!
Thanks for your personal marvelous posting! I definitely enjoyed reading it, you are a great author.I will be sure to bookmark your blog and will eventually come back in the foreseeable future. I want to encourage you to ultimately continue your great posts, have a nice morning!|
Perfect for showing your pals!
You manage difficult situations with poise as well as grace. You make others really feel accepted and also appreciated.
You ought to take part in a contest for one of the highest quality blogs online. I most certainly will highly recommend this website!|
Having read this I thought it was very enlightening. I appreciate you taking the time and energy to put this informative article together. I once again find myself spending a lot of time both reading and leaving comments. But so what, it was still worthwhile!
You really make it appear so easy along with your presentation however I to find this topic to be actually one thing that I believe I would never understand. It kind of feels too complex and very vast for me. I am having a look forward to your next put up, I’ll attempt to get the grasp of it!|
You are worthy of the best of everything in life. And also this product can assist you get there!
Incredible is the supreme social productivity application.
You ought to take part in a contest for one of the greatest blogs on the internet. I am going to highly recommend this website!
Good post. I learn something new and challenging on websites I stumbleupon everyday. It’s always helpful to read through articles from other writers and practice a little something from other sites.
Just want to say your article is as astonishing. The clarity to your publish is just nice and that i could suppose you’re an expert in this subject. Fine together with your permission let me to grasp your RSS feed to stay up to date with drawing close post. Thanks 1,000,000 and please keep up the rewarding work.|
Breathing in and out several times a day boosts your life profoundly.
You can have everything!
I really like and appreciate your blog article. Want more.
Obtain the most out of your day with this incredible item!
Presenting the Amazingness life hack. This straightforward change will certainly make your days extra joyful as well as productive .
Make every little thing much better with the Amazingness training course.
I admire your thought process and actions. It’s not every day I get to experience such kindness.
I do agree with all of the concepts you have offered on your post. They are really convincing and will definitely work. Still, the posts are very brief for beginners. Could you please lengthen them a little from next time? Thanks for the post.
Very good information. Lucky me I found your blog by accident (stumbleupon). I have bookmarked it for later!
I’m not sure where you’re getting your information, but good topic. I needs to spend some time learning much more or understanding more. Thanks for excellent info I was looking for this information for my mission.
I wanted to thank you for this good read!! I absolutely enjoyed every bit of it. I have got you book marked to check out new stuff you postÖ