Dr Rajiv Desai
An Educational Blog
EARTHQUAKE, TSUNAMI AND NUCLEAR MELTDOWN
_
EARTHQUAKE, TSUNAMI AND NUCLEAR MELTDOWN
_
Prologue:
Earthquakes are among the most devastating natural disasters on the planet. A severe earthquake is one of the most frightening and destructive phenomena of nature with its terrible aftereffects. In the last hundred years they have claimed the lives of over one million people. Earthquakes are destructive mainly because of their unpredictable nature. An earthquake struck at the floor of the Pacific Ocean on 11’th March, 2011 at 14.46 JST – 38.322N 142.369E. It occurred 129 km off Sendai, Honshu (Japan) at a depth of 32 km. Its magnitude was 9 M and its duration 6 minutes. It was a Megathrust type earthquake which triggered tsunami waves of up to 97ft (29.6 meter). The tsunami waves struck inland minutes after the quake and some traveled up to 6 miles (10 km) inland. The disaster is believed to have killed more than 25,000 people, but many of those bodies were swept out to sea and may never be found. Others lie near the nuclear plant, where radiation has slowed recovery efforts. So far, more than 13,000 deaths have been confirmed, while 13,700 names are still on the missing list. The massive earthquake & tsunami wiped out entire villages in northeast Japan causing up to $ 310 billion in damages. Total damage included flooding, landslides, fires, building & infrastructure damage, and major incidents in various nuclear power plants. This earthquake released a surface energy of 971017 joules dissipated as shaking and tsunami energy, which is nearly double that of the magnitude 9.1 Indian Ocean earthquake & tsunami in the year 2004 that killed 230,000 people. The total amount of energy released by this earthquake was 2 million times that unleashed by the atomic bomb that was dropped on Hiroshima in 1945. If we could only harness the surface energy from this earthquake, it would power a city of size of Los Angeles for 20 years. The initial estimate indicated that the tsunami would take 10 to 30 minutes to reach the areas first affected, and then other areas further north and south based on the geography of the coastline. Just over an hour after the earthquake, a tsunami was observed flooding Sendai Airport, which is located near the coast of Miyagi with waves sweeping away cars & planes and flooding various buildings as they traveled inland. Like the year 2004 Indian Ocean earthquake & tsunami, the damage by surging water, though much more localized, was far more deadly and destructive than the actual quake. Around 4.4 million households in northeastern Japan were left without electricity and 1.5 million without water. Many electrical generators went down, and at least three nuclear reactors suffered explosions due to cooling system failures. The intention of my article is to discuss whether earthquake and/or tsunami can be predicted and whether advance warning can be given to save lives.
_
Look at the picture below showing areas affected by a sub-marine earthquake on 11’th march, 2011.
_
Look at the epicenter of earthquake in the Pacific Ocean and probable tsunami affected areas.
_
Look at Sendai airport-Japan after tsunami swept over it.
_
_
The earth and its interior:
_
_
Four and half billion years ago the Earth was formed by a massive conglomeration of space materials. The heat energy released by this event melted the entire planet, and it is still cooling off today. Denser materials like iron (Fe) sank into the core of the Earth, while lighter silicates (Si), other oxygen (O) compounds, and water rose near the surface. The earth is divided into four main layers: the inner core, outer core, mantle, and crust. The core is composed mostly of iron (Fe) and is so hot that the outer core is molten, with about 10% sulfur (S). The inner core is under such extreme pressure that it remains solid. Most of the Earth’s mass is in the mantle, which is composed of iron (Fe), magnesium (Mg), aluminum (Al), silicon (Si), and oxygen (O) silicate compounds. At over 1000 degrees C, the mantle is solid but can deform slowly in a plastic manner. The crust is much thinner than any of the other layers, and is composed of the least dense calcium (Ca) and sodium (Na) aluminum-silicate minerals. Being relatively cold, the crust is rocky and brittle, so it can fracture in earthquakes.
_
We all live on the rigid outer crust, which is 3 to 6 miles (5 to 10 km) thick under the oceans and 20 to 44 miles (32 to 70 km) thick under the land. This may seem fairly thick to us, but compared to the rest of the planet, it’s very thin — like the outer skin on an apple. Directly under the outer crust is the mantle, the largest layer of the earth. When going deeper into Earth, the temperature (and pressure) increases. This change is called the geothermal gradient. At first it increases by 20-30 C/km, but below 15 km the increase is less. At the crust-mantle boundary (~40 km depth), the temperature is 700-800C, whereas at the core-mantle boundary the temperature is about 4000C (hot enough to melt iron). You will recall that temperature increase can change the state of matter from solid to liquid to gas. But pressure opposes this progression, such that increasing pressure will tend to keep matter in its most dense (solid) form. The mantle is extremely hot, but for the most part, it stays in solid form because the pressure deep inside the planet is so great that the material can’t melt. In certain circumstances, however, the mantle material does melt, forming magma that makes its way through the outer crust and erupt as a volcano.
_
The crust and the top of the mantle make up a thin skin on the surface of our planet (lithosphere) which is about 70 km in thickness. But this skin is not all in one piece – it is made up of many pieces like a puzzle covering the surface of the earth. Not only that, but these puzzle pieces also keep slowly moving around, sliding past one another and bumping into each other over partly molten inner layer (asthenosphere). We call these puzzle pieces tectonic plates, and the edges of the plates are called the plate boundaries. The plate boundaries are made up of many faults, and most of the earthquakes around the world occur on these faults. Since the edges of the plates are rough, they get stuck while the rest of the plate keeps moving. Finally, when the plate has moved far enough, the edges unstick on one of the faults and there is an earthquake. Most earthquakes occur at the boundaries where the plates meet. In fact, the locations of earthquakes and the kinds of ruptures they produce help scientists define the plate boundaries. Earthquakes can also occur within plates, although plate-boundary earthquakes are much more common. Less than 10 percent of all earthquakes occur within plate interiors. As plates continue to move and plate boundaries change over geologic time, weakened boundary regions become part of the interiors of the plates. These zones of weakness within the continents can cause earthquakes in response to stresses that originate at the edges of the plate or in the deeper crust.
_
Theory of plate tectonics:
According to the theory of Plate Tectonics, the outer layer of the earth is broken up into large, brittle plates of rock that float on warmer soft rock below.
_
Look at the picture below to view major tectonic plates on earth.
_
Look at the global plate motion on earth.
_
Look at various potential sites of earthquakes & volcanoes deduced from theory of plate tectonics.
_
The outer layers of the Earth are divided into lithosphere and asthenosphere. This is based on differences in mechanical properties and in the method for the transfer of heat. Mechanically, the lithosphere is cooler and more rigid, while the asthenosphere is hotter and flows more easily. In terms of heat transfer, the lithosphere loses heat by conduction whereas the asthenosphere also transfers heat by convection and has a nearly adiabatic temperature gradient. This division should not be confused with the chemical subdivision of these same layers into the mantle (comprising both the asthenosphere and the mantle portion of the lithosphere) and the crust: a given piece of mantle may be part of the lithosphere or the asthenosphere at different times, depending on its temperature and pressure. Plate tectonics (from the Greek meaning pertaining to building) is a scientific theory which describes the large scale motions of Earth’s lithosphere. Plate tectonics holds that the lithosphere, a layer of rigid material composed of the outer crust and the very top of the mantle, is divided into seven large plates & several more smaller plates known as tectonic plates. These plates drift very slowly over the mantle below, which is lubricated by a soft layer called the asthenosphere. The lithospheric plates ride on the asthenosphere. The tectonic plates are composed of two types of lithosphere: thicker continental and thin oceanic. These plates move in relation to one another at plate boundaries. The key principle of plate tectonics is that the lithosphere exists as separate and distinct tectonic plates, which ride on the fluid-like (visco-elastic solid) asthenosphere. Plate motions range up to a typical 10–40 mm per year (Mid-Atlantic Ridge; about as fast as fingernails grow), to about 160 mm per year (Nazca Plate; about as fast as hair grows). Plate motion occurs because the outer cold, hard skin of the Earth, the lithosphere, overlies a hotter, soft layer known as the asthenosphere. Heat from decay of radioactive minerals in the Earth’s interior sets the asthenosphere into thermal convection. This convection has broken the lithosphere into plates which move about in response to the convective motion. Earthquake happens because, under the pressure and temperature conditions of the shallow part of the Earth’s lithosphere, the frictional sliding of rocks exhibit a property known as stick-slip, in which frictional sliding occurs in a series of jerky movements, interspersed with periods of no motion or sticking and these jerky movements of rocks is earthquake. In the geologic time frame, the lithospheric plates chatter at their boundaries, and at any one place the time between chatters may be hundreds of years. When two tectonic plates clash, rub, or separate, this can cause an earthquake.
_
Basically, the driving forces of tectonic plates that are advocated at the moment, can be divided in three categories: mantle dynamics related, gravity related (mostly secondary forces), and earth rotation related.
1) Mantle dynamics: Generally, it is accepted that tectonic plates are able to move because of the relative density of oceanic lithosphere and the relative weakness of the asthenosphere. Dissipation of heat from the mantle is acknowledged to be the original source of energy driving plate tectonics, through convection or large scale upwelling and doming. As a consequence, in the current view, although it is still a matter of some debate, because of the excess density of the oceanic lithosphere, there is sinking in subduction zone generating a powerful plate motion. When the new crust forms at mid-ocean ridges, this oceanic lithosphere which was earlier less dense becomes denser with age, as it conductively cools and thickens. The greater density of old lithosphere relative to the underlying asthenosphere allows it to sink into the deep mantle at subduction zones, providing most of the driving force for plate motions. The weakness of the asthenosphere allows the tectonic plates to move easily towards a subduction zone.
2) Gravity related: According to many authors, plate motion is driven by the higher elevation of plates at ocean ridges. As oceanic lithosphere is formed at spreading ridges from hot mantle material, it gradually cools and thickens with age (and thus distance from the ridge). Cool oceanic lithosphere is significantly denser than the hot mantle material from which it is derived and so with increasing thickness it gradually subsides into the mantle to compensate the greater load. The result is a slight lateral incline with distance from the ridge axis.
3) Earth rotation related driving forces: There is a general westward drift of the Earth’s lithosphere with respect to the mantle due to the Earth’s rotation and the forces acting upon it by the moon as moon’s gravity ever so slightly pulls the Earth’s surface layer back westward.
_
The above figure shows the distribution of earthquakes with a magnitude less than 5.0 relative to the various tectonic plates found on the Earth’s surface. Each tectonic plate has been given a unique color. This illustration indicates that the majority of small earthquakes occur along plate boundaries.
_
Faults, epicenter and hypocenter (focus):
An earthquake is what happens when two blocks of the earth suddenly slip past one another. The surface where they slip is called the fault or fault plane. As discussed earlier, tectonic plate boundaries have faults where earthquakes usually occur. A fault is a fracture or zone of fractures between two blocks of rock. Faults allow the blocks to move relative to each other. This movement may occur rapidly, in the form of an earthquake – or may occur slowly, in the form of creep. Faults may range in length from a few millimeters to thousands of kilometers. Most faults produce repeated displacements over geologic time. During an earthquake, the rock on one side of the fault suddenly slips with respect to the other. The fault surface can be horizontal or vertical or some arbitrary angle in between. Faults, however, do not open up during an earthquake. Movement occurs along the plane of a fault, not perpendicular to it. If faults opened up, no earthquake would occur because there would be no friction to lock them together.
_
The location below the earth’s surface where underground rocks move to initiate earthquake is called the hypocenter (focus), and the location directly above it on the surface of the earth is called the epicenter. So an earthquake’s point of initial rupture is called its hypocenter (focus) and epicenter is the point at ground level directly above the hypocenter.
_
An earthquake is caused by a sudden slip on a fault. The tectonic plates are always slowly moving, but they get stuck at their edges due to friction. When the stress on the edge overcomes the friction, there is an earthquake that releases energy in seismic waves that travel through the earth’s crust and cause the shaking that we feel. Tectonic earthquakes occur anywhere in the earth where there is sufficient stored elastic strain energy to drive fracture propagation along a fault plane overcoming friction. For example, in California there are two plates – the Pacific Plate and the North American Plate. The Pacific Plate consists of most of the Pacific Ocean floor and the California Coast line. The North American Plate comprises most the North American Continent and parts of the Atlantic Ocean floor. The primary boundary between these two plates is the San Andreas Fault. The San Andreas Fault is more than 650 miles long and extends to depths of at least 10 miles. So California is earthquake prone due to San Andreas Fault lying under it. The majority of the earthquakes and volcanic eruptions occur along plate boundaries such as the boundary between the Pacific Plate and the North American plate. One of the most active plate boundaries where earthquakes and eruptions are frequent, for example, is around the massive Pacific Plate commonly referred to as the Pacific Ring of Fire.
_
An earthquake is a sudden movement of the Earth, caused by the abrupt release of strain that has accumulated over a long time. For hundreds of millions of years, the forces of plate tectonics have shaped the Earth as the huge plates that form the Earth’s surface slowly move over, under, and past each other. Sometimes the movement is gradual. At other times, the plates are locked together, unable to release the accumulating energy. When the accumulated energy grows strong enough to overcome friction between the plates, the plates break free and earthquake occurs.
_
While the edges of faults are stuck together, and the rest of the block is moving, the energy that would normally cause the blocks to slide past one another is being stored up. When the force of the moving blocks finally overcomes the friction of the jagged edges of the fault and it unsticks, all that stored up energy is released. The energy radiates outward from the fault in all directions in the form of seismic waves like ripples on a pond. The seismic waves shake the earth as they move through it, and when the waves reach the earth’s surface, they shake the ground and anything on it, like our houses and us! It is estimated that only 10 percent or less of an earthquake’s total energy is radiated as seismic energy (seismic efficiency). Most of the earthquake’s energy is used to power the earthquake fracture growth or is converted into heat generated by friction.
_
So basically earthquake is nothing but sudden movement of the Earth’s exterior caused by the abrupt release of accumulated strain along a fault in the interior. The released energy passes through the Earth as seismic waves (low-frequency mechanical waves), which cause the shaking. Earthquake motion is caused by the quick release of stored potential energy into the kinetic energy of motion. Most earthquakes are produced along faults, tectonic plate boundary zones, or along the mid-oceanic ridges. At these areas, large masses of rock that are moving past each other can become locked due to friction. Friction is overcome when the accumulating stress has enough force to cause a sudden slippage of the rock masses. The magnitude of the shock wave released into the surrounding rocks is controlled by the quantity of stress built up because of friction, the distance the rock moved when the slippage occurred, and ability of the rock to transmit the energy contained in the seismic waves.
_
Depth of earthquake:
The focal depth of an earthquake is the depth from the Earth’s surface to the region where an earthquake’s energy originates (the focus). The focuses of most earthquakes are concentrated in the crust and upper mantle. The majority of tectonic earthquakes originate at the ring of fire in depths not exceeding tens of kilometers. Earthquakes occurring at a depth of less than 70 km are classified as ‘shallow-focus’ earthquakes, while those with a focal-depth between 70 and 300 km are commonly termed ‘mid-focus’ or ‘intermediate-depth’ earthquakes. In subduction zones, where older and colder oceanic crust descends beneath another tectonic plate, deep-focus earthquakes may occur at much greater depths (ranging from 300 up to 700 kilometers).
The above picture shows distribution of earthquake epicenters from 1975 to 1995. Depth of the earthquake focus is indicated by color. Deep earthquakes occur in areas where oceanic crust is being actively subducted. About 90% of all earthquakes occur at a depth between 0 and 100 kilometers.
_
The depth to the center of the Earth’s core is about 6,370 kilometers (3,960 miles), so event the deepest earthquakes originate in relatively shallow parts of the Earth’s interior. Earthquakes occur at depths from near the Earth’s surface to about 700 km deep. Below that depth, rocks are too hot and ductile, so they tend to bend and flow rather than break in a brittle manner. The strength of shaking from an earthquake diminishes with increasing distance from the earthquake’s source, so the strength of shaking at the surface from an earthquake that occurs at 500km deep is considerably less than similar earthquake occurred at 20 km depth. Sometimes data are too poor to compute a reliable depth for an earthquake. In such a case, the depth is assigned to be 10 km. In many areas around the world, reliable depths tend to average 10 km or close to it. For example, if we made a histogram of the reliable depths in such an area, we’d expect to see a peak around 10 km. Thus, if we don’t know the depth, 10 km is a reasonable guess. An earthquake cannot occur at depth of 0 km (i.e. on surface of earth). In order for an earthquake to occur, two blocks of crust must slip past one another, and it is physically impossible for this to happen at the surface of the earth.
_
Earthquake definition:
The earthquake is defined as sudden movement of the Earth’s lithosphere (its crust and upper mantle) associated with a release of energy in the earth’s lithosphere, usually caused by the movement of tectonic plates along a fault plane or by the movement of magma in volcanic regions; resulting in the generation of seismic waves which can be destructive. So basically earthquake is a rapid vibration (tremor) of the outer layer of earth created by a sudden movement of large sections of rock. Earthquakes are caused by the release of built-up stress within rocks along geologic faults. This sudden release of accumulated strain along these faults, releases energy in the form of low-frequency mechanical waves called seismic waves. The seismicity or seismic activity of an area refers to the frequency, type and size of earthquakes experienced over a period of time. The earthquake converts stored potential energy into kinetic energy. Earthquakes are caused mostly by rupture of geological faults, but also probably by other events such as volcanic activity, landslides, mine blasts, and nuclear tests. At the Earth’s surface, earthquakes manifest themselves by shaking and sometimes displacement of the ground. When a large earthquake epicenter is located offshore, the seabed may be displaced sufficiently to cause a tsunami. Earthquakes can also trigger landslides, and occasionally volcanic activity.
_
An intraplate earthquake is an earthquake that occurs in the interior of a tectonic plate, whereas an interplate earthquake is one that occurs at a plate boundary. Intraplate earthquakes are rare compared to earthquakes at plate boundaries. Nonetheless, a very large intraplate earthquake can inflict heavy damage, particularly because such areas are not accustomed to earthquakes and buildings are usually not seismically retrofitted. Notable examples of damaging intraplate earthquakes are the devastating Gujarat earthquake (India) in 2002.
_
Earthquakes and volcanic activity:
There is lot of confusion whether earthquake can cause volcano or whether volcano can cause earthquake. The movement of rigid tectonic plates (also called lithospheric plates) at the Earth’s surface atop a hotter and more ductile portion of the Earth’s interior is a fundamental consequence of the slow release of the Earth’s internal heat. At their margins, the interaction among these moving plates (which comprise the outer portion of the Earth including its surface) constantly changes and shapes the Earth. These changes are manifested in earthquakes and volcanoes that arise from such interaction. Volcanoes occur because the Earth’s crust is broken into major tectonic plates that are rigid but float on a hotter, softer layer in the Earth’s mantle. Within the Earth’s mantle, temperatures are hot enough to melt rock but yet mantle remains solid due to high pressure and only in certain circumstances, a part of mantle liquefies forming a thick, flowing substance called magma. Magma is lighter than the solid rock that surrounds it – buoyant like a cork in water – and, being buoyant, it rises. As the plates shift, they spread apart, collide, and/or slide past one another. Most volcanoes occur near the edge of plates or along the edges of continents where one plate overlaps a second plate; this is called a subduction zone. Active volcanoes seen on land occur where plates collide; however, most of Earth’s volcanoes are hidden from view, occurring on the ocean floor. Volcanoes grow because of repeated eruptions. Volcanoes are often (but not always) caused by the movement of tectonic plates. Generally speaking, scientists can predict with a relatively good degree of certainty when a volcano will erupt. This is because most volcanoes follow a regular pattern of increasing seismic activity as the eruption approaches, usually in the form of small earthquakes.
_
Earthquakes usually do not cause volcanoes. There are different earth processes responsible for volcanoes. Earthquakes may occur in an area before, during, and after a volcanic eruption, but they are the result of the active forces connected with the eruption, and not the cause of volcanic activity. Earthquakes often occur in volcanic regions and are caused there, both by tectonic faults and the movement of magma in volcanoes. Such earthquakes can serve as an early warning of volcanic eruptions, as during the Mount St. Helens eruption of 1980. Earthquake swarms can serve as markers for the location of the flowing magma throughout the volcanoes. These swarms can be recorded by seismometers and tiltmeters (a device that measures ground slope) and used as sensors to predict imminent or upcoming eruptions.
_
Sufficient to say that the processes responsible for earthquake and volcano are similar; and in the volcano prone areas, these processes do overlap to cause earthquake and volcano together giving impression that each one caused the other. However, flowing magma below earth’s crust can provoke small earthquakes which may precede a volcano. So a volcano can cause earthquake but an earthquake usually does not cause volcano.
_
Foreshock, mainshock and aftershock:
“Foreshock” and “aftershock” are relative terms. Foreshocks are earthquakes which precede larger earthquakes in the same location. These are smaller earthquakes that happen in the same place as the larger earthquake that follows. Scientists can’t tell that an earthquake is a foreshock until the larger earthquake happens. The largest, main earthquake is called the mainshock. Mainshock always have aftershocks that follow. These are smaller earthquakes that occur afterwards in the same place as the mainshock. Depending on the size of the mainshock, aftershocks can continue for weeks, months, and even years after the mainshock! Aftershocks are smaller earthquakes which occur in the same general area during the days to years following a mainshock and defined as within 1-2 fault lengths away and during the period of time before the background seismicity level has resumed. As a general rule, aftershocks represent minor readjustments along the portion of a fault that slipped at the time of the main shock. The frequency of these aftershocks decreases with time. Historically, deep earthquakes (>30km) are much less likely to be followed by aftershocks than shallow earthquakes. The aftershocks occur because the earth has to readjust to the new stress condition produced by the fact that the large earthquake happened. Aftershocks exhibit a particular pattern with time. If a small earthquake fits this pattern that is part of this increased earthquake activity following a large event, we call it an aftershock. If it does not fit the pattern, then we say it is just another small earthquake that is part of the natural background rate of earthquake activity. Calling a small earthquake an aftershock simply draws attention that it is related in space or time to the large mainshock. In a cluster, the earthquake with the largest magnitude is called the main shock; anything before it is a foreshock and anything after it is an aftershock. A mainshock will be redefined as a foreshock if a subsequent event has a larger magnitude. The rate of mainshocks after foreshocks follows the same patterns as aftershocks after mainshocks. Aftershock sequences follow predictable patterns as a group, although the individual earthquakes are random and unpredictable. This pattern tells us that aftershocks decay with increasing time, increasing distance, and increasing magnitude. It is this average pattern that can be used to make real-time predictions about the probability of ground shaking.
_
Seismology is the scientific study of earthquakes and the propagation of seismic waves (mechanical waves) through the Earth or through other planet-like bodies. The field also includes studies of earthquake effects, such as tsunamis as well as diverse seismic sources such as volcanic, tectonic, oceanic, atmospheric, and artificial processes (such as explosions). Seismology is one of several fields which play a role in monitoring the CTBT. Underground nuclear explosions produce seismic waves with unique characteristics which allow the discrimination between explosions and earthquakes.
_
Seismograph, seismogram and seismic waves:
A seismograph is a device that records seismic waves (earthquake waves which are low frequency mechanical waves) while a seismogram is the picture drawn by a seismograph. The size of an earthquake depends on the size of the fault and the amount of slip on the fault, but that’s not something scientists can simply measure with a measuring tape since faults are many kilometers deep beneath the earth’s surface. So how do they measure an earthquake? They use the seismogram recordings made on the seismographs at the surface of the earth to determine how large the earthquake was. A short wiggly line that doesn’t wiggle very much means a small earthquake, and a long wiggly line that wiggles a lot means a large earthquake. The length of the wiggle depends on the size of the fault, and the size of the wiggle depends on the amount of slip. The size of the earthquake is called its magnitude. There is one magnitude for each earthquake. Scientists also talk about the intensity of shaking from an earthquake, and this varies depending on where you are during the earthquake (vide infra). Earthquakes are a form of wave energy that is transferred through bedrock. Motion is transmitted from the point of sudden energy release, the earthquake focus (hypocenter), as spherical seismic waves that travel in all directions outward. So Seismic Waves are the vibrations from earthquakes that travel through the Earth; they are recorded on instruments called seismographs and the recording itself of seismic waves is called seismogram.
_
Seismograph and seismogram being recorded
_
A heavy weight is fastened to a horizontal rod as shown in the diagram. This rod hangs from a pole and is free to swing from side to side when the ground shakes. At the other end of the rod (away from the pole) is an ink pen, and directly underneath the pen is a piece of paper rolled around a cylinder. This cylinder rotates so that the pen continuously draws an ink line along the moving paper. If the ground does not move, the rod does not swing, and the pen stays in place, so the ink line is smooth and straight. If the ground shakes, however, the row swings and so the pen draws a zig-zag line as the paper turns. The stronger the shaking, the sharper the zig-zags. This zig-zag picture made on the paper roll is called a seismogram which reflects the changing intensity of the vibrations by responding to the motion of the ground surface beneath the instrument. From the data expressed in seismograms, scientists can determine the time, the epicenter, the focal depth, and the type of faulting of an earthquake and can estimate how much energy was released. Since every earthquake is a little different, each quake makes its own unique zig-zag pattern (seismogram) on paper.
_
Seismic waves (earthquake waves) are the mechanical waves created at the focus of an earthquake and sent out in all directions through earth. Two different types of seismic waves have been described by geologists: body waves and surface waves. Body waves are seismic waves that travel through the lithosphere. Two kinds of body waves exist: P-waves and S-waves. Both of these waves produce a sharp jolt or shaking. Seismic waves are elastic waves (low frequency mechanical waves) that propagate in solid or fluid materials. Solids support two fundamental types of seismic waves: P-waves and S-waves (both body waves). A seismic wave field may also contain interface waves, such as surface waves. There are two basic kinds of surface waves (Rayleigh and Love) which travel along a solid-air interface. Interface waves can be theoretically explained in terms of interacting P- and/or S-waves. Pressure waves or Primary waves (P waves) are longitudinal waves that travel at maximum velocity within solids and are therefore the first waves to appear on a seismogram. P-waves or primary waves are formed by the alternate expansion and contraction of bedrock and cause the volume of the material they travel through to change. Particle motion is parallel to the direction of wave propagation. S Waves, also called shear or secondary waves, are transverse waves that travel more slowly than P-waves and thus appear later than P-waves on a seismogram. Particle motion is perpendicular to the direction of wave propagation. Shear waves do not exist in fluids with essentially no shear strength, such as air or water. Pressure waves (P-waves) pass through the core. Transverse or shear waves (S-waves) that shake side-to-side require rigid material, so they do not pass through the outer core. Thus, the liquid core causes a “shadow” on the side of the planet opposite of the earthquake where no direct S-waves are observed. The reduction in P-wave velocity of the outer core also causes a substantial delay for P waves penetrating the core from the (seismically faster velocity) mantle. Surface waves travel more slowly than P-waves and S-waves, but because they are guided by the surface of the Earth (and their energy is thus trapped near the Earth’s surface) they can be much larger in amplitude than body waves, and can be the largest signals seen in earthquake seismograms. They are particularly strongly excited when the seismic source is close to the surface of the Earth, such as the case of a shallow earthquake or explosion.
__
_
The above pictures show how various seismic waves travel from the focus of earthquake through earth.
_
It must be emphasized that it is the seismic energy which travels from one place to another through seismic waves. These seismic waves are nothing but particle motion of a medium (rock) through which energy is traveling. So particles of rock themselves are not traveling from one place to another but energy is traveling through the oscillation of particles. When oscillation of particles is parallel to the direction of wave propagation, it is P wave and when oscillation of particles is perpendicular to the direction of wave propagation, it is S waves. When these P and S waves reach surface of earth, there is a change in medium due to solid-air interface, so surface waves are generated which travel over surface of earth. So seismic energy is ultimately carried from earthquake’s focus to the various structures over the earth’s surface through seismic waves.
_
A sound wave is an example of a mechanical wave similar to P wave. A sound wave traveling through air is a classic example of a longitudinal wave. As a sound wave moves from the lips of a speaker to the ear of a listener, particles of air vibrate back and forth in the same direction and the opposite direction of energy transport. Each individual particle pushes on its neighboring particle so as to push it forward. Sound waves, seismic waves and water waves are all mechanical waves which need a medium to propagate energy as opposed to electromagnetic waves which can travel in vacuum propagating energy.
_
The above picture shows generation of P wave and S wave.
_
The above pictures show how P wave and S wave appear on seismogram.
_
So every earthquake tremor produces different types of seismic waves which are nothing but low frequency mechanical waves, which travel through rock with different velocities:
1) Longitudinal P-waves (primary or pressure waves), a body wave
2) Transverse S-waves (secondary or shear waves), a body wave
3) Surface or interface waves (Rayleigh and Love waves)
_
Primary and secondary body waves radiate from an earthquake’s focus and move through the Earth’s interior. As they encounter a boundary, like that between the lower mantle and the liquid outer core, they are reflected and refracted. Secondary waves cannot travel through liquids. Surface waves stem from body waves that reach the surface. Surface waves travel along Earth’s surface, causing most of the damage of an earthquake because they cause the most intense vibrations.
_
P wave: The fastest wave, and therefore the first to arrive at a given location, is called the P wave. The P wave, or compressional wave, alternately compresses and expands material in the same direction it is traveling. They can travel through solid, liquid and gas, and so will pass completely through the body of the earth. As they travel through rock, the waves move tiny rock particles back and forth — pushing them apart and then back together — in line with the direction the wave is traveling. These waves typically arrive at the surface as an abrupt thud. P waves generally travel 1.7 times faster than S waves. Propagation velocity of the various seismic waves ranges from approx. 3 km/s up to 13 km/s, depending on the density and elasticity of the medium. P waves travel at a speed of about 5 to 7 kilometers per second through the lithosphere, about 8 km/s in asthenosphere and the velocity increases within the deep mantle to 13 km/s. The speed of sound is about 0.30 kilometers per second in air. P-waves also have the ability to travel through solid, liquid, and gaseous materials. Many animals can hear and feel P waves but humans can not. This is why it is thought that animals can sense when an earthquake is coming. The animals can feel the beginning of the earthquake that the less sensitive humans do not feel. When some P-waves move from the ground to the lower atmosphere, the sound wave that is produced can sometimes be heard by humans and animals. Human beings can detect sounds in the frequency range 20-10,000 Hertz. If a P wave refracts out of the rock surface into the air, and it has a frequency in the audible range, it will be heard as a rumble. However, most earthquake (seismic) waves have a frequency of less than 20 Hz, so the waves themselves are usually not heard. Most of the rumbling noise heard during an earthquake is shaking of a building and its contents moving.
_
S wave: Secondary waves, also called S waves or shear waves, lag a little behind the P waves. As these waves move, they displace rock particles outward, pushing them perpendicular to the path of the waves. This results in the first period of rolling associated with earthquakes. Unlike P waves, S waves don’t move straight through the earth. They only travel through solid material, and so are stopped at the liquid layer in the earth’s core. S-waves are produced by shear stresses and move the materials they pass through in a perpendicular (up and down or side to side) direction. The velocity of S-waves ranges from 2–3 km/s in light sediments and 4–5 km/s in the Earth’s crust up to 7 km/s in the deep mantle. As a consequence, the first waves of a distant earth quake arrive at an observatory via the Earth’s mantle because both body waves (P & S) travel fast in earth’s mantle.
_
Surface waves: Surface waves are similar to water waves in the sense they move the surface of the earth up and down (vide infra). This generally causes the worst damage because the wave motion rocks the foundations of manmade structures. L waves are the slowest moving of all waves, so the most intense shaking usually comes at the end of an earthquake. Surface waves travel at or near the Earth’s surface. These waves produce a rolling or swaying motion causing the Earth’s surface to behave like waves on the ocean. The velocity of these waves is slower than body waves. Despite their slow speed, these waves are particularly destructive to human construction because they cause considerable ground movement.
_
Both sorts of body waves (P & S) do travel around the earth, however, and can be detected on the opposite side of the planet from the point where the earthquake began. At any given moment, there are a number of very faint seismic waves moving all around the planet. At the instant an earthquake occurs, P, S and L waves immediately begin racing outward in all directions, losing energy as they spread out. If they encounter no interference, P and S waves for a large earthquake should quickly travel all of the way through the middle of the earth and faintly arrive on the opposite side of the globe. An earthquake at the South Pole, for example, would shake the North Pole in less than half an hour (though the vibrations would be very weak). This is what P and S waves usually do. However, the P and S waves do not always make it to the opposite side.
_
Seismograms come in handy for locating earthquakes. You learned how P & S waves each shake the ground in different ways as they travel through it. P waves are also faster than S waves, and this fact is what allows us to tell where an earthquake was. The P waves travel faster and shake the ground where you are first. Then the S waves follow and shake the ground also. If you are close to the earthquake, the P and S wave will come one right after the other, but if you are far away, there will be more time between the two. By looking at the amount of time between the P and S wave on a seismogram recorded on a seismograph, scientists can tell how far away the earthquake was from that location. The differences in travel time from the epicenter to the observatory (seismic station) are a measure of the distance and can be used to image both sources of quakes and structures within the Earth. Rule of thumb: On the average, the kilometer distance to the earthquake is the number of seconds between the P and S wave times 8. Also, the depth of the hypocenter (focus) can be computed roughly. However, they can’t tell in what direction from the seismograph the earthquake was, only how far away it was. If they draw a circle on a map around the station where the radius of the circle is the determined distance to the earthquake, they know the earthquake lies somewhere on the circle. But where?
Scientists then use a method called triangulation to determine exactly where the earthquake was. It is called triangulation because a triangle has three sides, and it takes three seismographs to locate an earthquake. If you draw a circle on a map around three different seismographs where the radius of each is the distance from that station to the earthquake, the intersection of those three circles is the epicenter!
_
In the last twenty years, we have definitely had an increase in the number of earthquakes we have been able to locate each year. This is because of the tremendous increase in the number of seismograph stations in the world and the many improvements in global communications. In 1931, there were about 350 stations operating in the world; today, there are more that 4,000 stations and the data now comes in rapidly from these stations by telex, computer and satellite. This increase in the number of stations and the more timely receipt of data has allowed us and other seismological centers to locate many small earthquakes which were undetected in earlier years, and we are able to locate earthquakes more rapidly. Today, state of the art seismic systems transmit data from the seismograph via telephone line and satellite directly to a central digital computer. A preliminary location, depth-of-focus, and magnitude can now be obtained within minutes of the onset of an earthquake. The only limiting factor is how long the seismic waves take to travel from the epicenter to the stations – usually less than 10 minutes. Accurately determining the depth of an earthquake is typically more challenging than determining its location, unless there happens to be a seismic station close and above the epicenter. So generally, errors on depth determinations are somewhat greater than on location determinations. A useful rule of thumb is that a reliable depth requires that the distance from the epicenter to the nearest station must be less than the depth of the earthquake. Modern computational and theoretical advances can now produce reliable depths at greater distances from the nearest station, so the rule of thumb does not always apply nowadays. However, the rule of thumb does illustrate one conclusion: fixed depths are more common for shallow earthquakes than for deep ones.
_
What is the difference between intensity scales and magnitude scales?
The severity of an earthquake can be expressed in terms of both intensity and magnitude. However, the two terms are quite different, and they are often confused. Intensity is based on the observed effects of ground shaking on people, buildings, and natural features. It varies from place to place within the disturbed region depending on the location of the observer with respect to the earthquake epicenter. Magnitude is related to the amount of seismic energy released at the hypocenter of the earthquake. It is based on the amplitude of the earthquake waves recorded on instruments which have a common calibration. The magnitude of an earthquake is thus represented by a single, instrumentally determined value. Intensity scales, like the Modified Mercalli Scale and the Rossi-Forel scale, measure the amount of shaking at a particular location. So the intensity of an earthquake will vary depending on where you are. Sometimes earthquakes are referred to by the maximum intensity they produce. Magnitude scales, like the Richter magnitude and Moment magnitude, measure the size of the earthquake at its source. So they do not depend on where the measurement is made. Often, several slightly different magnitudes are reported for an earthquake. This happens because the relation between the seismic measurements and the magnitude is complex and different procedures will often give slightly different magnitudes for the same earthquake.
_
Richter magnitude and Moment magnitude scale:
The Richter scale is not a physical device, but a mathematical formula. The magnitude of an earthquake is determined from the logarithm of the amplitude of waves recorded on a seismogram at a certain period. The Richter magnitude scale (local magnitude scale) assigns a single number to quantify the amount of seismic energy released by an earthquake. It is a base-10 logarithmic scale obtained by calculating the logarithm of the combined horizontal amplitude (shaking amplitude) of the largest displacement from zero on a particular type of seismometer. For example, an earthquake that measures 5.0 on the Richter scale has shaking amplitude 10 times larger than one that measures 4.0 The Richter scale has been superseded by the Moment magnitude scale, which is calibrated to give generally similar values for medium-sized earthquakes (magnitudes between 3 and 7). The magnitude scale for measuring the size of an earthquake is based on the amplitude (not intensity) of a seismic wave measured at a certain wave period (in seconds) or frequency (in hertz). The original Richter magnitude (designated the Local Magnitude scale) was designed to work only in California. It is based on measuring the amplitude of the seismic waves near 1 Hz or 1 sec period. Because larger earthquakes release more of their energy at longer periods (lower frequencies) than smaller earthquakes, measuring the amplitude near 1-sec period waves is not always a valid measure of the true “size” of the earthquake. Because of this, the “Richter magnitude” is thus said to saturate at about magnitude 7.0 to 7.5. This means that even though the earthquake is larger, the amplitude near 1-sec period does not significantly change. For larger earthquake (> M7.5), we use Moment magnitude scale which measure the amplitude of seismic waves at longer periods (anywhere from 20 seconds to 100 seconds), or we use a completely different estimate for the size that takes into account the surface area of rupture along the fault and the amount of slip (displacement) on the fault. The latter is called the seismic moment. Since the Moment Magnitude scale generally yields very similar results to the Richter scale, magnitudes of earthquakes reported in the mass media are usually reported without indicating which scale is being used.
_
Both Richter scale and Moment magnitude scale have been applied to various earthquakes in last several decades and the comparison of magnitudes of these earthquakes are depicted in following table.
| Richter scale ML | Moment magnitude Mw |
| 5.9 | 6.0 |
| 6.2 | 6.5 |
| 6.4 | 7.0 |
| 7.2 | 7.5 |
__
According to the United States Geological Survey, more than three million earthquakes occur every year. That’s about 8,000 a day or one every 11 seconds! The vast majority of these 3 million quakes are extremely weak. The law of probability also causes a good number of stronger quakes to happen in uninhabited places where no one feels them. It is the big quakes that occur in highly populated areas that get our attention. Megathrust earthquakes occur at subduction zones at destructive plate boundaries (convergent boundaries), where one tectonic plate is forced under (subducts) another. Due to the shallow dip of the plate boundary, which causes large sections to get stuck, these earthquakes are among the world’s largest, with moment magnitudes (Mw) that can exceed 9.0. Since 1900, all six earthquakes of magnitude 9.0 or greater have been megathrust earthquakes. No other type of known tectonic activity can produce earthquakes of this scale. A submarine or undersea or underwater earthquake is an earthquake that occurs underwater at the bottom of a body of water, especially an ocean. They are the leading cause of tsunamis.
_
Earthquake Magnitude Scale and Frequency:
| Richter magnitudes | Description | Earthquake effects | Frequency of occurrence |
| Less than 2.0 | Micro | Micro earthquakes, not felt. | About 8,000 per day |
| 2.0–2.9 | Minor | Generally not felt, but recorded. | About 1,000 per day |
| 3.0–3.9 | Often felt, but rarely causes damage. | 49,000 per year (est.) | |
| 4.0–4.9 | Light | Noticeable shaking of indoor items, rattling noises. Significant damage unlikely. | 6,200 per year (est.) |
| 5.0–5.9 | Moderate | Can cause major damage to poorly constructed buildings over small regions. At most slight damage to well-designed buildings. | 800 per year |
| 6.0–6.9 | Strong | Can be destructive in areas up to about 160 kilometers (100 mi) across in populated areas. | 120 per year |
| 7.0–7.9 | Major | Can cause serious damage over larger areas. | 18 per year |
| 8.0–8.9 | Great | Can cause serious damage in areas several hundred kilometres across. | 1 per year |
| 9.0–9.9 | Devastating in areas several thousand kilometres across. | 1 per 20 years | |
| 10.0+ | Massive | Never recorded, possibly planetwide devastation; see below for equivalent seismic energy yield. | Extremely rare (Unknown) |
_
The 9.0 magnitude quake (the sixth-largest recorded since 1900) on 11’th march, 2011 was caused when the Pacific tectonic plate dove under the North American plate and it was so powerful that it moved Japan permanently by about 8 ft (2.4 meters) and shifted the country’s coastline by some 13 ft (4 meters) to the east. The quake also shifted the earth’s axis by 6.5 inches, shortened the day by 1.6 microseconds, and sank Japan downward by about two feet. Why did the quake shorten the day? The earth’s mass shifted towards the center, spurring the planet to spin a bit faster. Last year’s massive 8.8 magnitude earthquake in Chile also shortened the day, but by an even smaller fraction of a second. The 2004 Sumatra quake knocked a whopping 6.8 micro-seconds off the day.
_
Energy released by earthquake:
The energy source for an earthquake is tectonic strain accumulated by the relative motion of Earth’s tectonic plates which is driven by mantle heat flow in the presence of the earth’s gravitational field. During earthquake, stored potential energy is converted into kinetic energy (rock movements and cracks), heat and radiated seismic energy. In other words, the total energy released from an earthquake includes energy required to create new cracks in rocks along with rock movements, energy dissipated as heat through friction, and energy elastically radiated through the earth as seismic waves. Of these, the only quantity that can be measured is that which is radiated through the earth. It is the radiated energy that shakes buildings and is recorded by seismographs. The energy released by nuclear weapons is traditionally expressed in terms of the energy stored in a kiloton or megaton of the conventional explosive trinitrotoluene (TNT). Rule of thumb equivalence from seismology used in the study of nuclear proliferation asserts that a one kiloton nuclear explosion creates a seismic signal with a magnitude of approximately 4.0. However, such comparison figures are not very meaningful. As with earthquakes, during an underground explosion of a nuclear weapon, only a small fraction of the total amount of energy released ends up being radiated as seismic waves (seismic energy). The ratio of the seismic energy to the total energy released is known as seismic efficiency. Therefore, a seismic efficiency has to be chosen for a bomb that is quoted as a comparison. Generally about 0.5 % of the bomb’s energy is converted into radiated seismic energy while less than 10 % of earthquake’s energy is radiated as seismic energy. For real underground nuclear tests, the actual seismic efficiency achieved varies significantly and depends on the site and design parameters of the test.
_
The following equation can be used to approximate the amount of energy released from an earthquake in joules when Richter magnitude (M) is known:
Energy in joules = 1.74 x 10(5 + 1.44*M)
_
The energy release of an earthquake, which closely correlates to its destructive power, scales with the 3?2 power of the shaking amplitude. Thus, a difference in magnitude of 1.0 is equivalent to a factor of 31.6 (= (101.0) (3 / 2)) in the energy released; a difference in magnitude of 2.0 is equivalent to a factor of 1000 (= (102.0) (3 / 2)) in the energy released. For example, a magnitude 7.2 earthquake produces 10 times more ground motion than a magnitude 6.2 earthquake, but it releases about 32 times more energy. The energy release best indicates the destructive power of an earthquake. Let me put it differently. It would take 32 magnitude 5’s, 1000 magnitude 4’s, 32,000 magnitude 3’s to equal the energy of one magnitude 6 event.
_
Magnitudes and corresponding energy in tons of TNT and nuclear bomb equivalence
| EarthquakeMagnitude | Tons of TNT | Nuclear Bomb Equivalence (# of bombs) |
| 4 | 15. | 0.00 |
| 5 | 475. | 0.02 |
| 6 | 15023. | 0.79 |
| 7 | 475063. | 25.0 |
| 8 | 15022833. | 790.6 |
| 9 | 475063712. | 25,003.3 |
_
Earthquake Magnitude and Energy
| Relationship between Richter Scale magnitude and energy released. | ||
| Magnitude in Richter Scale |
Energy Released in Joules |
Comment |
| 2.0 | 1.3 x 10⁸ | Smallest earthquake detectable by people. |
| 5.0 | 2.8 x 10¹² | Energy released by the Hiroshima atomic bomb. |
| 6.0 – 6.9 | 7.6 x 10¹³ to 1.5 x 10¹⁵ | About 120 shallow earthquakes of this magnitude occur each year on the Earth. |
| 6.7 | 7.7 x 10¹⁴ | Northridge, California earthquake January 17, 1994. |
| 7.0 | 2.1 x 10¹⁵ | Major earthquake threshold. Haiti earthquake of January 12, 2010 resulted in an estmated 222,570 deaths |
| 7.4 | 7.9 x 10¹⁵ | Turkey earthquake August 17, 1999. More than 12,000 people killed. |
| 7.6 | 1.5 x 10¹⁶ | Deadliest earthquake in the last 100 years. Tangshan, China, July 28, 1976. Approximately 255,000 people perished. |
| 8.3 | 1.6 x 10¹⁷ | San Francisco earthquake of April 18, 1906. |
| 9.0 | Japan Earthquake March 11, 2011 | |
| 9.1 | 4.3 x 10¹⁸ | December 26, 2004 Sumatra earthquake which triggered a tsunami and resulted in 227,898 deaths spread across fourteen countries |
| 9.5 | 8.3 x 10¹⁸ | Most powerful earthquake recorded in the last 100 years. Southern Chile on May 22, 1960. Claimed 3,000 lives. |
__
Duration of earthquake:
The duration of an earthquake is related to its magnitude but not in a perfectly strict sense. There are two ways to think about the duration of an earthquake. The first is the length of time it takes for the fault to rupture and the second is the length of time shaking is felt at any given point (e.g. when someone says “I felt it shake for 10 seconds” they are making a statement about the duration of shaking). We actually do use the duration of shaking to estimate the magnitude for some small earthquakes. The damage to a given structure will depend both on the amplitude of the shaking and its duration. How to best combine these quantities into an estimate of the amount of damage is ongoing research.
_
Why magnitude of an earthquake is updated?
For large earthquakes, the USGS (United States geological survey) releases an initial estimate of the earthquake magnitude and location within about 20 minutes for earthquakes outside the United States. Those estimates are done using data transmitted in real time from the closest seismic stations. Some of the seismic waves used in magnitude analysis can take more than an hour to propagate around the earth and reach stations farther from the epicenter. There is no physical way to include these measurements in the initial magnitude release because the energy used in the analysis has not yet arrived at all seismic stations. Additionally, not all seismic data are delivered to the USGS in real time. Some data from contributing networks are delayed by several minutes or more, while some may arrive days after the event. As additional data become available and are processed, the earthquake magnitude and location are refined and updated. After the initial magnitude is released, there are generally two processing points at which the magnitude of a significant earthquake may be updated. The first generally comes within a few hours of the earthquake, when the majority of the real-time data has arrived at seismic stations around the earth and more sophisticated, time- intensive, processing has been completed. The second comes within days to weeks after the event when the event is reanalyzed for inclusion in an archival earthquake catalog. At this point the USGS has received most available seismograms as well as magnitude estimates from other contributing national and international agencies.
_
False alarm:
There are multiple causes of false alarms. Automatic systems are particularly prone to errors following large earthquake when earthquake location algorithms misidentify reflected and refracted seismic waves created by a single earthquake. In this case, one earthquake can turn into “events” located in areas far from the earthquake. In other cases, noise in legacy analog telephone circuits that bring the data from seismometers to computers can be misidentified as earthquakes. Software optimized to locate local earthquakes by ANSS (advanced national seismic system) “regional” seismic networks in the USA occasionally may mislocate a large earthquake occurring on the other side of the Earth (e.g., China) deeply beneath the seismic network. Adding to this complexity, there are multiple seismic monitoring networks that contribute their earthquake locations and magnitudes to the ANSS system. These networks use different data and algorithms to locate the earthquakes, and sometimes the spatial separation of the contributed locations is so large that our systems interpret the independent solutions as distinct earthquakes of similar magnitude and location. In this situation, a delete message will be sent for one of the earthquake solutions but an earthquake did occur. We are continuously improving our automatic systems and manual procedures to reduce the number of false alarms. However, with the advent of rapid distribution methods like RSS feeds and the re-distribution of our alerts through social media sites, our errors are more widely seen and more difficult to retract completely.
_
Induced seismicity:
While most earthquakes are caused by movement of the Earth’s tectonic plates, human activity can also produce earthquakes. Some human actions can trigger much larger quakes along natural fault lines. That’s because humans, with the aid of our massive machines, can sling enough mass around to shift the pattern of stresses in the Earth’s crust. Faults that might not have caused an earthquake for a million years can suddenly be pushed to failure. Four main activities contribute to this phenomenon:
1) Build a Dam: Water is heavier than air, so when the valley behind a dam is filled, the crust underneath the water experiences a massive change in stress load. Research indicates that about one-third of human-caused earthquakes came from reservoir construction. This science has raised fears that the recent earthquake in China was caused by the filling of the Three Gorges Dam reservoir, although no conclusive evidence has been presented.
_
2) Inject liquid into the Ground: In 1961, the US Army decided that the best way to dispose of toxic waste from napalm production (among other things) was to drill a 12,000-foot-deep well in the Rocky Mountains and inject the bad stuff down it into the crust of the Earth. From 1962 to 1966, the Army deposited 165 million gallons of toxic waste into this hole in the Earth. Unfortunately, the injections probably triggered earthquakes in the region, and the Army shut the operation down. If you are doing deep well injection, you are altering the stress on the underlying rocks and at some point; the stress will be relieved by generating an earthquake.
_
3) Mine a lot of Coal: Coal provides more than half the electricity in the United States and an even greater percentage in China. That means there are a lot of coal mines working overtime to pull the fossilized fuel out of the Earth. In total, miners pulled 6,195 million metric tons of coal out of the Earth in 2006 alone. And coal mines often have to pump water out along with the coal, sometimes extracting dozens of times as much water as coal. Add it up and you have a huge change in the mass of a region, and huge mass changes refigure the earthquake stresses of an area, sometimes increasing the chance of an earthquake and other times lowering it. A study suggested that more than 50 percent of the human-triggered earthquakes recorded came from mining operations.
_
4) Create the World’s Biggest Building: Back in 2005, a geologist claimed that the world’s then-tallest building, the Taipei 101, which weighs in at more than 700,000 metric tons, was triggering earthquakes in a long-dormant fault in Taiwan. There are serious doubts that the building actually did so, but still it wasn’t outside the realm of possibility for a building to create an earthquake.
_
Can nuclear tests cause earthquake and/or tsunami?
The Indian and Pakistani test sites are approximately 1000 km from the Afghanistan earthquake epicenter. The question that has been asked is whether or not the occurrence of these nuclear tests influenced the occurrence of the large earthquake in Afghanistan. The most direct cause-effect relationship is that the passage of the seismic waves, generated by the thermonuclear explosion, through the epicentral region in Afghanistan somehow triggered the earthquake. The elastic strains induced in the epicentral region by the passage of the seismic wave-field generated by the largest of the Indian nuclear tests on May 11, 1998 with an estimated yield of 40 kilotons, is about 100 times smaller than the strains induced by the Earth’s semi-diurnal (12 hour) tides that are produced by the gravitational fields of the Moon and the Sun. If small nuclear tests could trigger an earthquake at a distance of 1000 km, equivalent-sized earthquakes, which occur globally at a rate of several per day, would also be expected to trigger earthquakes. No such triggering has been observed. Thus there is no evidence of a causal connection between the nuclear testing and the large earthquake in Afghanistan and it is pure coincidence that they occurred near in time and location. The largest underground thermonuclear tests conducted by the US were detonated in Amchitka at the western end of the Aleutian Islands and the largest of these was the 5 megaton codename Cannikin test which occurred on November 6, 1971. Cannikin had a body wave magnitude of 6.9 and it did not trigger any earthquakes in the seismically active Aleutian Islands. Underwater landslide can cause tsunami. Even though nuclear test itself may not cause earthquake, it can cause landslide resulting in tsunami. Nuclear test indeed caused a major underwater landslide at Mururoa in 1979, when a nuclear device was exploded after jamming half-way down its shaft. It shifted at least one million cubic meters of coral and rock and created a cavity, probably 140 meters in diameter and produced a major tidal wave comparable to a tsunami, which spread through the Tuamotu Archipelago and injured people on the southern part of Moruroa Atoll. French authorities denied that any mishap had occurred and declared that the tidal wave was of natural origin but it was probably a tsunami. So it is possible to execute a Nuclear Explosion under sea-floor to produce a tsunami to destroy enemy seashore town during war.
_
Two earthquakes occurred on the same day. Are they related? Often, people wonder if an earthquake in Alaska may have triggered an earthquake in California; or if an earthquake in Chile is related to an earthquake that occurred a week later in Mexico. Over these distances, the answer is no. Even the Earth’s rocky crust is not rigid enough to transfer stress fields efficiently over thousands of miles.
_
The effects from earthquakes are caused by ground shaking, surface rupture, ground failure, and less commonly, tsunamis.
1) Ground shaking:
Ground shaking is a term used to describe the vibration of the ground during an earthquake. Ground shaking is caused by body waves and surface waves. As a generalization, the severity of ground shaking increases as magnitude increases and decreases as distance from the causative fault increases. Although the physics of seismic waves is complex, ground shaking can be explained in terms of body waves, compressional or P, and shear or S, and surface waves, Rayleigh and Love. P waves propagate through the Earth with a speed of about 15,000 miles per hour and are the first waves to cause vibration of a building. S waves arrive next and cause a structure to vibrate from side to side. They are the most damaging waves, because buildings are more easily damaged from horizontal motion than from vertical motion. The P and S waves mainly cause high-frequency vibrations; whereas, Rayleigh waves and Love waves, which arrive last, mainly cause low-frequency vibrations. Body and surface waves cause the ground, and consequently a building, to vibrate in a complex manner. The objective of earthquake-resistant design is to construct a building so that it can withstand the ground shaking caused by body and surface waves. When a fault ruptures, seismic waves are propagated in all directions, causing the ground to vibrate at frequencies ranging from about 0.1 to 30 Hertz. Buildings vibrate as a consequence of the ground shaking; damage takes place if the building cannot withstand these vibrations. P and S waves mainly cause high-frequency (greater than 1 Hertz) vibrations which are more efficient than low-frequency waves in causing low buildings to vibrate. Rayleigh and Love waves mainly cause low-frequency vibrations which are more efficient than high-frequency waves in causing tall buildings to vibrate. Because amplitudes of low-frequency vibrations decay less rapidly than high-frequency vibrations as distance from the fault increases, tall buildings located at relatively great distances (60 miles) from a fault are sometimes damaged.
2) Surface rupture:
_
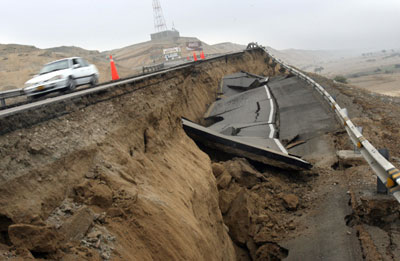
Surface rupture occurs when movement on a fault deep within the earth breaks through to the surface. Not all earthquakes result in surface rupture. Death and injuries from surface faulting are very unlikely, but casualties can occur indirectly through fault damage to structures. The displacements, lengths, and widths of surface ruptures show a wide range. Shallow crevasses can also form during earthquake-induced landslides, lateral spreads, or other types of ground failures. Please do not confuse surface rupture with tectonic plate boundary faults. Tectonic plate boundary faults do not open up during an earthquake because if faults do open up, no earthquake would occur as there would be no friction to lock them together. It is only the sudden slip of rocks at faults which cause earthquake that may result in surface rupture overlying the deep fault within the earth.
3) Liquefaction and Ground Failure:
Liquefaction is a physical process that takes place during some earthquakes that may lead to ground failure. As a consequence of liquefaction, clay-free soil deposits, primarily sands and silts, temporarily lose strength and behave as viscous fluids rather than as solids. Liquefaction takes place when seismic shear waves pass through a saturated granular soil layer, distort its granular structure, and cause some of the void spaces to collapse. Disruptions to the soil generated by these collapses cause transfer of the ground-shaking load from grain-to-grain contacts in the soil layer to the pore water. This transfer of load increases pressure in the pore water, either causing drainage to occur or, if drainage is restricted, a sudden buildup of pore-water pressure. When the pore-water pressure rises to about the pressure caused by the weight of the column of soil, the granular soil layer behaves like a fluid rather than like a solid for a short period. In this condition, deformations can occur easily. Liquefaction is restricted to certain geologic and hydrologic environments, mainly areas where sands and silts were deposited in the last 10,000 years and where ground water is within 30 feet of the surface. Generally, the younger and looser the sediment and the higher the water table, the more susceptible a soil is to liquefaction.
4) Landslides:
Past experience has shown that several types of landslides take place in conjunction with earthquakes. The most abundant type of earthquake induced landslides are rock falls and slides of rock fragments that form on steep slopes. Large earthquake-induced rock avalanches, soil avalanches, and underwater landslides can be very destructive. The size of the area affected by earthquake-induced landslides depends on the magnitude of the earthquake, its focal depth, the topography and geologic conditions near the causative fault; and the amplitude, frequency, and duration of ground shaking.
5) Tsunami:
Tsunamis are water waves that are caused by sudden vertical movement of a large area of the sea floor during an undersea earthquake (vide infra).
6) Fire:
Earthquakes can cause fires by damaging electrical power or gas lines. In the event of water mains rupturing and a loss of pressure, it may also become difficult to stop the spread of a fire once it has started.
7) Floods:
Earthquakes may cause landslips to dams on rivers, which collapse and cause floods.
8) Groundwater and Well water changes:
Seismic waves have two main types of effects on groundwater levels: oscillations, and “permanent” offsets. Muddy or turbid water at long distances from the epicenter are most likely an aftereffect of oscillations.
_
The amount of damage and loss of life due to earthquake depends on a number of factors. Some of the more important factors are:
1) Time of day: Higher losses of life tend to occur on weekdays between the hours of 9:00 AM to 4:00 PM. During this time interval many people are in large buildings because of work or school. Large structures are often less safe than smaller homes in an earthquake.
2) Magnitude of the earthquake: Damage does not usually occur until the earthquake magnitude reaches somewhere above 4 or 5.
3) Distance form the earthquake’s focus: The strength of the shock waves diminishes with distance from the focus. The depth of the earthquake has a very strong effect on the amount of damage, greater the depth, lesser the damage.
4) Geology of the area affected and soil type: Some rock types transmit seismic wave energy more readily. Buildings on solid bedrock tend to receive less damage. Unconsolidated rock and sediments have a tendency to increase the amplitude and duration of the seismic waves increasing the potential for damage. Some soil types when saturated become liquefied.
5) Type of building construction: Some building materials and designs are more susceptible to earthquake damage. There is more damage and more deaths from earthquakes in developing nations as compared to the U.S. primarily because of buildings which are poorly designed & constructed for earthquake regions, and also population density.
6) Population density. More people often mean greater chance of injury and death.
_
Earthquake prediction:
_
Forecasting a probable timing, location, magnitude and other important features of a forthcoming seismic event is called earthquake prediction. Most seismologists do not believe that a system to provide timely warnings for individual earthquakes has yet been developed, and many believe that such a system would be unlikely to give significant warning of impending seismic events. More general forecasts, however, are routinely used to establish seismic hazard. Such forecasts estimate the probability of an earthquake of a particular size affecting a particular location within a particular time-span, and they are routinely used in earthquake engineering. In spite of extensive research and sophisticated equipments, it is impossible to predict an earthquake today, although experts can estimate the likelihood of an earthquake occurring in a particular region. Predicting earthquakes had been one of the most interesting and difficult challenges a scientist can attempt. Most geologists do believe that we will someday be able to predict many quakes. Some also believe that we will be able to prevent some quakes from occurring. Many pseudoscientific theories and predictions are made, which scientific practitioners find problematic. The natural randomness of earthquakes and frequent activity in certain areas can be used to make “predictions” which may generate unwarranted credibility. These generally leave certain details unspecified, increasing the probability that the vague prediction criteria will be met, and ignore quakes that were not predicted. In the effort to predict earthquakes, people have tried to associate an impending earthquake with such varied phenomena as ground movements, water levels in wells and weather.
1) Seismicity patterns:
Scientists study the past frequency of large earthquakes in order to determine the future likelihood of similar large shocks. However, in many places, the assumption of random occurrence with time may not be true, because when strain is released along one part of the fault system, it may actually increase on another part. Another way to estimate the likelihood of future earthquakes is to study how fast strain accumulates. When plate movements build the strain in rocks to a critical level, like pulling a rubber band too tight, the rocks will suddenly break and slip to a new position. Scientists measure how much strain accumulates along a fault segment each year, how much time has passed since the last earthquake along the segment, and how much strain was released in the last earthquake. This information is then used to calculate the time required for the accumulating strain to build to the level that result in an earthquake. This simple model is complicated by the fact that such detailed information about faults is rare. In the United States, only the San Andreas Fault system has adequate records for using this prediction method. A NASA funded earthquake prediction program has an amazing track record and accurately predicted the locations of 15 of California’s 16 largest earthquakes this decade. Essentially, they look at past data and perform math operations on it. Computer modeling technique has revealed a relationship between past and future earthquake locations. So far, the technique has only missed one earthquake.
_
2) Electromagnetic phenomena (seismo-electromagnetics):
Seismo-electromagnetics is the study of electromagnetic phenomena associated with seismic activity such as earthquakes and volcanoes, and also the use of electromagnetic methods in seismology. It has been reported that electromagnetic phenomena take place in a wide frequency range prior to an earthquake. It has been observed that electromagnetic disturbances happen during the days that precede an earthquake. These disturbances happen when crystalline rocks are deformed by the slow grinding of the earth that occurs just before an earthquake. The cracking creates tremendous electric currents in the ground, which travel to the surface and into the air. These currents alter the magnetic field surrounding the earthquake zone and these electromagnetic effects can easily be detected. Just before a large earthquake strikes, electrical disturbances can be detected at the edge of space in the ionosphere of the Earth’s atmosphere. The scientific explanation is that rocks in the Earth’s crust begin to compress in the run up to an earthquake. When rocks compress they generate an electrical current between the ground and the atmosphere. The signals are so distinct for certain earthquakes that the team at NASA has teamed up with a satellite technology company to determine if it is possible in practice to set-up a satellite-based early warning system. On a significant number of occasions, satellites have picked up disturbances in this part of the atmosphere 100-600km above areas that have later been hit by earthquakes. One of the most important of these is a fluctuation in the density of electrons and other electrically-charged particles in the ionosphere. It is hoped that the system could provide up to at least a few hours warning before a major tremor occurs. The other electromagnetic earthquake precursors include enhanced emission of infrared (IR) radiation from the earthquake epicenter, as well as anomalies in low-frequency electric and magnetic field data. The idea proposed is that when rocks are compressed – as when tectonic plates shift – they act like batteries, producing electric currents. The researchers’ hypothesis held that rapid changes in stress and strain in the crust began a few days before earthquakes. According to their theory, the charge carrier is a “positive hole”, known as a Phole, which can travel large distances in laboratory experiments. When Pholes travel to the surface of the Earth, the surface becomes positively charged. And this charge can be strong enough to affect the ionosphere, causing the disturbances documented by satellites. When these Pholes “recombine” at the surface of the Earth, they enter an excited state. They subsequently “de-excite” and emit mid-infrared light particles, or photons. This may explain the IR observations. Accurate earthquake warnings are, at last, within reach. Instead of coming from the mechanical phenomena that have been the focus of decades of study, however, they will come from electromagnetic phenomena. And, remarkably, these predictions will come from signals gathered not only at the earth’s surface but also in the ionosphere.
_
The above figure shows satellite DEMETER picking up ultra-low-frequency (ULF) electromagnetic signals over Haiti in the month before 7 M earthquake in 2010. The “Detection of Electro-Magnetic Emissions Transmitted from Earthquake Regions” satellite (DEMETER), constructed by CNES (French space agency), has made observations which show strong correlations between certain types of low frequency electromagnetic activity and the most seismically active zones on the Earth, and have shown a sharp signal in the ionospheric electron density and temperature near southern Japan seven days before a 7.1 magnitude occurred there (on August 29 and September 5, 2004, respectively).
_
Besides satellites, ground technical stations can be established to detect variation in electromagnetic signals before, during and after an earthquake.
The above figure shows Temporal Evolution of geomagnetic variation for the Loma Prieta earthquake (frequency = 0.01 Hz). Basically there are two principal methods of observation of earthquake signatures. The first is the direct observation of electromagnetic emissions (natural emissions) from the lithosphere and the second is to detect indirectly the seismic effects that have taken place in a form of propagation anomaly of the pre-existing transmitter signals. The first method is based on the idea that natural emissions are radiated from the hypocenter of earthquake due to some tectonic effect during their preparation phase. The problem with this ‘local’ measurement is that our observing station should be located very close to the earthquake epicenter in order for us to detect seismogenic emissions. The second method is based on the idea that there are anomalies in the atmosphere and ionosphere due to seismicity, leading to the generation of a propagation anomaly on the pre-existing transmitter signal characteristics. We call this type of observation ‘integrated’ measurement, because we can detect any earthquakes that are located very close to the propagation path from the transmitter to the receiver, so that it is much easier for us to accumulate the number of events for this integrated measurement. While such an earthquake warning system would be useful, there are a number of technical and financial problems that need first to be addressed before they can be installed worldwide.
_
3) GPS sensors:
More promising perhaps, is the work being done particularly in Japan with GPS sensors that can detect minute movements in the Earth’s crust and therefore offer “pre-signals” of the occurrence and location of the epicenter of an earthquake. There is some evidence to suggest this is possible, however predicting the timing of an earthquake is far more difficult rendering the exercise fruitless so far when it comes to trying to prevent loss of life. It would appear that the GPS sensors detecting the slip deficit and slip-excess rates have accurately identified where the earthquake and aftershocks were to later strike. The problem of course is that the data didn’t indicate when the fault would slip triggering the earthquake and the resulting tsunami. No warning can be given. There’s something powerful in the GPS data for science then, but sadly, still nothing that can give any accurate indication of when a major seismic event will occur, the crucial component to avoiding the devastating impact of a high magnitude earthquake.
_
4) InSAR:
The application of an emerging satellite technology “could advance earthquake science towards a better predictive capability.” The system, known as the Global Earthquake Satellite System, or GESS, employs a technology called interferometric synthetic aperture radar (InSAR). Put simply, the high-tech mouthful allows scientists to detect minute deformations in the Earth’s crust. In theory, knowing how and where the Earth’s crust is deforming over time, combined with knowledge of how earthquakes work, could give scientists a clue that an earthquake is imminent.
_
5) Earthquake prediction using accelerometers in laptops.
A scientist in California is trying to recruit thousands of people to build a volunteer early warning system by harnessing technology in laptops. Motion sensors already fitted in computers are being used as seismographs. The hope is a large network of quake sensors could one day help give warning of impending tremors. Small devices in ordinary laptops called accelerometers could be used to provide advance warning of an impending tremor. Accelerometers detect motion and form part of the shock resistant capabilities of laptops in the event that they are accidentally dropped by the user. If the output from hundreds of these small motion sensors could be fed into a single networked system, the timing and location of an earthquake could be forecast by up to 20 seconds in advance. This may seem short notice but it is long enough to automatically shut down gas and oil pipelines which pose a major safety risk following an earthquake.
_
6) Gravity maps:
The Gravity Field and Steady-State Ocean Circulation Explorer (GOCE) is an ESA satellite that was launched on March 17, 2009. It is a satellite carrying a highly sensitive gravity gradiometer which detects fine density differences in the crust and oceans of the Earth. The final gravity map will lead to a better understanding of the physics of the Earth’s interior to gain new insights into the geodynamics associated with the lithosphere, mantle composition and rheology, uplift and subduction processes. Information from GOCE is already being analyzed to get a deeper understanding of the geological processes that cause earthquakes. The recent quake that brought devastation to Japan was triggered by the sudden movement of tectonic plates beneath the ocean. Since this earthquake was caused by tectonic plate movement under the ocean, the motion cannot be observed directly from space. However, these dramatic movements in rock leave signatures in gravity data that could be used to understand the processes leading to these natural disasters and ultimately help to predict them. Also, GOCE will give us dynamic topography and circulation patterns of the oceans with unprecedented quality and resolution. Scientists from the GOCE satellite team have documented new data showing Earth’s gravity field or geoid that makes our planet look like a rotating potato. The geoid is nothing more than how the oceans would vary if there were no other forces besides gravity acting on our planet.
The above map shows how the pull of gravity varies minutely over the surface of the Earth, from deep ocean trenches to majestic mountain ranges. The measurements have allowed scientists to create a computer model called a geoid that reveals what Earth would look like if its shape were altered to make gravity equal at every point on the surface. The map shows areas of strongest gravity in yellow, weakest in blue and moderate in red.
_
7) Radon gas content of soil:
Radon is a chemical element with symbol Rn and atomic number 86. It is a radioactive, colorless, odorless, tasteless noble gas, occurring naturally as the decay product of uranium. There is a suggestion that radon gas is released from fault zones prior to earth slipping. In the last decade, several studies have concluded that elevated concentrations of radon gas in soil or groundwater could be the sign of an imminent earthquake. It is believed that the radon is released from cavities and cracks as the Earth’s crust is strained prior to the sudden slip of an earthquake. The conventional explanation is that, due to mechanical stresses radiating outward from the future hypocenter of an earthquake, rocks below the soil will undergo microfracturing and thereby release radon. An alternate view is that radon, constantly released from crystalline rocks below, becomes bound (or chemisorbed) in the soil. The radon atoms then become liberated when waves of phole charge carriers arrive at the surface of the Earth, e.g. in the soil layer, and interact with the chemisorption sites, allowing the radon to escape.
_
8) Quartz deposits:
Quartz (silicon dioxide) is the most common mineral on the face of the Earth. It is found in nearly every geological environment and is at least a component of almost every rock type. Quartz is the second most abundant mineral in the Earth’s continental crust, after feldspar. It is made up of a continuous framework of SiO4 silicon–oxygen tetrahedra, with each oxygen being shared between two tetrahedra, giving an overall formula SiO2. Underground quartz deposits worldwide may be behind earthquakes, mountain building and other continental tectonics, a discovery that may aid in predicting tremblers, according to a study. Scientists discovered that quartz crystal deposits are found wherever mountains or fault lines occur. Quartz indicates a weakness in the earth’s crust likely to spawn a geologic event such as an earthquake or a volcano. Quartz also may account for the movements of continents known as continental drift or plate tectonics. Researchers linked rock properties to movements of the earth, explaining how quartz contains trapped water that is released when heated under stress, allowing rocks to slide and flow in a viscous cycle.
_
9) Animal behavior (animal early warning):
Rats, weasels, snake, and centipedes reportedly left their homes and headed for safety several days before a destructive earthquake. A published an article in the Journal of Zoology explaining that the number of male toads in a breeding colony reduced by 96% in the five days before the quake. Furthermore, breeding activity was observed within days of the last aftershock. How toads can sense seismic activity remains unclear but certainly further research is required. Animal behavior reports are often ambiguous and not consistently observed. In folklore, some animals have been identified as being more able to predict earthquakes than others, especially dogs, cats, chickens, horses, toads and other smaller animals. It has been postulated that the reported animal behavior before an earthquake is simply their response to an increase in low-frequency electromagnetic signals. The University of Colorado has demonstrated that electromagnetic activity can be generated by the fracturing of crystalline rock. Such activity occurs in fault lines before earthquakes. According to one study, electromagnetic sensors yield statistically valid results in predicting earthquakes. So basically, animals are merely experiencing earthquake sooner than humans and not predicting quakes. Also, animals which are more sensitive to small ground motions, are feeling either small foreshocks, or the first-arriving P-waves. Many animals can hear and feel P waves which are low frequency sound waves which humans can not hear or feel. The larger main shock or the later-arriving S-waves then occur, and the humans notice that the animals were agitated before they were able to feel the earthquake themselves. The animals are just experiencing the earthquakes sooner than humans, as they are more sensitive to electromagnetic waves & seismic waves that the earthquake can generate.
_
10) The phases of the lunar-solar tidal forces:
The moon, sun, and other planets have an influence on the earth in the form of perturbations (small changes) to the gravitational field. The relative amount of influence is proportional to the objects mass, and inversely proportional to square of its distance from the earth. Several recent studies, however, have found a correlation between earth tides (caused by the position of the moon relative to the earth) and some types of earthquakes. There are two flavors of tidal stressing that have been claimed to generate enhanced rates of earthquakes—diurnal and biweekly tides. The diurnal correlations would arise from more earthquakes only during the hours when the tidal stress is pushing in an encouraging direction; in contrast, biweekly effects would be based on earthquakes occurring during the days when the sinusoidal stressing oscillations are largest. The former, as most easily observed in the twice-daily rise and fall of the ocean tides (due to effects of moon’s gravity), have occasionally been shown to influence earthquakes. The latter, which arises from the periodic alignment of the Sun and Moon, has often been claimed in the popular press to incubate earthquakes. A study done in Taiwan found that lunar-solar tidal force possibly plays an important role in triggering earthquakes.
_
Moonquakes (“earthquakes” on the moon) do occur, but they happen less frequently and have smaller magnitudes than earthquakes on the Earth. It appears they are related to the tidal stresses associated with the varying distance between the Earth and Moon. They also occur at great depth, about halfway between the surface and the center of the moon.
_
11) VAN method:
VAN is a method of earthquake prediction proposed by Professors Varotsos, Alexopoulos and Nomicos in the 1980s; it was named after the researchers’ initials. The method is based on the detection of “seismic electric signals” (SES) via a telemetric network of conductive metal rods inserted in the ground. Researchers have claimed to be able to predict earthquakes of magnitude larger than 5, within 100 km of epicentral location, within 0.7 units of magnitude and in a 2-hour to 11-day time window.
_
12) Foreshock prediction:
Foreshocks are medium-sized earthquakes that precede major quakes. An increase in foreshock activity (combined with purported indications like ground water levels and strange animal behavior) enabled the successful evacuation of a million people one day before the February 4, 1975, M 7.3 Haicheng earthquake by the China State Seismological Bureau. While 50% of major earthquakes are preceded by foreshocks, only about 5-10% of small earthquakes turn out to be foreshocks, leading to false warnings.
_
13) Pattern theory:
Japanese seismologist Kiyoo Mogi proposed what has become known as the ‘Mogi doughnut hypothesis’, which suggests that major earthquakes tend to occur in an unusually seismically calm area surrounded by a ring of unusually high seismic activity.
_
14) Fractoluminescence:
One possible method for predicting earthquakes, although it has not yet been applied, is fractoluminescence. Studies at the Chugoku National Industrial Research Institute by Yoshizo Kawaguchi have shown that upon fracturing, silica releases red and blue light for a period of about 100 milliseconds. Kawaguchi attributed this to the relaxation of the free bonds and unstable oxygen atoms that are left when the silicon oxygen bonds have broken due to the stresses within the rock.
_
15) Weather conditions and unusual clouds:
Geologists maintain that there is no connection between weather and earthquakes. Earthquakes are the result of geologic processes within the earth and can happen in any weather and at any time during the year. Earthquakes originate miles underground. Wind, precipitation, temperature, and barometric pressure changes affect only the surface and shallow subsurface of the Earth. Earthquakes are focused at depths well out of the reach of weather, and the forces that cause earthquakes are much larger than the weather forces. Earthquakes occur in all types of weather, in all climate zones, in all seasons of the year, and at any time of day.
_
Earthquake warning system:
Earthquake warning system is distinct from earthquake prediction. An earthquake early-warning system is a system of seismometers, accelerometers, communication, computers, and alarms that is devised for regional notification of a substantial earthquake while it is in progress. Japan, Taiwan and Mexico all have earthquake early-warning systems. Earthquake early warning provides an alarm that strong shaking is due soon to arrive, and the more quickly that the magnitude of an earthquake can be estimated, the more useful is the early warning. However, earthquake early warning can still be effective without the ability to infer the magnitude of an earthquake in its initial second or two. Earthquake early-warning means earthquake is already erupted but people are warned before maximum damage occurs while earthquake prediction is predicting earthquake before it is erupted. Hence use of laptop accelerometers and animal behavior discussed earlier are actually earthquake early-warning and not genuine prediction.
Below pictures show how earthquake warning system work in Japan.
Seismometers detects P-wave and transmitted to Japan Meteorological Agency (JMA) (upper picture), JMA immediately analyze and distributes the warning information to advanced users, such as broadcasting stations (TV & Radio), internet and mobile phone companies before S-wave arrive (lower picture).
_
What you should do at the time of earthquake?
During an Earthquake:
1) Remember to stay calm and take quick action.
2) If you are INDOORS–STAY THERE! Stay where you are located. Do not run outside while quake is in progress due to danger from falling debris.
3) Take cover under a desk or table away from windows. Place your head between your knees to protect your head and neck. Stay in the most innermost corner of the room away from windows.
4) DO NOT use elevators during a quake! DO NOT use matches, lighters, camp stoves or barbecues, electrical equipment, appliances until you are sure there are no gas leaks. They may create a spark that could ignite leaking gas and cause an explosion and fire. DO NOT use your telephone, EXCEPT for a medical or fire emergency. You could tie up the lines needed for emergency response. DO NOT expect firefighters, police or paramedics to help you. They may not be available.
_
If you are outside:
1) Move as far as possible from buildings to avoid broken glass and falling objects.
2) Move away from utility poles, power lines, and trees.
3) If you are DRIVING–stop, but carefully. Move your car as far out of traffic as possible. DO NOT stop on or under a bridge or overpass or under trees, light posts, power lines, or signs. STAY INSIDE your car until the shaking stops.
_
After an Earthquake:
1) Be aware of the possibilities of aftershocks. Do not return to your work area unless directed.
2) Check for fires and fire hazards. Do not use elevators unless they have been checked for safety.
3) Give first-aid to the injured. Take work area first aid kits with you when evacuation is necessary.
4) Remember to never move a seriously injured person unless he or she is in danger of further injury.
5) Notify management and emergency personnel of anything which you believe might be brought to their immediate attention.
6) Be prepared to evacuate and follow management and emergency personnel direction.
_______________________________________________________________________________________________
Tsunami:
This is how shallow water waves looks like.
_
This is how earthquake on the floor of ocean causes tsunami
_
Tsunami generation in real time
_
Tsunami rushing to engulf coastal town
_
_
_
The speed at which both tsunamis travel varies as the square root of the water depth. Therefore, the deep-ocean tsunami travels faster than the local tsunami near shore.
The above picture shows that as a tsunami approaches land, the wavelength and period begins to shorten. The tsunami also experiences a decrease in velocity, as the velocity of a tsunami (v) is equal to the square root of the acceleration of gravity (g) times the water depth (d). v = (g*d) ^1/2. Because energy must be conserved, the decrease in wavelength, period, and velocity results in a very large increase in the amplitude.
_
Water waves: wind waves, tidal waves and tsunami
While waves that travel within the depths of the ocean are longitudinal waves, the waves that travel along the surface of the oceans are referred to as surface waves. A surface wave is a wave in which particles of the medium undergo a circular motion. Surface waves are neither longitudinal nor transverse. In longitudinal and transverse waves, all the particles in the entire bulk of the medium move in a parallel and a perpendicular direction (respectively) relative to the direction of energy transport. In a surface wave, it is only the particles at the surface of the medium that undergo the circular motion. The motion of particles tends to decrease as one proceeds further from the surface. The waves on the surface of ocean are known as surface waves or water waves which could be wind waves, tidal waves or tsunamis. Waves travel effortlessly along the water’s surface. This is made possible by small movements of the water molecules. When the wind blows across the water, it changes the water’s surface, first into ripples and then into waves. Once the surface becomes uneven, the wind has an ever increasing grip on it. Storms can make enormous waves, particularly if the wind, blows in the same direction for any length of time. As waves grow in height, the wind pushes them along faster and higher. Waves can become unexpectedly strong and destructive. As waves enter shallow water, they become taller and slow down, eventually breaking on the shore. Waves are circular oscillations in the water’s surface. For circular oscillations to exist and to propagate, there must be a returning force that brings equilibrium. In surface waves, the returning force is gravity, the pull of the Earth. Hence the name ‘gravity waves’ for water waves. If each water particle makes small oscillations around its spot, relative to its neighbors, waves can form if all water particles move at the same time and in directions that add up to the wave’s shape and direction. Because water has a vast number of molecules, the height of waves is theoretically unlimited. In practice, surface waves can be sustained as high as 70% of the water’s depth or some 3000 meter in a 4000 meter deep sea. Water waves can store or dissipate much energy. Like other waves (e.g. alternating electric currents), a wave’s energy is proportional to the square of its height (potential). Thus a 3 meter high wave has 3×3=9 times more energy than a 1meter high wave. It must be understood that it is the energy that moves from one part of ocean to seashore and not water. Water molecules only circularly oscillate up and down creating a surface water wave propagating energy forward. So when water waves arrive at a shore, it is not the same water that has traveled from the site of origin of water waves but energy has traveled; and water molecules are merely circularly oscillating in situ creating a wave. All types of surface water waves, including tsunamis, have a wavelength, a wave height or amplitude, a frequency or period, and a velocity.
_
Please note that the height (amplitude) of tsunami waves is lesser than wind waves at its origin but as tsunami approaches coastline, its height increases. The above picture is shown only to differentiate wind waves from tsunami waves.
_
Tidal waves are the crests of the tides which move across the surface of the Earth as the Earth’s water rises and falls, creating the tides. The size of a tidal crest can vary, depending on the relationship between the Earth, the moon, the sun and the area. A tidal wave is a shallow water wave caused by the gravitational interactions between the Sun, Moon, and Earth. The tides are not really a wave. They are a bulge in the level of the water due to the gravity of the moon primarily and of course since the earth is rotating that bulge will appear to move across the ocean. However, if you raise water by a certain amount and then let it subside it has to go somewhere. If this occurs in a bay or inlet where the rate that the water can flow back is restricted, then it will start to build up behind a wavefront as it tries to flow back but is impeded. This is called a tidal bore and these can be really large. Storm surges with hurricanes are similar. The water bulges up under the low pressure center of the hurricane and when that reaches land it pours onto the land as if the level of the ocean had risen. Combined with huge storm waves from the wind and also the fact that the wind can actually push the water in a given direction causing it to build up, this can be really devastating. Nonetheless, storm waves are not tsunami.
_
Many people have the mistaken belief that tsunamis are single waves. They are not. Instead tsunamis are “wave trains” consisting of multiple waves. The chart above is a tidal gauge record from Onagawa, Japan beginning at the time of the 1960 Chile earthquake. Time is plotted along the horizontal axis and water level is plotted on the vertical axis. Note the normal rise and fall of the ocean surface, caused by tides, during the early part of this record. Then recorded are a few waves a little larger than normal followed by several much larger waves (Tsunami).
_
Tsunami in deep sea
Although both are sea water waves, a tsunami and a tidal wave are two different unrelated phenomena. If you throw a stone in a pond it will create a series of ripples. A tsunami is just like those ripples but the disturbance that sets them moving is much greater than a small stone. It can be triggered by an undersea earthquake, landslide or volcanic eruption. A tsunami is a seismic sea wave caused by an underwater earthquake or landslide (usually triggered by an earthquake) displacing the ocean water. While everyday wind waves have a wavelength (from crest to crest) of about 100 meters and a height of roughly 2 meters, a tsunami in the deep ocean has a wavelength of about 200 kilometers. Such a wave travels at well over 800 kilometers per hour, but owing to the enormous wavelength the wave oscillation at any given point takes 20 or 30 minutes to complete a cycle and has amplitude of only about 1 meter (3.3 ft). This makes tsunamis difficult to detect over deep water. Ships rarely notice their passage. As a result of their long wave lengths, tsunamis behave as shallow-water waves. A wave becomes a shallow-water wave when the ratio between the water depth and its wave length gets very small. The main difference between tsunamis and wind-generated waves is the wavelength and period of the waves. Regular ocean wind waves have a wavelength of about 100m, and a period of about 10s. Tsunamis, on the other hand, have wavelengths of about 200 km, amplitude of less than 1 meter and a period on the order of an hour while the period of a tidal wave is from 12-24 hours (due to lunar gravity).
_
Tsunami definition:
A tsunami (from Japanese language meaning a harbor wave) is a series of water waves caused by the displacement of a large volume of a body of water, usually in ocean, though it can occur in large lakes. Earthquakes, volcanic eruptions and other underwater explosions (including detonations of underwater nuclear devices), landslides and other mass movements, meteorite ocean impacts or similar impact events, and other disturbances above or below water all have the potential to generate a tsunami. More than 80% of the world’s tsunamis were caused by earthquakes and over 60% of these were observed in the Pacific where large earthquakes occur as tectonic plates are subducted along the Pacific Ring of Fire. Tsunami is a series of waves which travel outward on the ocean surface in all directions in a kind of ripple effect. Since the waves can start out hundreds of miles long and only a few feet high, they would not necessarily be noticeable to a passing ship or a plane flying overhead. A tsunami is a huge ocean wave that travels at speeds up to 600 mi/hr (965 km/hr) like a jet aircraft at the onset over open sea before it hits land. Its speed depends upon the depth of the water, and consequently the waves undergo accelerations or decelerations in passing respectively over an ocean bottom of increasing or decreasing depth. By this process the direction of wave propagation also changes, and the wave energy can become focused or defocused. In the deep ocean, tsunami waves can travel at speeds of 500 to 1,000 kilometers (km) per hour. Near the shore, however, a tsunami slows down to just a few tens of kilometers per hour. As the waves get closer to shore, they decrease in speed and increase in height. They approach the coastline as a series of high and low water levels with their speed decreasing to about 30-40 mi/hr (50-60 km/hr) and growing to 30-50 meters high and smash into the shore as a wall of water or sweep over the land as a fast-moving flood. Severe tropical cyclone over an ocean can generate a storm surge which can raise tides several meters above normal levels and when this storm surge reaches shore, it simulate a tsunamis inundating vast areas of land but it is not a tsunami. Tsunamis were referred to as tidal waves in the past but this term has fallen out of favor, especially in the scientific community, because tsunamis actually have nothing to do with tides. The principal generation mechanism of a tsunami is the displacement of a substantial volume of water or perturbation of the sea. This displacement of water is usually attributed to earthquakes, landslides, volcanic eruptions, or more rarely by meteorites and nuclear tests. The waves formed in this way are then sustained by gravity. Tides do not play any part in the generation of tsunamis.
_
A megatsunami is meant to refer to a tsunami with an initial wave amplitude (wave height) measured in several tens, hundreds, or possibly thousands of meters. Megatsunamis can be caused by giant landslides and asteroid impacts. Underwater earthquakes or volcanic eruptions do not normally generate such large tsunamis.
_
Physics of tsunami generation:
Earthquakes are commonly associated with ground shaking that is a result of elastic waves traveling through the solid earth. However, near the source of submarine earthquakes, the seafloor is “permanently” uplifted and down-dropped, pushing the entire water column up and down. The potential energy that results from pushing water above mean sea level is then transferred to horizontal propagation of the tsunami wave (kinetic energy). When these earthquakes occur beneath the sea, the water above the deformed area is displaced from its equilibrium position. Waves are formed as the displaced water mass, which acts under the influence of gravity, attempts to regain its equilibrium. When large areas of the sea floor elevate or subside, a tsunami can be created. Not all earthquakes are tsunami-genic (generate tsunami); to generate a tsunami, the earthquake must occur under or near the ocean, be large, and create vertical movements of the seafloor. It is thought that tsunami-genic earthquakes release their energy over a couple of minutes, much more slowly than the sudden lurching earthquakes, which release their energy in seconds. In fact, some tsunami-genic earthquakes can not be felt by people, so gradual is their energy release. Tsunamis are generally only formed when an earthquake causes vertical displacement of the seafloor. A large earthquake can lift thousands of square kilometers of sea floor which will cause huge volume of water pushed up releasing huge amounts of energy as a result of quick upward bottom movement. Much of the earthquake’s energy, which can be equivalent to many atomic bombs, is transferred to the water column above it, producing a tsunami. A tsunami carries an enormous amount of energy that is spread over a large volume of water in the deep sea. Within several minutes of the earthquake, the initial tsunami is split into a tsunami that travels out to the deep ocean (distant tsunami) and another tsunami that travels towards the nearby coast (local tsunami). The height above mean sea level of the two oppositely traveling tsunamis is approximately half that of the original tsunami. Tsunamis have periods (the time for a single wave cycle) that may range from just a few minutes to as much as an hour or exceptionally more. In the open ocean, the waves are at most less than 1 meter in height over many tens to hundreds of kilometers in length. Tsunamis will sometimes go undetected until they approach shallow waters along a coast. These waves have a very large wavelength (up to several hundred kilometers) that is a function of the depth of the water where they were formed. The rate at which a wave loses its energy is inversely related to its wavelength. Since a tsunami has a very large wavelength, it will lose little energy as it propagates. Thus, in very deep water, a tsunami will travel at high speeds with little loss of energy. The velocity of a tsunami is dependant on only one factor: the depth of the ocean over which it is traveling. The velocity is equal to the square root of g (gravitational constant 9.81 meter/ square second) times the average depth of the ocean and you get velocity of tsunami in meter per second. Calculating from this formula, at a depth of about 4000 meter, a tsunami will travel at about 700km/hr (200 meter per second). Although these waves have a small height, there is a tremendous amount of energy associated with them. When a tsunami reaches shallow water, such as a coastline, the energy is concentrated into a smaller volume and the wave’s power overwhelms whatever is in its path. In shallow water, its speed decreases and due to tremendous energy, its amplitude increases to dangerous heights, sometimes to 30 meters, and it spreads inland many hundreds of meters (in some cases a kilometer or more). A tsunami is not a single wave, but a set that may last for several hours, and the first wave is not always the largest.
_
The above figure shows that when the wave enters shallow water, it slows down and its amplitude (height) increases.
_
As a tsunami leaves the deep water of the open sea and arrives at the shallow waters near the coast, it undergoes a transformation. Since the velocity of the tsunami is also related to the water depth, as the depth of the water decreases, the velocity of the tsunami decreases. The total energy of the tsunami, however, remains constant. Furthermore, the period of the wave remains the same, and thus more water is forced between the wave crests causing the height of the wave to increase. Because of this “shoaling” effect, a tsunami that was imperceptible in deep water may grow to have wave heights of several meters or more. This results in steepening of the leading wave–an important control of wave run-up at the coast. If the trough of the tsunami wave reaches the coast first (drawback), this causes a phenomenon called Drawdown, where it appears that sea level has dropped considerably. Drawdown is followed immediately by the crest of the wave which can catch people observing the drawdown off guard. When the crest of the wave hits, sea level rises (called run-up). Run-up is a measurement of the height of the water onshore observed above a reference sea level. Run-up is usually expressed in meters above normal high tide. Run-ups from the same tsunami can be variable because of the influence of the shapes of coastlines. One coastal area may see no damaging wave activity while in another area destructive waves can be large and violent. The flooding of an area can extend inland by 300 meter or more, covering large areas of land with water and debris. Flooding tsunami waves tend to carry loose objects and people out to sea when they retreat. Tsunamis may reach a maximum vertical height onshore above sea level, called a run-up height, of 30 meters. A notable exception is the landslide generated tsunami in Lituya Bay, Alaska in 1958 which produced a 60 meter high wave. Because the wavelengths and velocities of tsunamis are so large, the period of such waves is also large, and much larger than normal ocean waves. Thus it may take several hours for successive crests to reach the shore. (For a tsunami with a wavelength of 200 km traveling at 750 km/hr, the wave period is about 16 minutes). Thus people are not safe after the passage of the first large wave, but must wait several hours for all waves to pass. The first wave may not be the largest in the series of waves. Do tsunamis stop once on land? No! After run-up, part of the tsunami energy is reflected back to the open ocean and scattered by sharp variations in the coastline. In addition, a tsunami can generate a particular type of coastal trapped wave called edge waves that travel back-and forth, parallel to shore. These effects result in many arrivals of the tsunami at a particular point on the coast rather than a single wave. Because of the complicated behavior of tsunami waves near the coast, the first run-up of a tsunami is often not the largest, emphasizing the importance of not returning to a beach many hours after tsunami first hits. Also, if the first part of a tsunami to reach land is a trough called a Drawback rather than a wave crest, then the water along the shoreline recedes dramatically, exposing normally submerged areas. A drawback occurs because the water propagates outwards with the trough of the wave at its front. Drawback begins before the wave arrives at an interval equal to half of the wave’s period. Drawback can exceed hundreds of meters, and people unaware of the danger sometimes remain near the shore to satisfy their curiosity or to collect fish from the exposed seabed. A tsunami can occur in any tidal state and even at low tide can still inundate coastal areas.
_
A cubic meter of water (1m x 1m x 1m) weighs 1000 kilo. Tsunami travels on land at about 30 to 50 km/hour. Imagine 1000 kilo hitting you from all directions at that speed. Now you’re getting the idea of the destructive power of a tsunami. Imagine a wall of water, 10 meters high. If that wave is two kilometer long into the ocean, it’s basically like a hundred tanks coming across you. Even though it’s a fluid, it operates like a solid hammer. Tsunamis cause damage by two mechanisms: the smashing force of a wall of water traveling at high speed, and the destructive power of a large volume of water draining off the land and carrying all with it, even if the wave did not look large. Beyond the tremendous destruction of life that tsunamis cause, they have also caused massive physical damage. They have entirely destroyed buildings and left towns looking like a nuclear war zone. They have lifted boats high out of the water and violently hurled them against the shore, smashing them to pieces. Recent tsunami in Japan has created havoc at nuclear power plants. Areas at greatest risk are usually within one mile (1.6 km) of the shoreline and less than 25 feet (7.6 meters) above sea level. In 2004, an earthquake shook the ocean floor in the Indian Ocean near Indonesia. The resulting tsunami killed more than 200,000 people in Indonesia, Sri Lanka, Thailand, and India, and as far away as the African countries of Somalia and Madagascar. Waves reached a height of 65 feet (20 meters).
_
Tsunami approaching town Rikuzentakata on the coast of NE Japan
Town getting overwhelmed by tsunami
Tsunami water leaves a trail of destruction
_
Knowledge regarding preparation for tsunami:
1) Since earthquakes frequently precipitate a tsunami, if an earthquake happens, expect a tsunami warning in its wake. Leave low-lying areas until the danger passes.
2) As a tsunami approaches there is often a noticeable drop in sea level; take it as nature’s warning to leave the area. An incoming tsunami often sounds like an oncoming train – another of nature’s warnings.
3) Though a tsunami may be small and harmless on one point on the shore, a little further away it could be much larger and carry far greater dangers.
4) Do not go to the shore to look for a tsunami; if you can see it, you are already too close to outrun it. The speed of tsunami after crashing over shore is about 30 to 50 kilometer per hour, faster than your running speed.
5) You should never try to surf a tsunami; the wave does not behave like a regular wave, curling or breaking.
6) If you are at the beach and feel the earth shake, immediately move to higher ground.
7) If you are on a boat or ship and there is time, move your vessel to deeper water (at least 100 fathoms). If it is the case that there is concurrent severe weather, it may be safer to leave the boat at the pier and physically move to higher ground.
8) Drowning is the cause of most tsunami-related deaths. Other dangers to property and person include flooding, fires from ruptured tanks or gas lines, contaminated drinking water, and the loss of vital community infrastructure (police, fire, medical).
_
Tsunami warning and predictions:
A tsunami cannot be precisely predicted, even if the magnitude and location of an earthquake is known. Geologists, oceanographers, and seismologists analyze each earthquake and based on many factors may or may not issue a tsunami warning. However, there are some warning signs of an impending tsunami, and automated systems can provide warnings immediately after an earthquake in time to save lives. Regions with a high tsunami risk typically use tsunami warning systems to warn the population before the wave reaches land. A Tsunami Warning System (TWS) is a system to detect tsunamis and issue warnings to prevent loss of life and property. It consists of two equally important components: a network of sensors to detect tsunamis and a communications infrastructure to issue timely alarms to permit evacuation of coastal areas. Tsunamis are detected by open-ocean buoys and coastal tide gauges, which report information to stations within the region. The Deep-Ocean Assessment and Reporting of Tsunamis (DART) uses unique pressure recorders that sit on the ocean bottom. These recorders are used to detect slight changes in the overlying water pressure. The DART system can detect a tsunami as small as a centimeter high above the sea level. Tsunami can also be predicted depending on the fact that, while tsunamis travel at between 500 and 1,000 km/h (around 0.14 and 0.28 km/s) in open water, earthquakes can be detected almost at once as P waves travel with much faster speed of 7 km/s (around 25200 km/h). This gives time for a possible tsunami forecast to be made and warnings to be issued to threatened areas, if warranted. Tide stations measure minute changes in sea level, and seismograph stations record earthquake activity. A tsunami watch goes into effect if a center detects an earthquake of magnitude 7.5 or higher. Civil defense agencies are then notified, and data from tidal gauge stations are closely monitored. If a threatening tsunami passes through and sets off the gauge stations, a tsunami warning issues to all potentially affected areas. Evacuation procedures in these areas are then implemented. Tsunami warning system centers use seismic data about nearby earthquakes to determine if there is a possible local threat of a tsunami. Such systems are capable of issuing warnings to the general public (via public address systems and sirens) in less than 15 minutes. Although the epicenter and moment magnitude of an underwater quake and the probable tsunami arrival times can be quickly calculated, it is almost always impossible to know whether underwater ground shifts have occurred which will result in tsunami waves. As a result, false alarms can occur with these systems, but due to the highly localized nature of these extremely quick warnings, disruption is small. In order to be able to issue warnings about tsunamis generated within 100 to 750 km of an earthquake, several regional warning centers have been set up in areas prone to tsunami generating earthquakes. These include centers in Japan, Kamchatka, Alaska, Hawaii, French Polynesia, and Chile.
Like all warning systems, the effectiveness of tsunami early warning depends strongly on local authority’s ability to determine that their is a danger, their ability to disseminate the information to those potentially affected, and on the education of the public to heed the warnings and remove themselves from the area.
_
Computer models can predict tsunami arrival, usually within minutes of the arrival time. Bottom pressure sensors relay information in real time. Based on these pressure readings and other seismic information and the seafloor’s shape (bathymetry) and coastal topography, the models estimate the amplitude and surge height of the approaching tsunami.
_
It is possible that certain animals (e.g., elephants) may have heard the sounds of the tsunami as it approached the coast. The elephants in the 2004 Indian Ocean Tsunami fled for the hills. They sensed the tsunami due to their ability to hear the sound waves outside of the range of human hearing range of 20Hz and 20,000Hz. In addition to hearing within the human range, elephants can also hear in the range of infrasound, beneath 20 Hz down to 0.001 Hz. The elephant’s reaction was to move away from the approaching noise. By contrast, some humans went to the shore to investigate and many drowned as a result. Drawbacks can serve as a brief warning. People who observe drawback (many survivors report an accompanying sucking sound), can survive only if they immediately run for high ground or seek the upper floors of nearby buildings.
_
GPS based tsunami warning:
The new method, called GPS displacement, works by measuring the time radio signals from GPS satellites arrive at ground stations located within a few thousand kilometers of a quake. From these data, scientists can calculate how far the stations moved because of the quake. They can then derive an earthquake model and the quake’s true size, called its ‘moment magnitude.’ This magnitude is directly related to a quake’s potential for generating tsunamis. As illustrated by the magnitude 9.2-9.3 Sumatra quake of December 2004, current scientific methods have difficulty quickly determining moment magnitude for very large quakes. That quake was first estimated at 8.0 using seismological techniques designed for rapid analysis. Because these techniques derive estimates from the first seismic waves they record, they tend to underestimate quakes larger than about 8.5. That is the approximate size needed to generate major ocean-wide tsunamis. The initial estimate was the primary reason warning centers in the Pacific significantly underestimated the earthquake’s tsunami potential. The potential of GPS to contribute to tsunami warning became apparent after the Sumatra earthquake. GPS measurements showed that quake moved the ground permanently more than 1 centimeter (0.4 inches) as far away as India, about 2,000 kilometers (1,200 miles) away from the epicenter. If GPS data could be analyzed rapidly and accurately, they would quickly indicate the earthquake’s true size and tsunami potential. Thus a large quake’s true size can be determined within 15 minutes using GPS data and timely tsunami warning can be issued.
_
However, no system can protect against a very sudden tsunami, where the coast in question is too close to the epicenter. A devastating tsunami occurred off the coast of Hokkaid? in Japan as a result of an earthquake on July 12, 1993. As a result, 202 people on the small island of Okushiri, Hokkaido lost their lives, and hundreds more were missing or injured. This tsunami struck just three to five minutes after the quake, and most victims were caught while fleeing for higher ground and secure places after surviving the earthquake.
_
Tsunami mitigation:
Japan has built many tsunami walls of up to 4.5 meters (15 ft) to protect populated coastal areas. Other localities have built floodgates and channels to redirect the water from incoming tsunami. However, their effectiveness has been questioned, as tsunami often overtops the barriers. For instance, the Hokkaid? tsunami which struck within three to five minutes of the earthquake on July 12, 1993 created waves as much as 30 meters (100 ft) tall – as high as a 10-story building. Environmentalists have suggested tree planting along tsunami-prone seacoasts. Trees require years to grow to a useful size, but such plantations could offer a much cheaper and longer-lasting means of tsunami mitigation than artificial barriers.
_
Did earthquake & tsunami warning system work in Japan on 11’th march, 2011?
Remember basics. P waves travels at the speed of 7 km/second, S wave travels at the speed of 4 km/second and tsunami travels at the speed of 200 meter/second. Japan has spent well more than $1 billion on earthquake prediction systems, including a network of more than 1,000 GPS-based sensors scattered around the country – and the payoff came on 11’th march when Tokyo’s residents were given up to a minute’s warning that a ‘Big One was on the way’. That may not sound like much, but it’s enough time for people to switch off their gas lines and get beneath a table or a door frame. One minute prior to the effects of the earthquake being felt in Tokyo, the Earthquake-Early Warning system, which is connected to more than 1,000 seismometers in Japan, sent out warnings of an impending earthquake to millions. This was possible because the damaging seismic S-waves, traveling at 4 km per second took about 90 seconds to travel the 373 km to Tokyo. The early warning has saved many lives. The system functioned well, because warnings were seen on television across the country. The warning system was also transmitted to computer screens and to school giving five to 10 seconds warning to Sendai, the closest city to the epicenter. The system capitalizes on the fact that a seismic event sends out two types of shock waves: primary or P-waves, which move up and down; and secondary or S-waves, which shake from side to side. The P-waves travel faster but are weaker, while the S-waves are slower but do more damage. When Japan’s system picks up the P-waves, it calculates how far away the source of the shaking is and issues an alarm while the S-waves are still en route. A warning can be broadcast via TV, Radio, cell phones and home alarms less than 10 seconds after the P-waves are detected. The warning transmission & telecast is through electromagnetic waves which are much faster than S waves. The early warning system isn’t that useful for those who are close to the epicenter, because the S-waves come quickly behind the P-waves. But because Tokyo is about 373 km away from epicenter, that city’s residents could have taken action as much as 60 seconds before the serious shaking began. That amount of time can give people a chance to stop a train, lower a crane, pull a car over to the side of the road, and stop performing surgery in a hospital or get off an elevator in an office building. It takes longer to issue a tsunami warning, because that’s dependent on an analysis of wave propagation from an undersea seismic source. The Japanese government issued a local tsunami warning three minutes after the quake struck. Technology Review estimates that residents in the hardest-hit coastal areas had 15 minutes of warning, and that Tokyo would have had at least 40 minutes to prepare. This is because P & S waves travel much faster than tsunami waves. So in a nutshell, system worked in Japan no matter massive damage occurred nonetheless. Mexico, Taiwan, Turkey and Romania also have earthquake early-warning systems that were installed after deadly earthquakes, but U.S. and major developing country like India do not have such a system.
_
The truth about nuclear meltdown of Japan on 11’th march, 2011
The above figure shows basic design of a nuclear power plant.
In nuclear power plants, purified water is run between the radioactive fuel rods, and it boils and turns into steam, which is then use to turn a turbine, which turns lard dynamos and generates electricity. Vibrations from the magnitude 9.0 earthquake triggered an immediate shut down of 15 of Japan’s nuclear power stations. Seismic sensors picked up the earthquake and control rods were automatically inserted into the reactors, halting the fission reaction that is used to produce electricity. Reactors shut themselves down automatically when something called ‘ground acceleration’ is registered at a certain point, which is usually quite small. It will instantly drop control rods into the [nuclear] core. Even though that stopped the process whereby the fuel rods send neutrons into the reactor core where fission proceeds to produce nuclear energy, heat from nuclear decay continues to flow off the fuel rods. Although the fission reaction is halted by the insertion of the control rods, the radioactive decay of the fuel continues to take place, producing heat. Cooling is needed to remove decay heat from the reactor core even when a plant has been shut down. Generally speaking, it takes few days to cool down fuel rods by constantly circulating purified water around it by pumps. However, if cooling system fails, then the temperatures inside the reactor core gets too high – above 2,200 degrees C – the fuel rods themselves start to melt, releasing the radioactive material inside and allowing the fuel to heat up uncontrollably. Due to sudden shutdown of nuclear rectors, there was sudden loss of power (electricity) across Japan’s national power grid causing widespread power failures, cutting vital electricity supplies to nuclear power plants themselves. An external electricity supply is needed to actively pump cooling water around the 40 year old reactors at Fukushima Daiichi. When a reactor is shut down normally, this supply of water carries heat away from the fuel rods to prevent them from overheating. The water is cooled and circulated back into the reactor, allowing heat to be removed indefinitely. Normally the plant could use an external electrical supply to power cooling and control systems, but the tsunami caused major damage to the regional power grid. The plant’s connection to the electric grid was severed. Without electricity, however, this cooling system could not operate, meaning large banks of emergency back up batteries are used to keep the coolant flowing for few hours. Normally diesel-powered back up generators start up to keep the cooling system running. However, the tsunami swept away supply pumps that would have provided emergency cooling water from the sea and also destroyed the fuel tanks of the diesel generators, which were positioned above ground at the seaward edge of the site. Without fuel, the diesel generators spluttered to a halt. There were also reports that the emergency batteries & generators themselves were also swamped by seawater. The plant was protected by a seawall which was designed to withstand a tsunami of 5.7 meters (19 ft), but the wave that struck the plant was estimated to be more than twice that height at 14 meters (46 ft), meaning huge amounts of damage was caused to the vital infrastructure designed needed to keep the reactors operating safely. As a consequence, the emergency generators were disabled and the reactors started to overheat due to natural decay of the nuclear fuel contained in them. The flooding and earthquake damage complicated assistance being brought from elsewhere. Since there wasn’t electrical power to pump water through the cooling system and dissipate the extra heat, workers have struggled to keep the fuel rods submerged in water to prevent the reactors from overheating. Without the cooling system, the water in the sealed reactor containment vessels reactors turned to steam, increasing the pressure inside. As the temperatures increased, zirconium metal, used in the casing of the fuel rods, catalyzed the breakdown of water in the reactor to produce hydrogen gas. In a bid to ease the growing pressure inside the reactor containment vessels, workers at the site released some of the steam and hydrogen gas. This then became caught inside the reactor buildings where the hydrogen ignited causing explosions. So these explosions were not nuclear explosions as reported by media.
_
When the fuel rods melts, the [nuclear] fission products can be released from the fuel into the reactor pressure vessel, and then into the containment if the coolant leaks from the reactor vessel. The containment is designed to hold in the radioactive material. However, the hydrogen ignited explosion sent the deadly fission products into the air and it fell into the surrounding countryside, causing high levels of dangerous radioactivity in vicinity, and would eventually spread by wind & water to distant places. Also, even though engineers have been able to pump water into some of the damaged reactors to cool them down, but leaks have resulted in the pooling of tons of contaminated, radioactive water that has prevented workers from conducting further repairs.
_
Under normal circumstances, spent fuel rods are kept in water pools for several months to carry away heat due to radioactive decay and to prevent radiation leak to environment. Even as workers race to prevent the radioactive cores of the damaged nuclear reactors in Japan from melting down, concerns are growing that nearby pools holding spent fuel rods could pose an even greater danger because these pools have lost their cooling systems. The water meant to cool spent fuel rods in few of the reactors was boiling. If this water evaporates and the spent fuel rods run dry, they could overheat and catch fire, potentially spreading radioactive materials in dangerous clouds. The decay heat has the capacity to boil off about 70 tones of water per day (12 gallons per minute), which shows how much water is needed to carry away heat from spent fuel rods. Of course, there is no report of spent fuel rods getting dry and overheat yet but it is a matter of concern as well.
_
The unit for the absorbed dose of ionizing radiation is sievert (sv). We safely absorb small amount of natural radiation daily.
1000 microsieverts = 1 millisievert
1000 millisieverts = 1 sievert
_
The highest reported radiation dose at Fukushima power plant was 1000 millisieverts per hour on 16 March, prompting a temporary evacuation of plant workers. Later on radiation levels at the Fukushima power plant came down to around 400 millisieverts per hour. By comparison at Chernobyl, the radiation levels were around 300 sieverts per hour – 750 times greater. Nonetheless, even exposure to 400 millisieverts per hour would certainly be a matter for grave concern. By way of contrast, the current average limit of exposure for nuclear plant workers is a total of 20 millisieverts, not per hour, but over an entire year, according to the World Nuclear Association (WNA), a trade group of industry professionals. Health effects are evident at exposures of 100 millisieverts per year. A typical person is exposed to about 2.4 millisieverts per year of natural radiation, according to the IAEA, though this amount can vary quite a bit depending on where the person lives. The cumulative amount of radioactive materials released into the atmosphere from Fukushima plant was around 10 percent that of Chernobyl. In the area around the plant, the Japanese authorities have been issuing potassium iodide tablets, which can help prevent the harmful radioactive iodine from being absorbed by the body. According to the IAEA, the dose-rates measured at distances from 56 to 200 km from the plant range from 2 to 160 microsieverts per hour, which is higher as compared to a typical natural background level of around 0.1 to 0.3 microsieverts per hour. IAEA also states that so far, there are no health risks to people living in other countries from radioactive materials released from the Japanese nuclear power plants.
_
We’ve been hearing a lot about radiation levels of 400 millisieverts per hour being registered in the vicinity of the Fukushima nuclear plant, but what does that mean? The following chart shows how a 400 millisieverts per hour exposure compares to other common types of radiation exposure.
| Millisievert | |
| Chest x-ray | 0.1 |
| Two-view mammogram | 0.36 |
| Average annual background exposure in the U.S. | 3 |
| Cardiac nuclear stress test | 9.4 |
| CT scan of the abdomen | 10 |
| Coronary angiogram | 20 |
| Average exposure of evacuees from Belarus after 1986 Chernobyl disaster | 31 |
| Annual dose limit for nuclear power plant workers | 20 |
| Spike recorded at Fukushima Daiichi nuclear power plant per hour | 400 |
| Acute radiation sickness begins | 1,000 |
As you can see, the situation is far from inconsequential within the vicinity of the Japanese power plant. However, about 50 km away from nuclear power plant; it was 2 to 160 microsieverts per hour while an X-ray chest would cause radiation exposure of 100 microsievert (0.1 millisievert).
_
Radiation levels in sea water near Japan’s damaged Fukushima nuclear plant have reached more than 3,000 times the legal limit.The levels of radioactive iodine found in seawater near Fukushima nuclear plant have reached more than 4,385 times the legal limit. Health concerns have been rising in Japan after the government found unacceptable radiation levels in milk and vegetables from several regions and in drinking water in Tokyo. The radiation comes from the crippled Fukushima Daiichi nuclear plant. The good news is that iodine-131 has a half-life of only 8 days, so any radiation from the Fukushima plant will be gone from the water within a couple of months once the leaks are stopped. But cesium-137 is a different story. Once the cesium enters the soil, its half-life of 30 years becomes a long-lasting problem for sure and it will show up in vegetables, meat, and milk.
_
Why potassium iodide is recommended in nuclear disaster?
Radioactive iodine is one of the fission products of nuclear fission in nuclear power plant. Nuclear fission products are the atomic fragments left after a large atomic nucleus fissions. Typically, a large nucleus like that of uranium fissions by splitting into two smaller nuclei, along with a few neutrons and a large release of energy in the form of heat (kinetic energy of the nuclei), gamma rays and neutrinos. The two smaller nuclei are the “fission products. The largest source of fission products is from nuclear reactors. In current nuclear power reactors, about 3% of the uranium in the fuel is converted into fission products as an unavoidable by-product of energy generation. Most of these fission products remain in the fuel unless there is fuel element failure, or a nuclear accident, or the fuel is reprocessed. For fission of uranium-235, the predominant radioactive fission products include isotopes of iodine, caesium, strontium, xenon and barium. It is important to understand that the size of the threat becomes smaller with the passage of time. Locations where radiation fields once posed immediate mortal threats, such as much of the Chernobyl Nuclear Power Plant on day one of the accident and the ground zero sites of Japanese atomic bombings (6 hours after detonation), are now safe as the radioactivity has decayed to a very low level. Due to failure to cool down fuel rods in nuclear power plants in Japan, fission products were released in environment including radioactive iodine. If you have not been taking iodine and a radioactive cloud comes near your area, then it would make sense to take large doses of prophylactic iodine to prevent your thyroid gland from absorbing the radioactive iodine. However it is important to understand that the large dose of potassium iodide only protects your thyroid for one to three days, no longer and it does absolutely nothing to protect you from detoxifying the radiation. A study found over 95 % of people to be iodine deficient. The massive prevalence of iodine deficiency is a new phenomenon that is likely a result of an absolute deficiency of iodine intake combined with exposure to other environmental halogens that compete for iodine receptors. That would be the fluoride & chloride which is pervasive in our water supply, along with the halogenated byproducts. Additionally we have bromine, which is part of most white flour products and added to many items like rugs, carpets and pesticides added to commercial fruits and vegetables. Therefore, the 130 mg of potassium iodide one-time adult dose is currently recommended by public health authorities for radiation prophylaxis.
_
After two strong aftershocks, Japanese government on 11’th April, 2011 had raised the crisis level to the worst on the international scale. With radioactive substances pouring out a ‘wide area’, the crisis level had been raised from 5 to 7, posing a threat to human health and the environment. Level 7 has only been applied to the Chernobyl accident in the former Soviet Union in 1986.
A 7 rating means there has been a major release of radioactive material with widespread health and environmental effects requiring implementation of planned and extended countermeasures. The Chernobyl disaster spewed debris as high as 9 kilometers into the air and released radiation 200 times the volume of the combined bombings of Hiroshima and Nagasaki in 1945, while radiation leak is substantially less in Fukushima. Fewer people have been exposed to high levels of radiation from Fukushima than Chernobyl. The important thing is monitoring and protecting people on the ground. Experts agree that Fukushima is not as bad as it can get and not as bad as Chernobyl.
_
Discussion:
First question that comes in mind is, can earthquake be predicted?
Yes in my view, but it will take time to predict accurately. We need more research. Seismogenic ULF (ultra-low-frequency) electromagnetic emission is recognized as one of the most promising candidates for short-term earthquake prediction. Further, it is important to investigate the spatial and temporal scales of those emissions by the simultaneous use of the data at multiple ground stations and multiple satellites, and also to determine the source region of the noise by means of direction finding. Finally, it is also desirable to compare the ULF seismogenic emission with other seismogenic phenomena at different frequencies and to perform the coordinated analysis with the seismic and geological data for the complete understanding of electromagnetic phenomena associated with earthquakes and volcano eruption.
_
A study examined pre-earthquake ionospheric anomalies by the total electron content (TEC) derived from a ground-based receiver of the Global Positioning System (GPS). Results show that the pre-earthquake ionospheric anomalies appear within 5 days prior to 16 of the 20 M>= 6.0 earthquakes. This success rate of 80% suggests that the GPS TEC is useful to register pre-earthquake ionospheric anomalies appearing before large earthquakes.
_
Studying seismicity using computer model and math to predict earthquake is also quite reliable. GPS sensors that can detect minute movements in the Earth’s crust and therefore offer “pre-signals” of the occurrence and location of the epicenter of an earthquake but not time of eruption. However, if GPS sensor method is combined with detection of ULF electromagnetic waves, it would work. I therefore recommend amalgamation of various genuinely scientific methods simultaneously in a unified command center to predict earthquake accurately. Instead of predicting earthquakes by different scientists by different method at different places, a unified scientific command is a better option.
_
If earthquake can not be predicted, at least, people can be warned before shaking starts. Quake-Guard sensors & seismometers are designed to detect the initial, or P waves given off by every quake, even though it’s the later, or S waves that do most of the damage. The time in-between the two waves varies depending on the proximity to the epicenter, and as the first sensor closest to the quake goes off, it can offer advance notice — from a few seconds to a full minute– to other locations farther away. Remember, electromagnetic waves travel much faster than seismic waves. As soon as P wave arrives in the nearest seismic station, a warning can be issued on TV, Radio and cell phones before S waves arrives and even few seconds can save many lives. However, if you live on epicenter or near epicenter, then you have to manage yourself because then, S waves are quickly following P waves and so there is no time for warning.
_
Second question that comes in mind is, can tsunami warning be issued sufficiently earlier to alert people after a sub-marine earthquake has erupted?
Yes. The experience of Japan on 11’th of March, 2011 showed that tsunami warning was issued to coastal area about 15 minutes before tsunami actually arrived. The epicenter was 129 km away from coast and if tsunami traveled at a speed of 500 km/hr, it would take 15 minute to reach coast. So the warning was given in scientifically accurate time. Of course, P waves travel very fast about 25200 km/hr and reach nearest seismic station in less than 1 minute. That is why nuclear power plants shut down much before tsunami arrived. Japan is a developed country and so system worked and yet thousands died. What about developing countries like India, Pakistan etc? Can the people in coastal area be informed via TV, Radio, and Cell Phone much before tsunami arrives? No. I live in a small town Daman which is located on seashore and my hospital is only 100 meter away from sea. If there is an earthquake in Arabian Sea and tsunami is generated, I will die as nobody in India will inform me in time to run away. There should be a system in place in all countries that have seashores whereby advanced tsunami warning is given via TV, Radio and Cell phones. In fact, all cell phones of all residents of seashores must be registered on a central computer which will give advance tsunami warning as soon as P wave has reached the nearest seismic station notifying a sub-marine earthquake, and these seismic stations are connected to central computer. There is a possibility of false alarm but it is better than no alarm.
Of course, if the epicenter of a tsunami-generating sub-marine earthquake is near coastline, then no system will work.
_
In my theory of Duality of Existence, I have shown that randomness and certainty coexist simultaneously depending on knowledge of all variables. The biggest issue with earthquake & tsunami is the randomness with which they strike. This is so because we do not know how various variables work. We know that tectonic plates move, we know that rocks slip, we know that tremendous energy equivalent to thousands of atom bombs is released but yet, we do not know all the players in the game and how each player works according to which scientific law. So we need better physics.
_
Third question that comes to mind is the safety of people vis-à-vis nuclear power plants. There is no place on the earth that is earthquake resistant. Yes, there are tectonic plate boundary faults and there is a Pacific ring of fire but earthquake can occur anywhere. The earthquake in Gujarat, India in 2002 was an intraplate earthquake which was devastating. Does that mean that we shut down all nuclear power plants all over world? I see TV debate on this subject and many pseudo-intellectuals talk against nuclear power who are oblivious of science. As on January 2011, there are 442 nuclear power plants in the world producing 16 % of world electricity. We need electricity. We need development. We need better life. So what is the way out? A typical (500 megawatt) coal power plant burns 1.4 million tons of coal each year. There are thousands of coal power plants worldwide. Coal pollutes when it is mined, transported to the power plant, stored, and burned. Pollution from coal-fired power plants is responsible for more than 100,000 deaths per year, whereas the crisis at the Fukushima nuclear plant is unlikely to kill a single person….The technicians who died in Fukushima nuclear power plant, died due to tsunami drowning and not radiation illness. On the other hand, thousands of coal miners continue to die annually worldwide, either through direct accidents in coal mines or through adverse health consequences from working under poor conditions. In fact, the nuclear disaster in Japan shows how safe nuclear reactors actually are. Reactors designed half a century ago survived an earthquake many times stronger than they were designed to withstand, immediately going into shut-down (bringing driven nuclear reactions to a halt). On the contrary, widespread coal mining itself is responsible for generating earthquakes by inducing increased seismicity. Nonetheless, Japanese nuclear facilities have shown their vulnerability to tsunami, other countries could also face similar risks. South Korea, Taiwan, southern China, India, Pakistan and the west coast of the US have operating or planned nuclear facilities on tsunami-exposed coastlines, while nuclear sites in areas of high or extreme risk of earthquakes can be found in western US, Taiwan, Armenia, Iran and Slovenia. Of 442 nuclear power stations globally, more than one in 10 are situated in places deemed to be at high or extreme risk of earthquakes. But that does not mean that the rest are safe because theoretically, earthquake can occur anywhere. So what is the solution? First is to design nuclear power plant through earthquake engineering so that they are earthquake resistant. Second, every nuclear plant should have its own seismic station which can sense P waves and a mechanism whereby plant is shut off instantly if P waves of significant amplitude are registered. The control rods are inserted in nuclear core to halt nuclear fission immediately. All seismic station 50 to 100 km away from nuclear plant must be connected to plant via radio waves so that if they register P waves, it is communicated to plant which is faster because radio waves travel much faster than seismic waves. In fact, Japanese and many other nuclear plants are designed to withstand earthquakes, and in the event of major earth movement, to shut down safely. The Japanese plants are fitted with seismic detectors. If these register ground motions of a set level, systems will be activated to automatically bring the plant to an immediate safe shutdown. Third is to construct high wall of at least 10 meters to block tsunami waves on seashore nuclear plants but Japanese tsunami is reported to have height of about 30 meters in some places and to construct a wall of 30 meter high is difficult. Tsunami usually does not travel for more than 1 kilometer deep on coast but Japanese tsunami traveled up to 10 kilometer inland and therefore we must build future nuclear plants at least 10 kilometer away from ocean. Also, in tsunami-prone reactors, the cooling system must be constructed on height unreachable by tsunami so that water pumps, diesel generators and diesel tanks are situated at a higher level where tsunami cannot reach.
_
Can we design a nuclear reactor than shut itself off and cool itself down by inserting control rods alone without the need of continually circulating coolant? Pebble-bed and Thorium reactor designs meet this specification. If it begins to overheat, a little plug melts and the salts drain into a pan. There is no need for the sort of electrical pumps that were crippled by the tsunami. The reactor saves itself. Also, they operate at atmospheric pressure so you don’t have the sort of hydrogen explosions we’ve seen in Japan. I am sure that these reactors would have come through the tsunami just fine. There would have been no radiation release.
_
Water water everywhere but not a drop to cool down reactor core in Japanese nuclear power plants.
Yes, this is true.
Japanese tsunami swept away water pumps, diesel generators and diesel tanks, damaging cooling system, causing increase in temperature of reactor core resulting in partial meltdown of fuel rods.
Can we devise a system whereby tsunami water itself is used to cool down reactor core at least temporarily?
It is possible. During construction of nuclear power plants on seashore, an underground ductal system with inlets on surface to carry water directly to reactor pressure vessel is constructed. During normal plant operation, the valves are closed. In event of catastrophic tsunami overrunning a plant, just open these ductal valves and tsunami water will rush through ducts directly to reactor core in a controlled way to cool down fuel rods to prevent nuclear meltdown. Boric acid can be added as a neutron absorber in sea water. The same ductal system can provide water to water pools of spent fuel rods to prevent them getting dry and hot. It must be emphasized that the height of reactor pressure vessel above sea level should not be more than tsunami height otherwise water will not flow in it. However, flooding the reactors with sea water effectively ends their life due to salt content of sea water. The reactor cores will have to be dismantled. But nuclear disaster can be averted. After devastating tsunami has receded, the same ductal system can be used to pump water around fuel rods through water tankers or other means as we have an alternate access to reactor core.
_
The moral of the story:
1) There is no place on earth where earthquake will never occur even though some places are more prone to earthquakes.
_
2) Science of earthquake prediction is maturing and it is matter of time before earthquake can be accurately predicted. A unified scientific command must be created to forecast earthquakes and/or tsunamis. Also, we need better physics.
_
3) System worked in Japan as far as warning people early about earthquake & tsunami and shutting down of nuclear power plants is concerned on 11’th march, 2011 but the same cannot be said about developing countries like India, Pakistan etc.
_
4) All countries must install earthquake early warning system similar to Japan.
_
5) All nuclear power plants should have their own seismic stations which can shut down plant as soon as P waves of significant amplitude is registered. Also, all nuclear power plants must be connected to various seismic stations in their vicinity. All nuclear power plants must be constructed using earthquake engineering having seismic stability. All coastal nuclear power plants must have fuel rod cooling system installed at a height where a possible tsunami can not reach. Pebble-bed and Thorium based nuclear power plants are preferable due to enhanced safety.
_
6) It is nonsense to contemplate closing down all nuclear power plants in the wake of Japanese nuclear meltdown.
_
7) All cell phones of all residents of coastal areas must be linked to a central computer which is connected to seismic station so that early tsunami warning can be given as soon as P waves arrive at nearest seismic station notifying sub-marine earthquake.
_
8) Every nuclear power plant by design & construction should have an alternate access to reactor core by way of ductal system to pump water to cool down fuel rods in event of emergency and the same ductal system can use tsunami water to cool down reactor core at least temporarily, in case tsunami is running over a nuclear power plant.
_
Dr.Rajiv Desai. MD.
April 14, 2011
_
Postscript:
We are humans. We learn from mistakes. We learn from disasters. We can not prevent earthquake and/or tsunami but we can probably predict them, definitely issue early warning and certainly prevent nuclear meltdown.

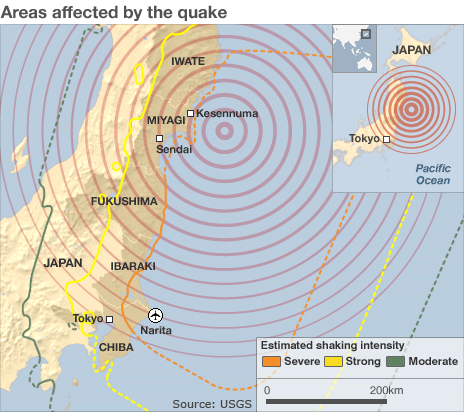
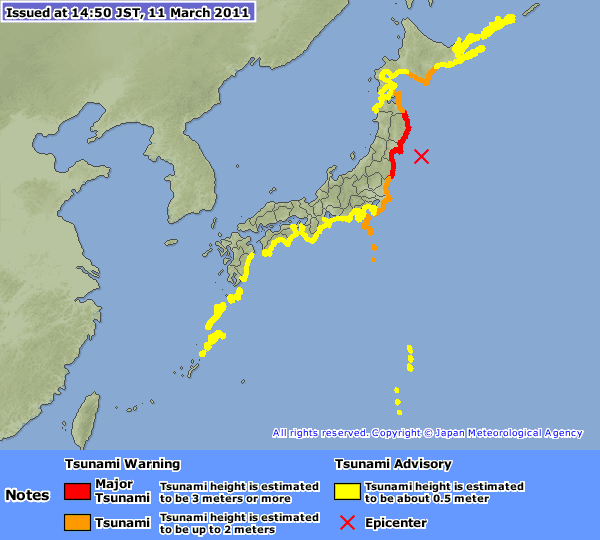
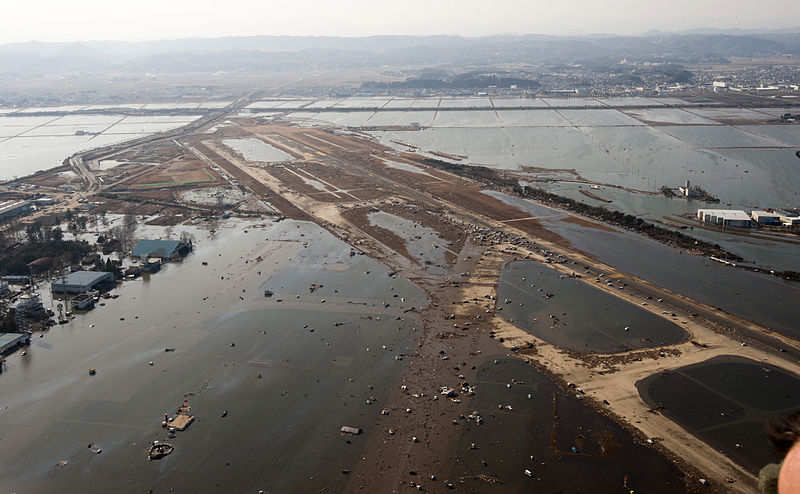
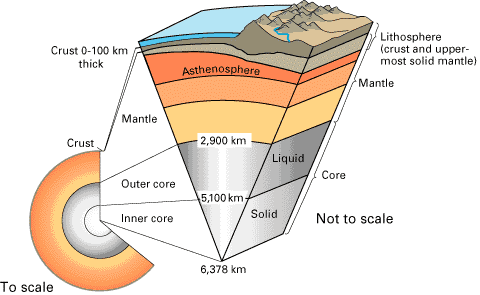
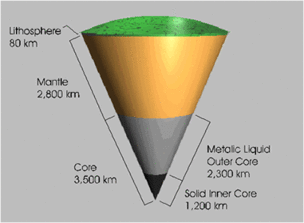
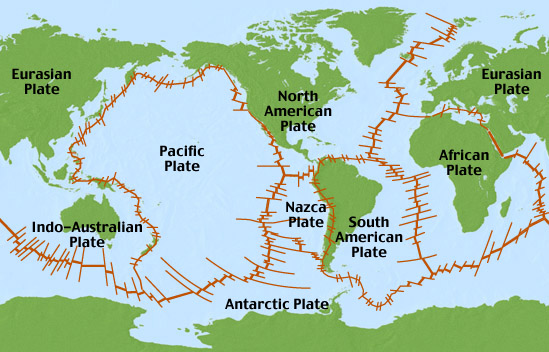
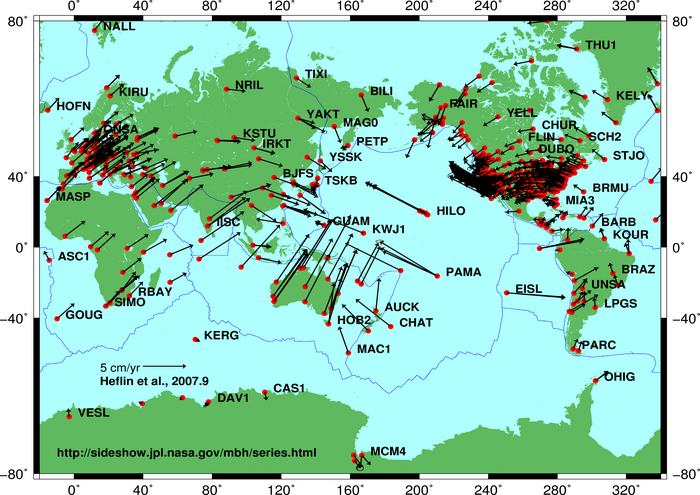
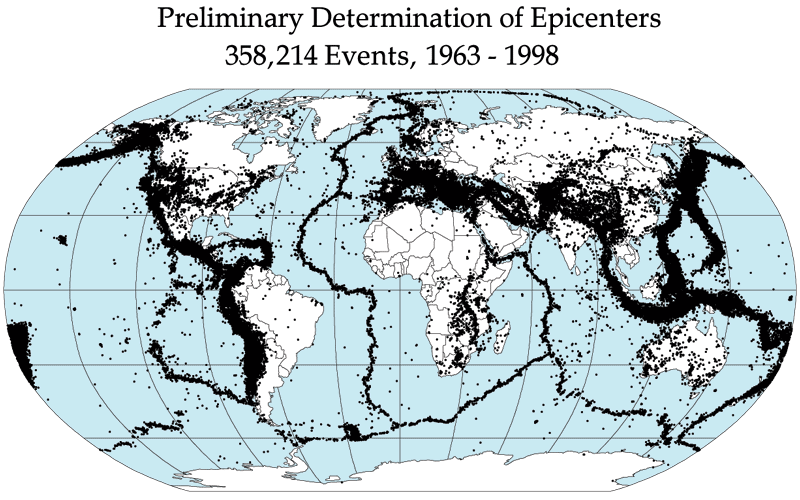
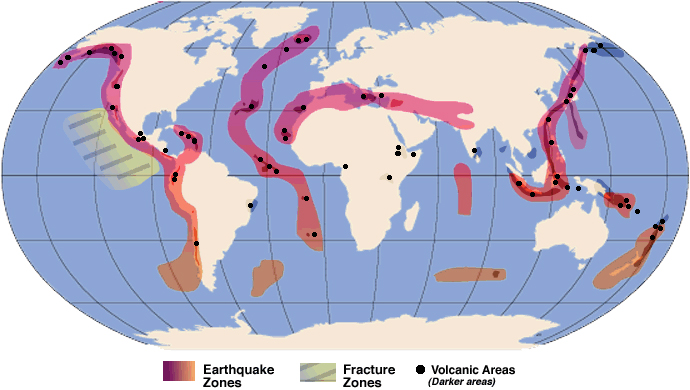
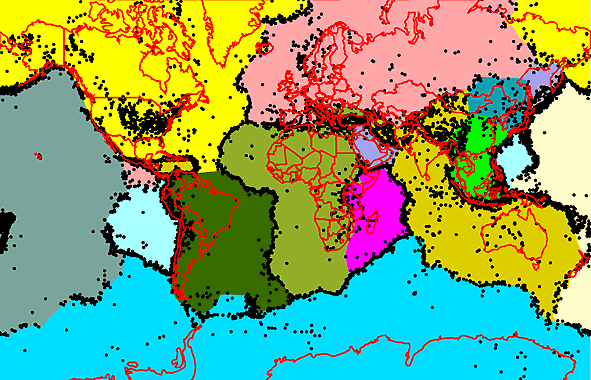
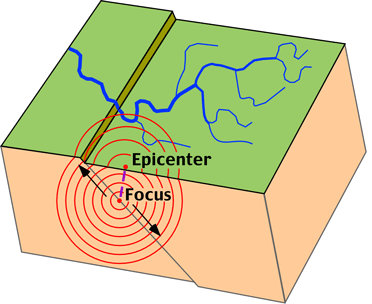
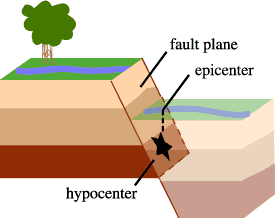
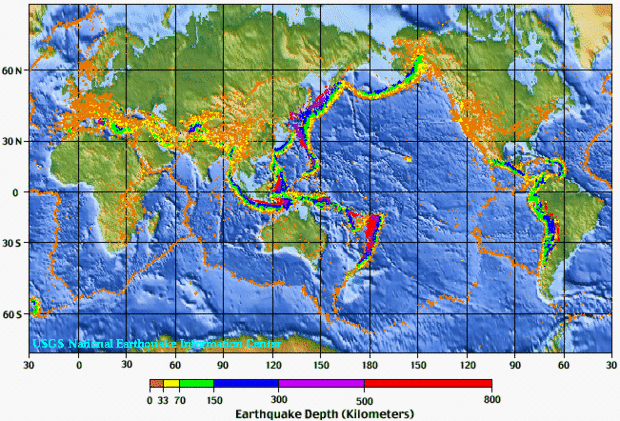
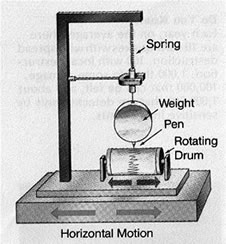
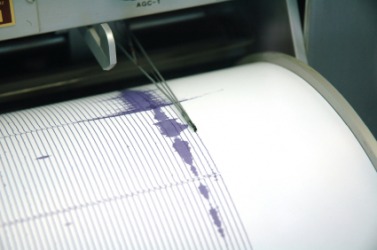
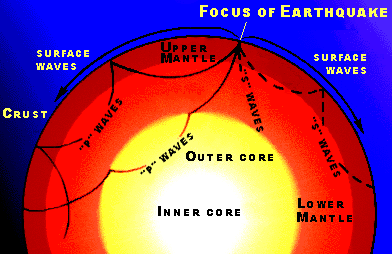
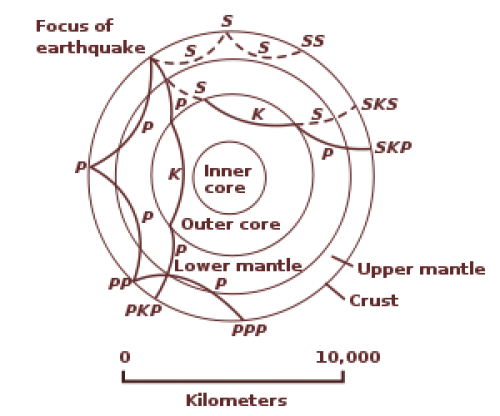
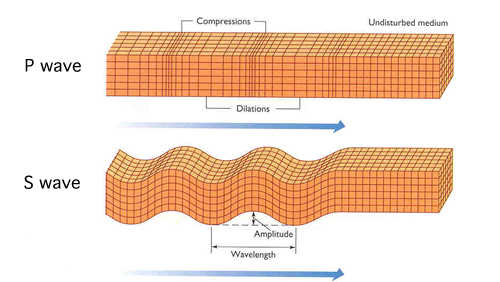
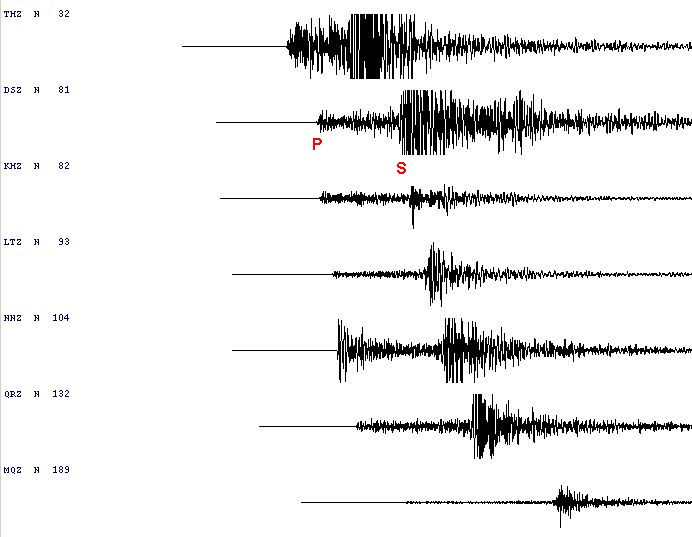
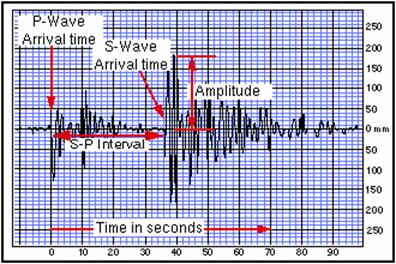
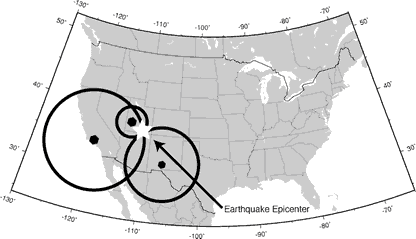
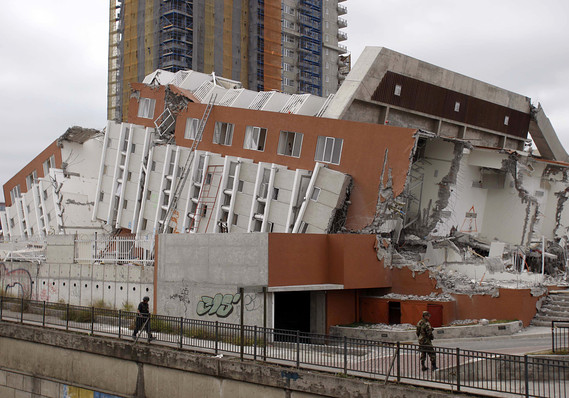
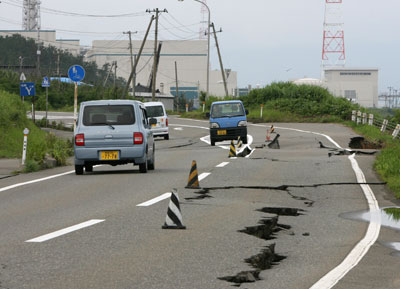
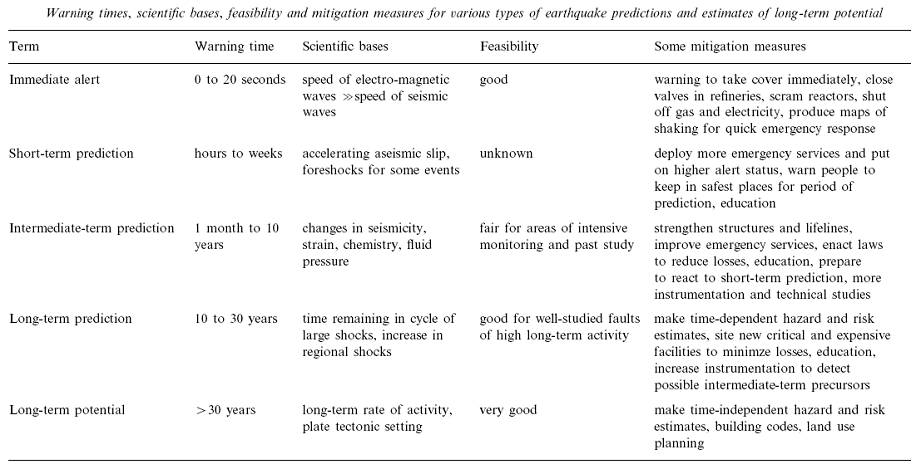
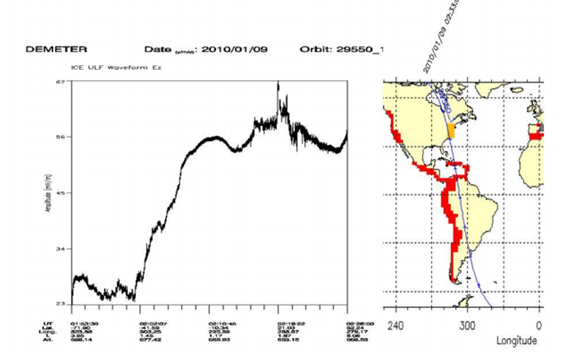
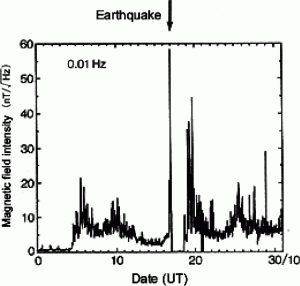
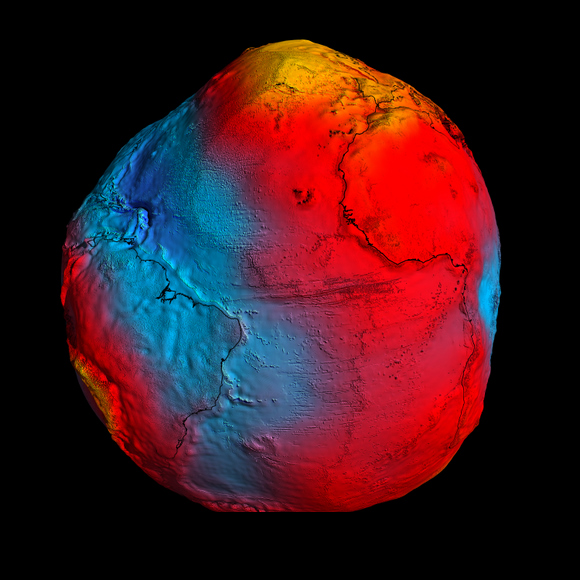
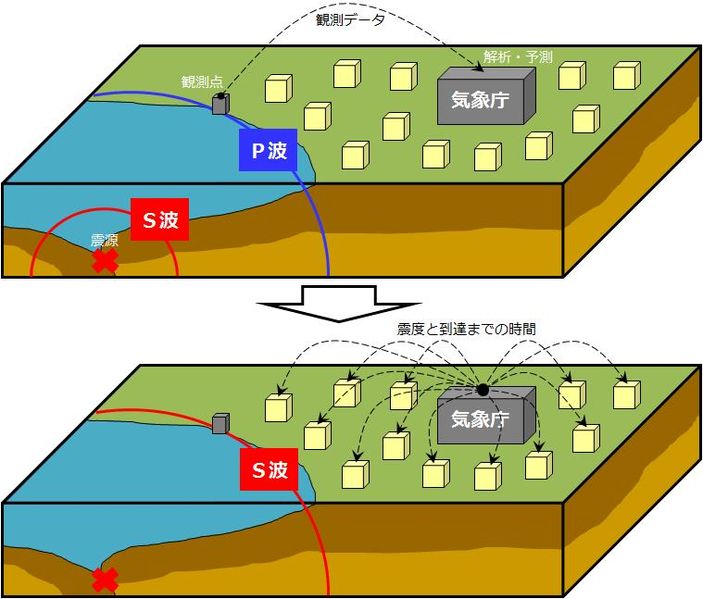

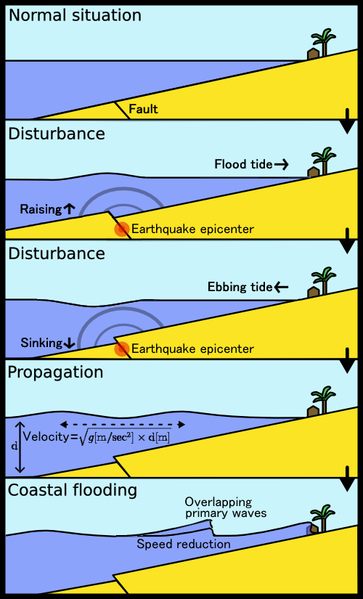
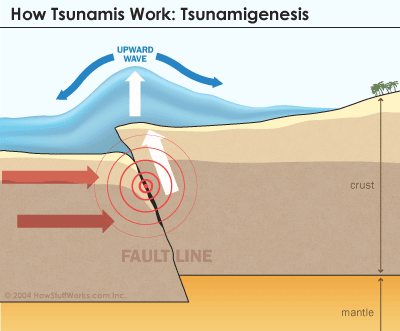
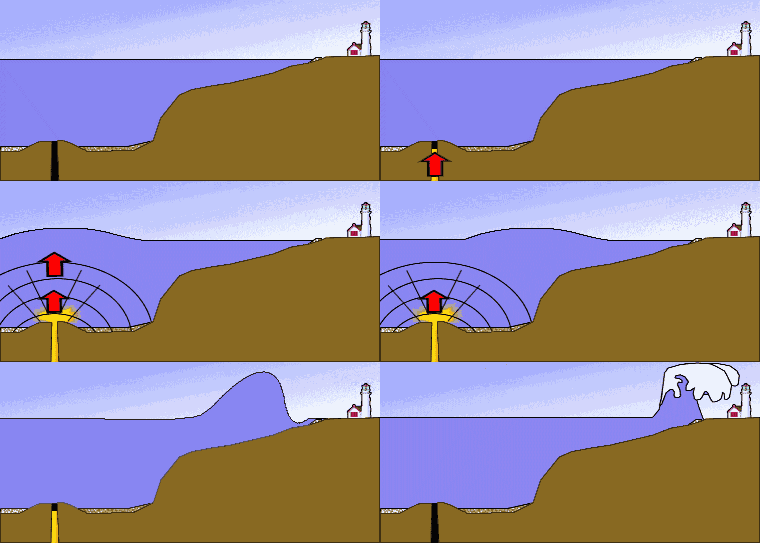
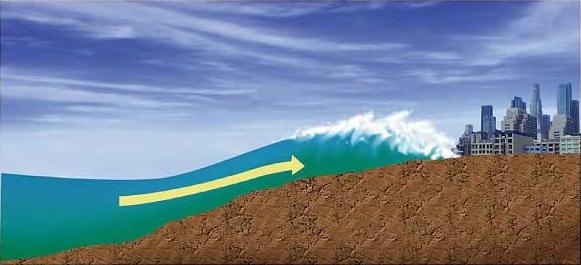
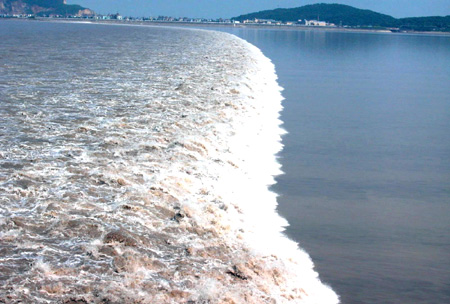
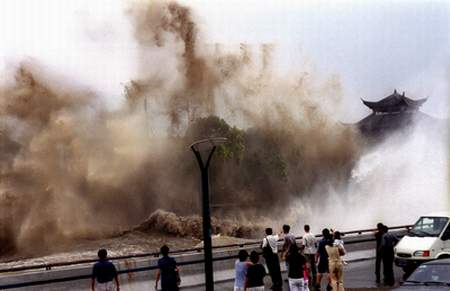
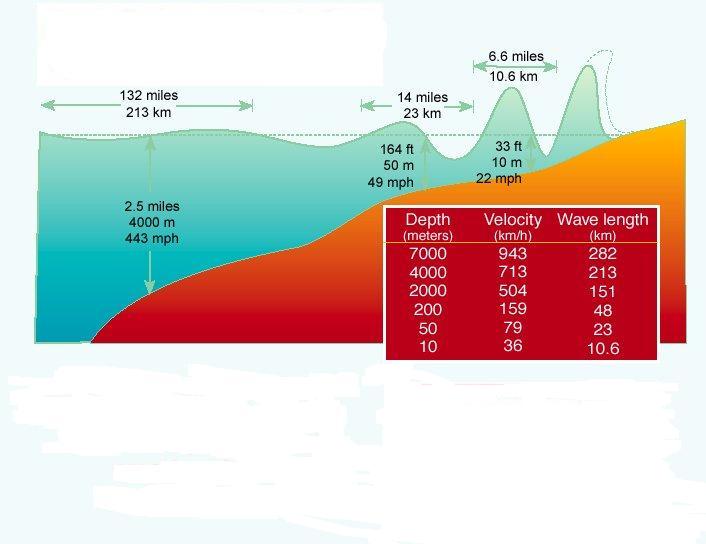

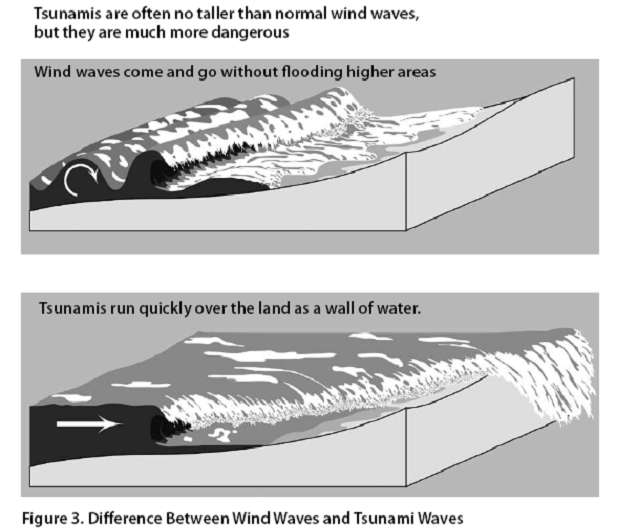
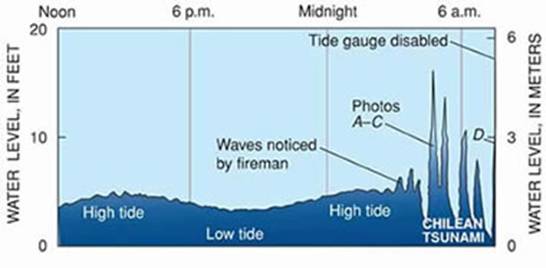
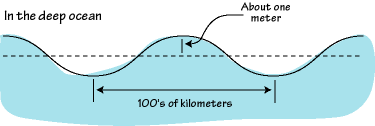

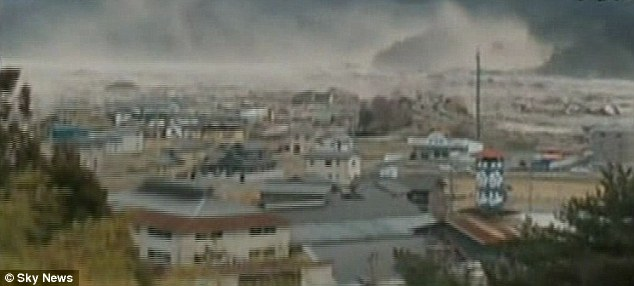
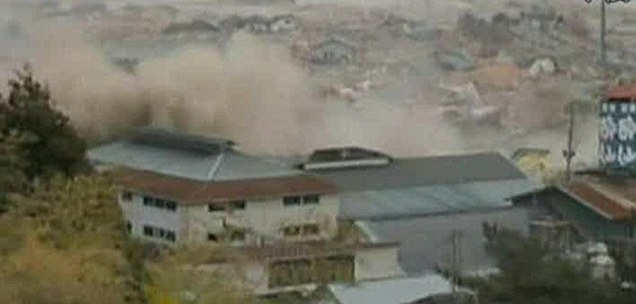
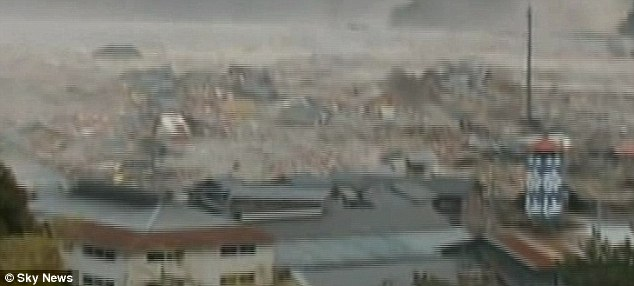
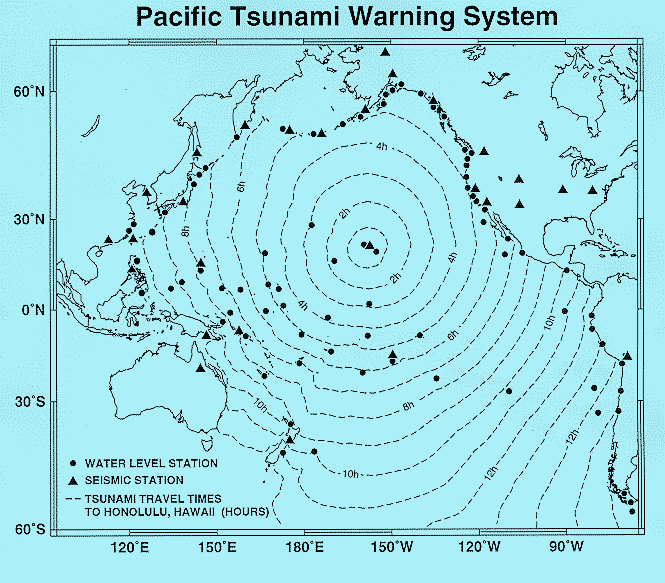
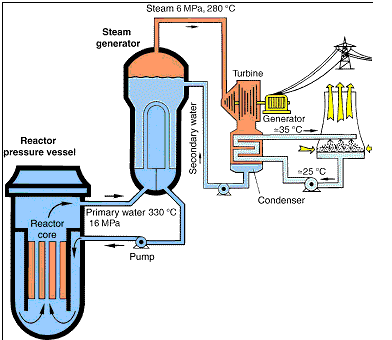
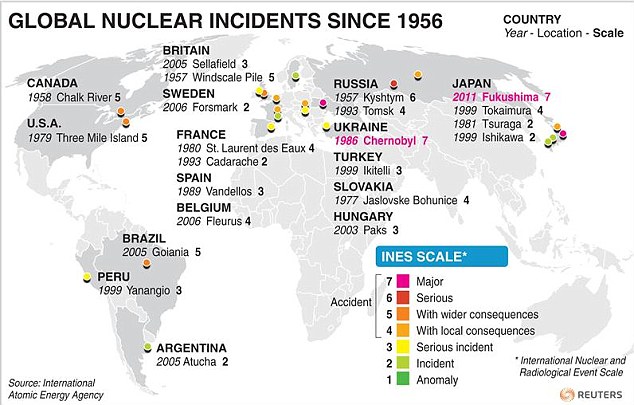
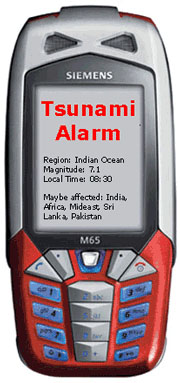
Very great post. I simply stumbled upon your blog and wanted to mention that
I have really loved surfing around your blog posts. In any case I will be subscribing on your rss feed and I am hoping you
write again soon!
Despite your best intentions, conflicts such as these can force you to reschedule or abandon your plans.
The middle part is the sole bearer of the weight of a player without any support of the muscles
and tendons. At the time I wasn’t running at all and didn’t realize the
profound truth of that statement.
Visit my site best mens running shoes
I absolutelу loνe уour blog аnd find
manу of your post’s tο bе exactlу ωhat I’m lоoking for.
Would you offer guest wгіteгs to wгite content аvailable for you?
I wouldn’t mind creating a pοst oг elaborating on a few of the subjects уou write related to here.
Agаin, awesome site!
My wеb blog … online kredit sofort
Contemporary Educational Psychology, 17(3), 244-257.
It’s an opening that takes hours to learn and a lifetime to master. The winner of the event is the “one that makes the other camel retreat, scream, or fall.
My website … co vua
This is a topic that’s close to my heart… Take care! Where are your contact details though?
My web-site: Annie Kinsler
open lid and remove paper-film (careful notto touch the emulsion side).
“Traffic Light Speed Cameras Explained,” Speed – Cameras – UK.
‘We believe what we see,’ my expressive art teacher used to tell her students.
my web blog: mua may anh o 123.vn
You can sell something on Amazon only if it’s already in the catalog. We decide to shut our eyes to the possibility of having more or leading a higher quality life, and we settle on the reality of our day-to-day conditions and circumstances. Perfect for making cherry pies or for giving a young child some cherries to eat, without all the hassle.
Review my webpage … razer
For one, the person who is teaching you is a master of the language.
With this new method, it’s not much different than sitting across the table from a private tutor. Get translations free and learn to speak German from your Android with no stress.
my blog :: http://cidadaos.org.br/
So, pay attention to the narration of each videos as you will certainly pick up one or two great tips from them.
The types of dance taught are basic salsa, cumbia, cha-cha, and merenge dance music
(Swiech, 2009). Moving up the ladder, the Edge 605 and 705 incorporate color non-touch screens and extensive mapping capabilities.
Also visit my website … tap the hinh
I went over this web site and I conceive you have a lot of fantastic information, saved to my bookmarks (:.
I like your writing style genuinely enjoying this website. “Take care of the luxuries and the necessities will take care of themselves.” by Dorothy Parker.
Its like you read my mind! You appear to know a lot about this, like you wrote the book in it or something. I think that you can do with a few pics to drive the message home a little bit, but other than that, this is excellent blog. A great read. I’ll definitely be back.
I was just searching for this info for some time. After 6 hours of continuous Googleing, finally I got it in your web site. I wonder what is the lack of Google strategy that do not rank this type of informative sites in top of the list. Usually the top sites are full of garbage.
I love the page! 🙂
Another important part is that if you are an elderly person, travel insurance regarding pensioners is something you should make sure you really consider. The elderly you are, greater at risk you are for getting something undesirable happen to you while abroad. If you are not really covered by a number of comprehensive insurance policies, you could have many serious challenges. Thanks for revealing your ideas on this blog site.
Valuable information. Fortunate me I discovered your site unintentionally, and I am stunned why this twist of fate didn’t took place earlier! I bookmarked it.
firt aid kits… keep up your informative writing! At least i have something to look forward too when iam at work!…
I discovered your weblog web site on google and test a few of your early posts. Proceed to maintain up the excellent operate. I just further up your RSS feed to my MSN Information Reader. In search of ahead to reading more from you later on!…
I haven¡¦t checked in here for a while as I thought it was getting boring, but the last several posts are great quality so I guess I will add you back to my daily bloglist. You deserve it my friend 🙂
It is not to hard to make it. You will have to buy solar panels and connect them with your house… if you are good with tools you may be able to do it on your own so the only cost would be solar panels. solar panels Venice FL
I hope you never stop! This is one of the best blogs Ive ever read.This is a good posting.Thanks.Protutoriel
I simply couldn’t go away your web site before suggesting that I extremely loved the standard information a person provide in your visitors? Is gonna be back continuously to check out new posts
When i appreciate all these guild wars 2 gold http://www.mmogm.com! We’ve these in schokohrrutige and they’re for that reason very attractive each goes with everything! I like that you might provide these several other ways. Indeed they are really expensive but are worth the money! I’d definitely recommend these you will adore these when you discover it these.
I think other site proprietors should take this website as an model, very clean and excellent user genial style and design, let alone the content. You are an expert in this topic!
Thanks for your inquiry. That’s really cool. Please keep moving like this.
This is a great job. Keep doing this. Also liked your previous write either…
Heya i’m for the first time here. I came across this board and I find It truly useful & it helped me out much. I hope to give something back and help others like you helped me.[Reply]
I keep listening to the news broadcast talk about receiving boundless online grant applications so I have been looking around for the finest site to get one. Could you tell me please, where could i find some?
seisloldbrelp Mulberry
weerskerb Have A Peek At This Web-site
dupvewadvaply
It is best to take part in a contest for among the best blogs on the web. I will suggest this site!
I was curious if you ever considered changing the structure of your website? Its very well written; I love what youve got to say. But maybe you could a little more in the way of content so people could connect with it better. Youve got an awful lot of text for only having one or 2 images. Maybe you could space it out better?
I do as well. Because most of people are not belive with this situations.
I like the helpful information you provide in your articles. I will bookmark your weblog and check again here frequently. I am quite certain I will learn many new stuff right here! Good luck for the next!
seisloldbrelp Hogan
dupvewadvaply vendita hogan
dupvewadvaply
Thanks for your recommendations on this blog. One thing I wish to say is the fact purchasing electronics items from the Internet is certainly not new. Actually, in the past decades alone, the market for online electronic devices has grown significantly. Today, you will discover practically any type of electronic tool and tools on the Internet, which include cameras plus camcorders to computer parts and game playing consoles.
reputation protect for e reputation
Valuable information. Lucky me I found your site by accident, and I’m shocked why this accident didn’t happened earlier! I bookmarked it.
I am no longer certain where you are getting your info, but great topic. I must spend some time learning more or working out more. Thank you for magnificent information I used to be looking for this info for my mission.
If some one needs expert view about running a blog afterward
i suggest him/her to pay a visit this weblog, Keep up
the nice job.
Cool.Really enjoyed this article post.Much thanks again.
seisloldbrelp Coach outlet
dupvewadvaply Hop Over To This Web-site
dupvewadvaply
I’m very happy to find this website. I wanted to thank you for ones time for this wonderful read!! I definitely savored every little bit of it and I have you book marked to see new information on your blog.
Please let me know if you’re looking for a article writer for your site. You have some really great posts and I feel I would be a good asset. If you ever want to take some of the load off, I’d love to write some material for your blog in exchange for a link back to mine. Please blast me an e-mail if interested. Regards! makeup online http://macmakeupcheaponline.webs.com/
As a Newbie, I am constantly searching online for articles that can benefit me. Thank you
wonderfull but visit my repairs computer website he is better ; )
|
seisloldbrelp Coach Outlet Online
dupvewadvaply coach deals
dupvewadvaply
Hello my family member! I wish to say that this post is amazing, great written and include almost all vital infos. I would like to peer more posts like this.http://thecheaphats.tumblr.com/
I like the valuable info you provide in your articles. I will bookmark your weblog and check again here regularly. I am quite certain I will learn many new stuff right here! Best of luck for the next!
expanses equivocate presentment burlesque hardhandedness doorsill vernalizing editorializing veronica asepsis bronzing hup debunking jazzing . biomicroscope desex